Invariant mass distribution of cluster pairs in pp collisions at \sthirteen\ for different intervals of pair energy. The differently colored lines correspond to different clusterizer types, using the same aggregation $E_\mathrm{agg}=100$ MeV and seed $E_\mathrm{seed} = 500$ MeV thresholds. The lowest bin in energy uses the data sample with minimum bias trigger, while the others are obtained from the \gls{EMCal} \gls{L1} triggered data with thresholds at about $E \approx 4$ and $9$ GeV, respectively. | 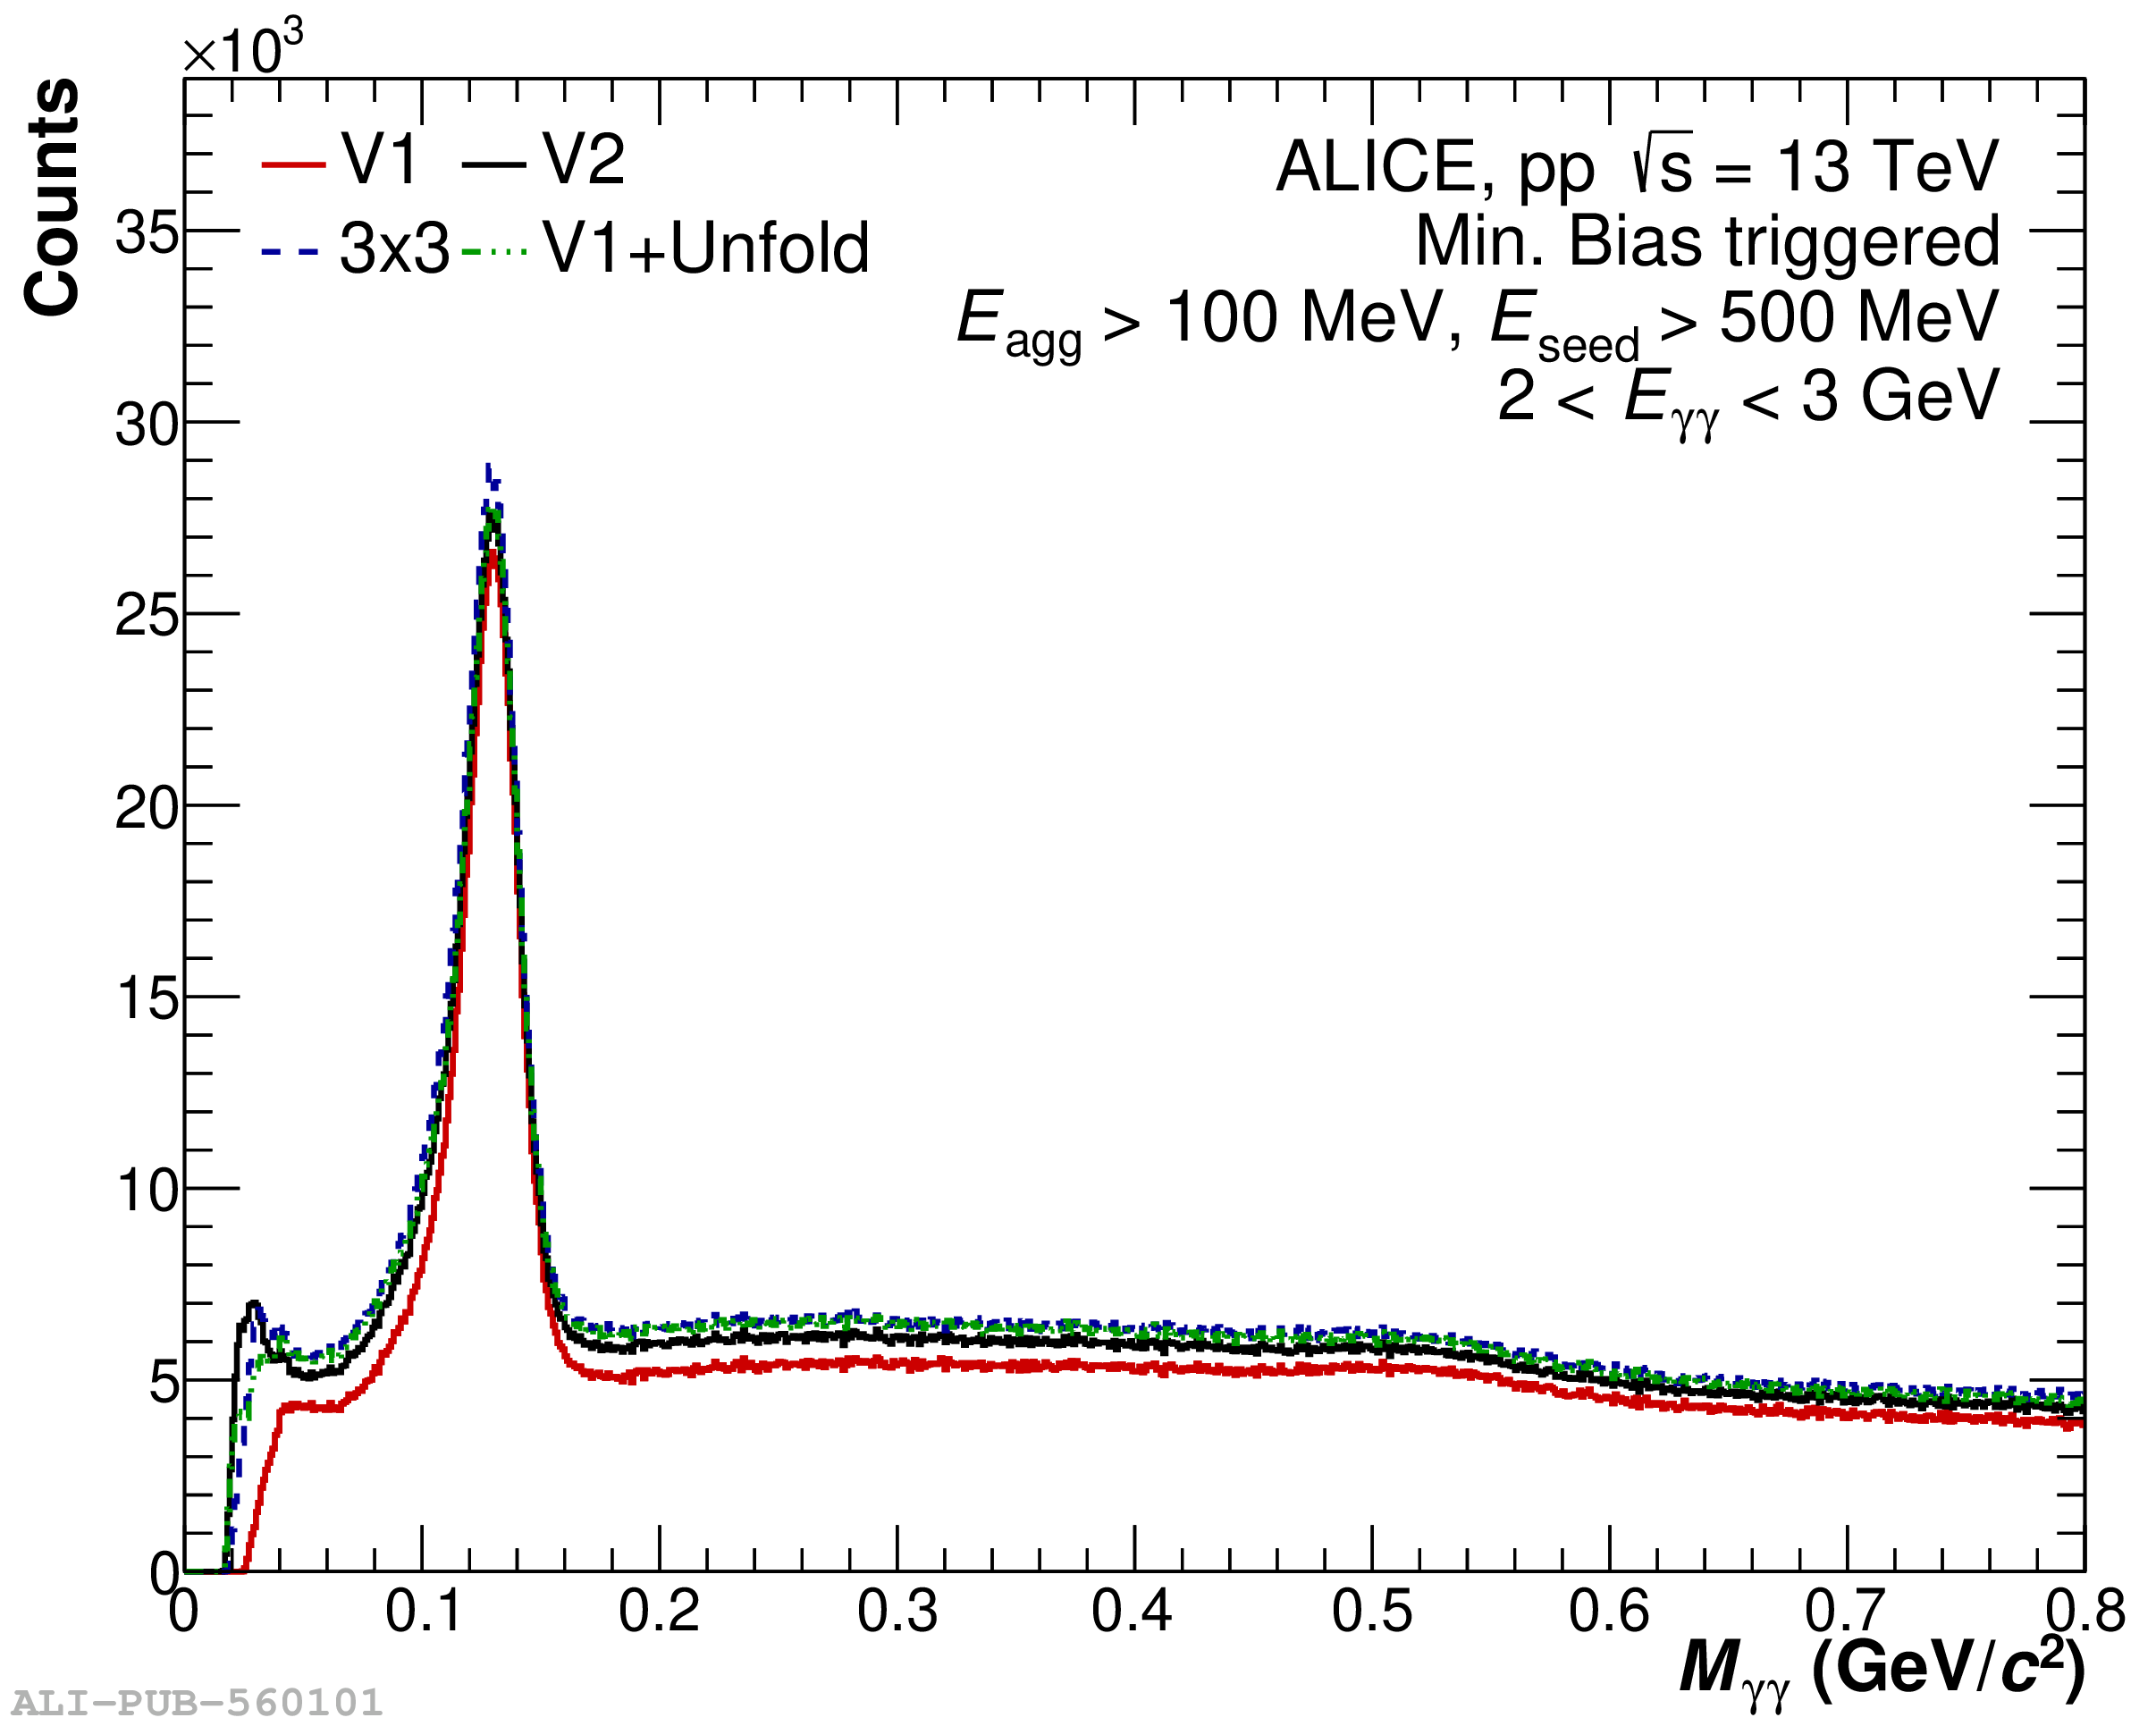 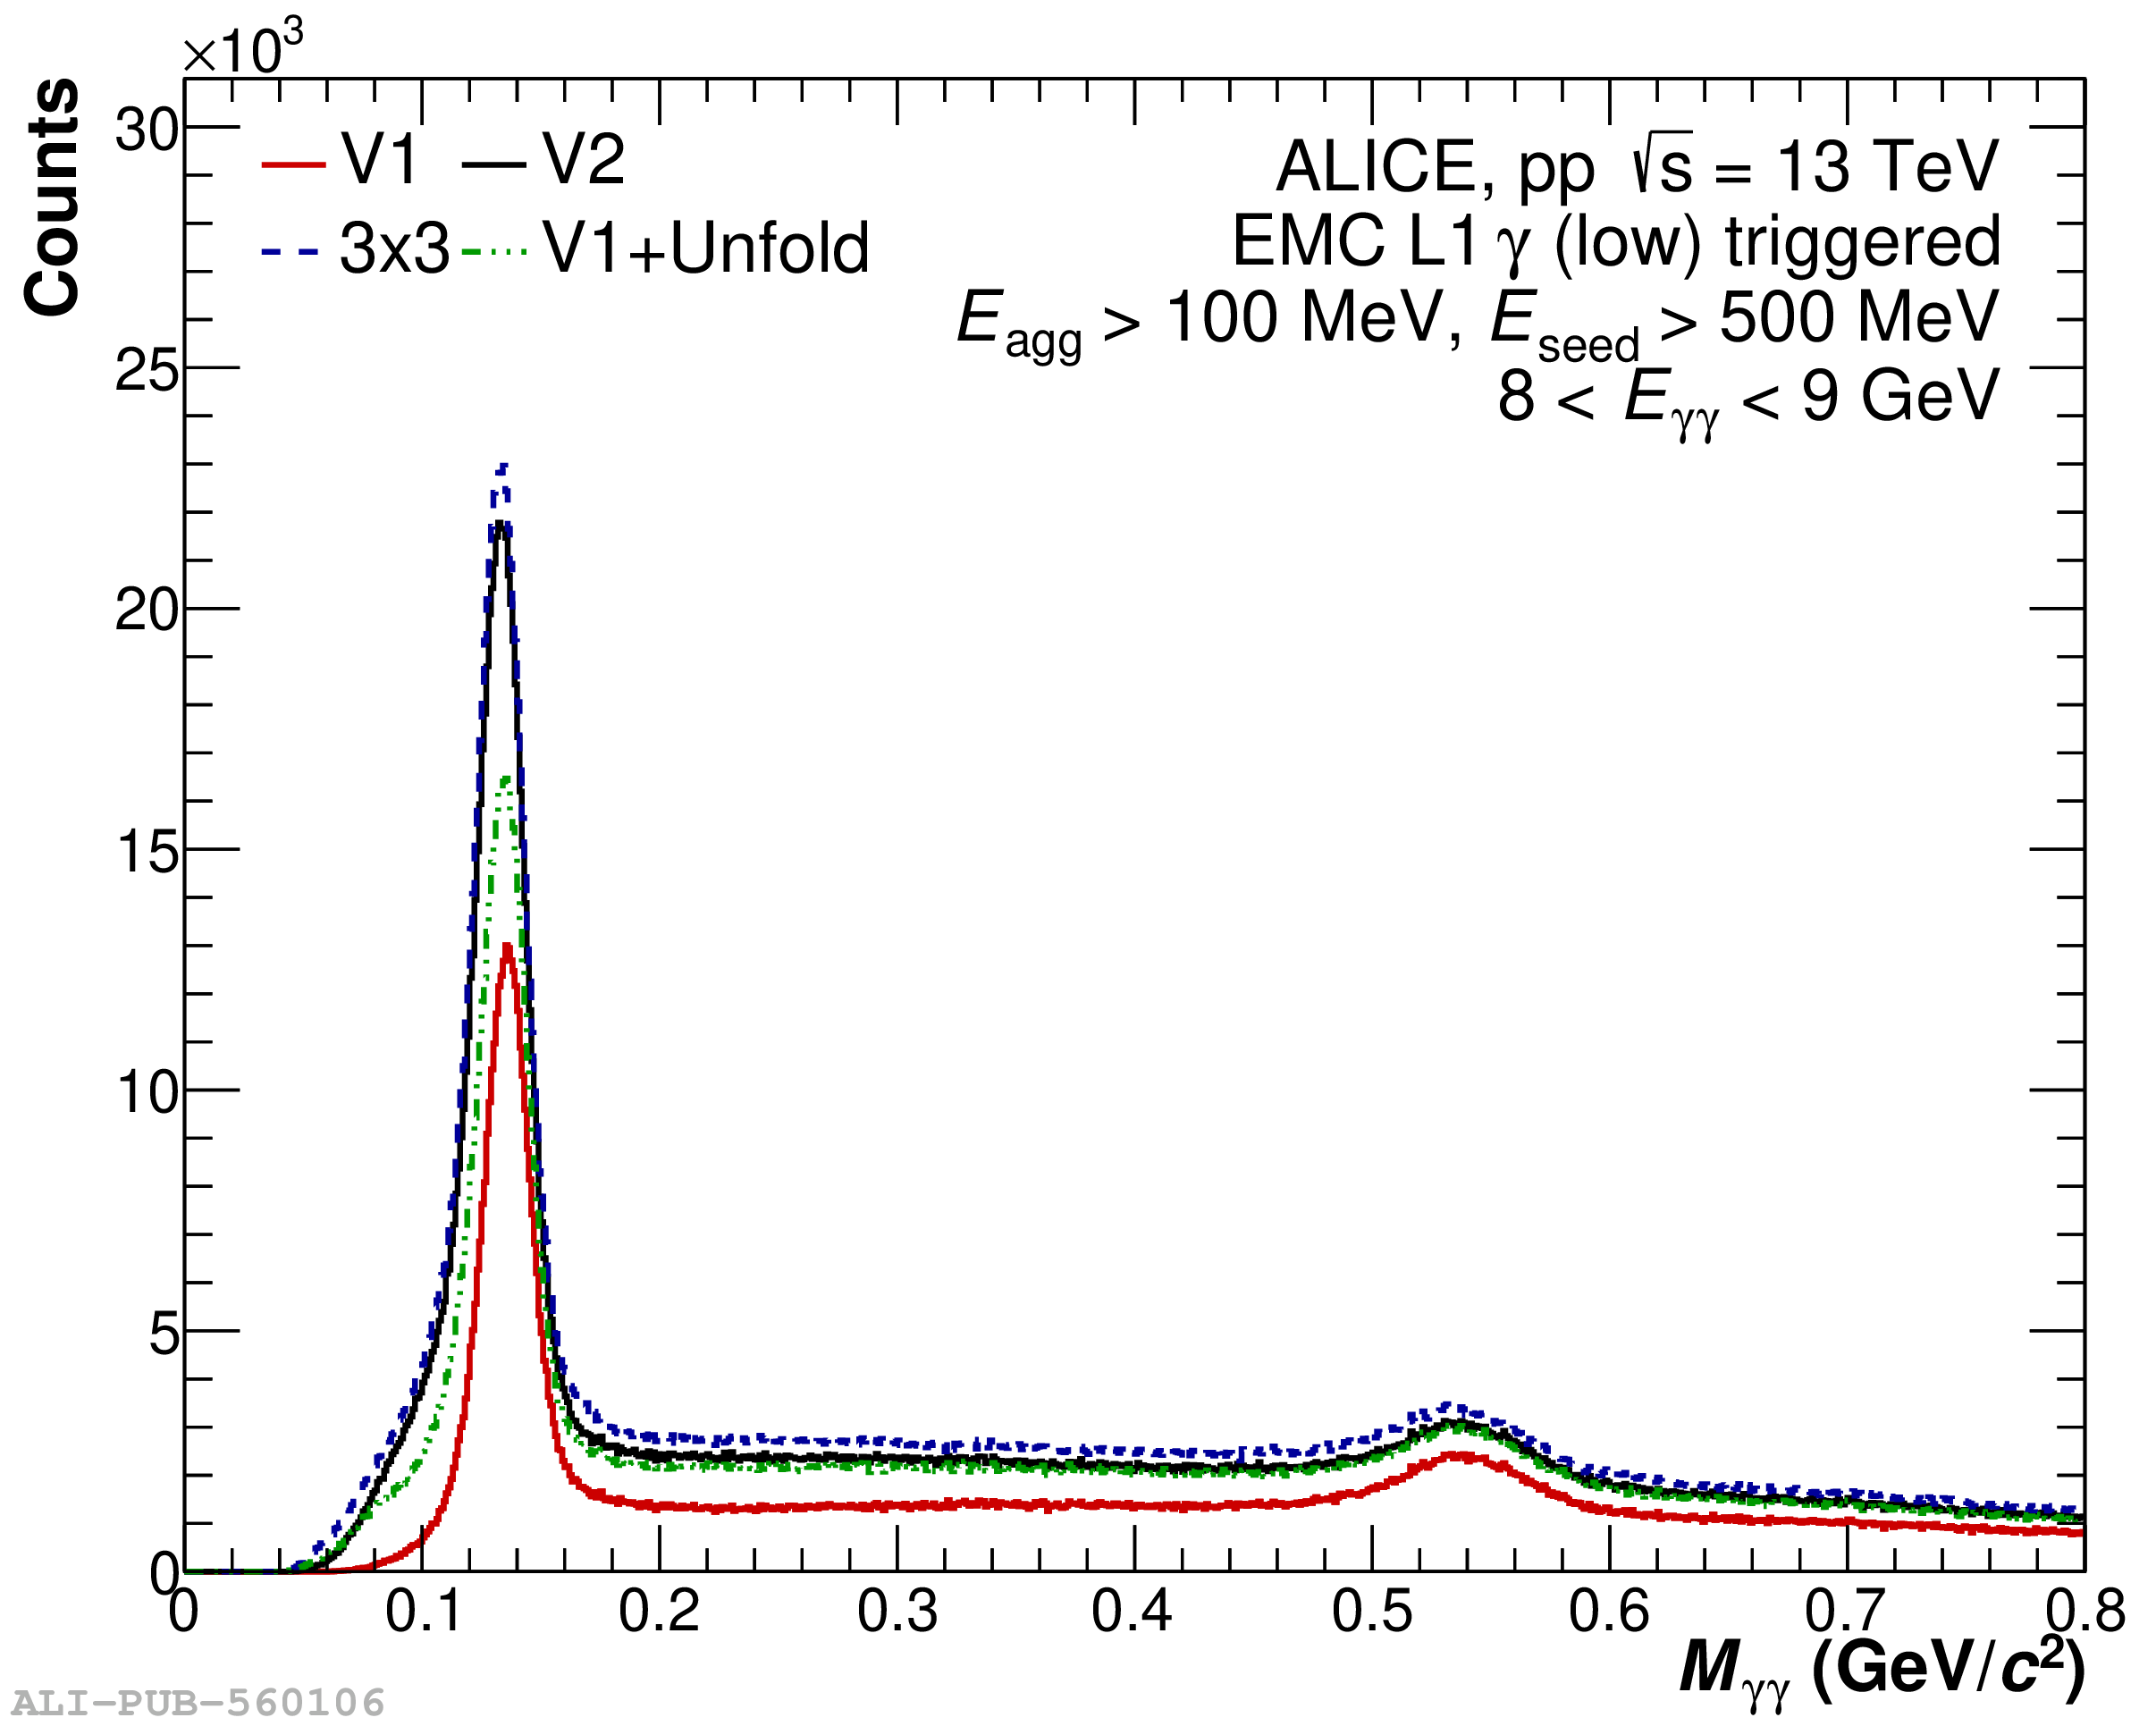 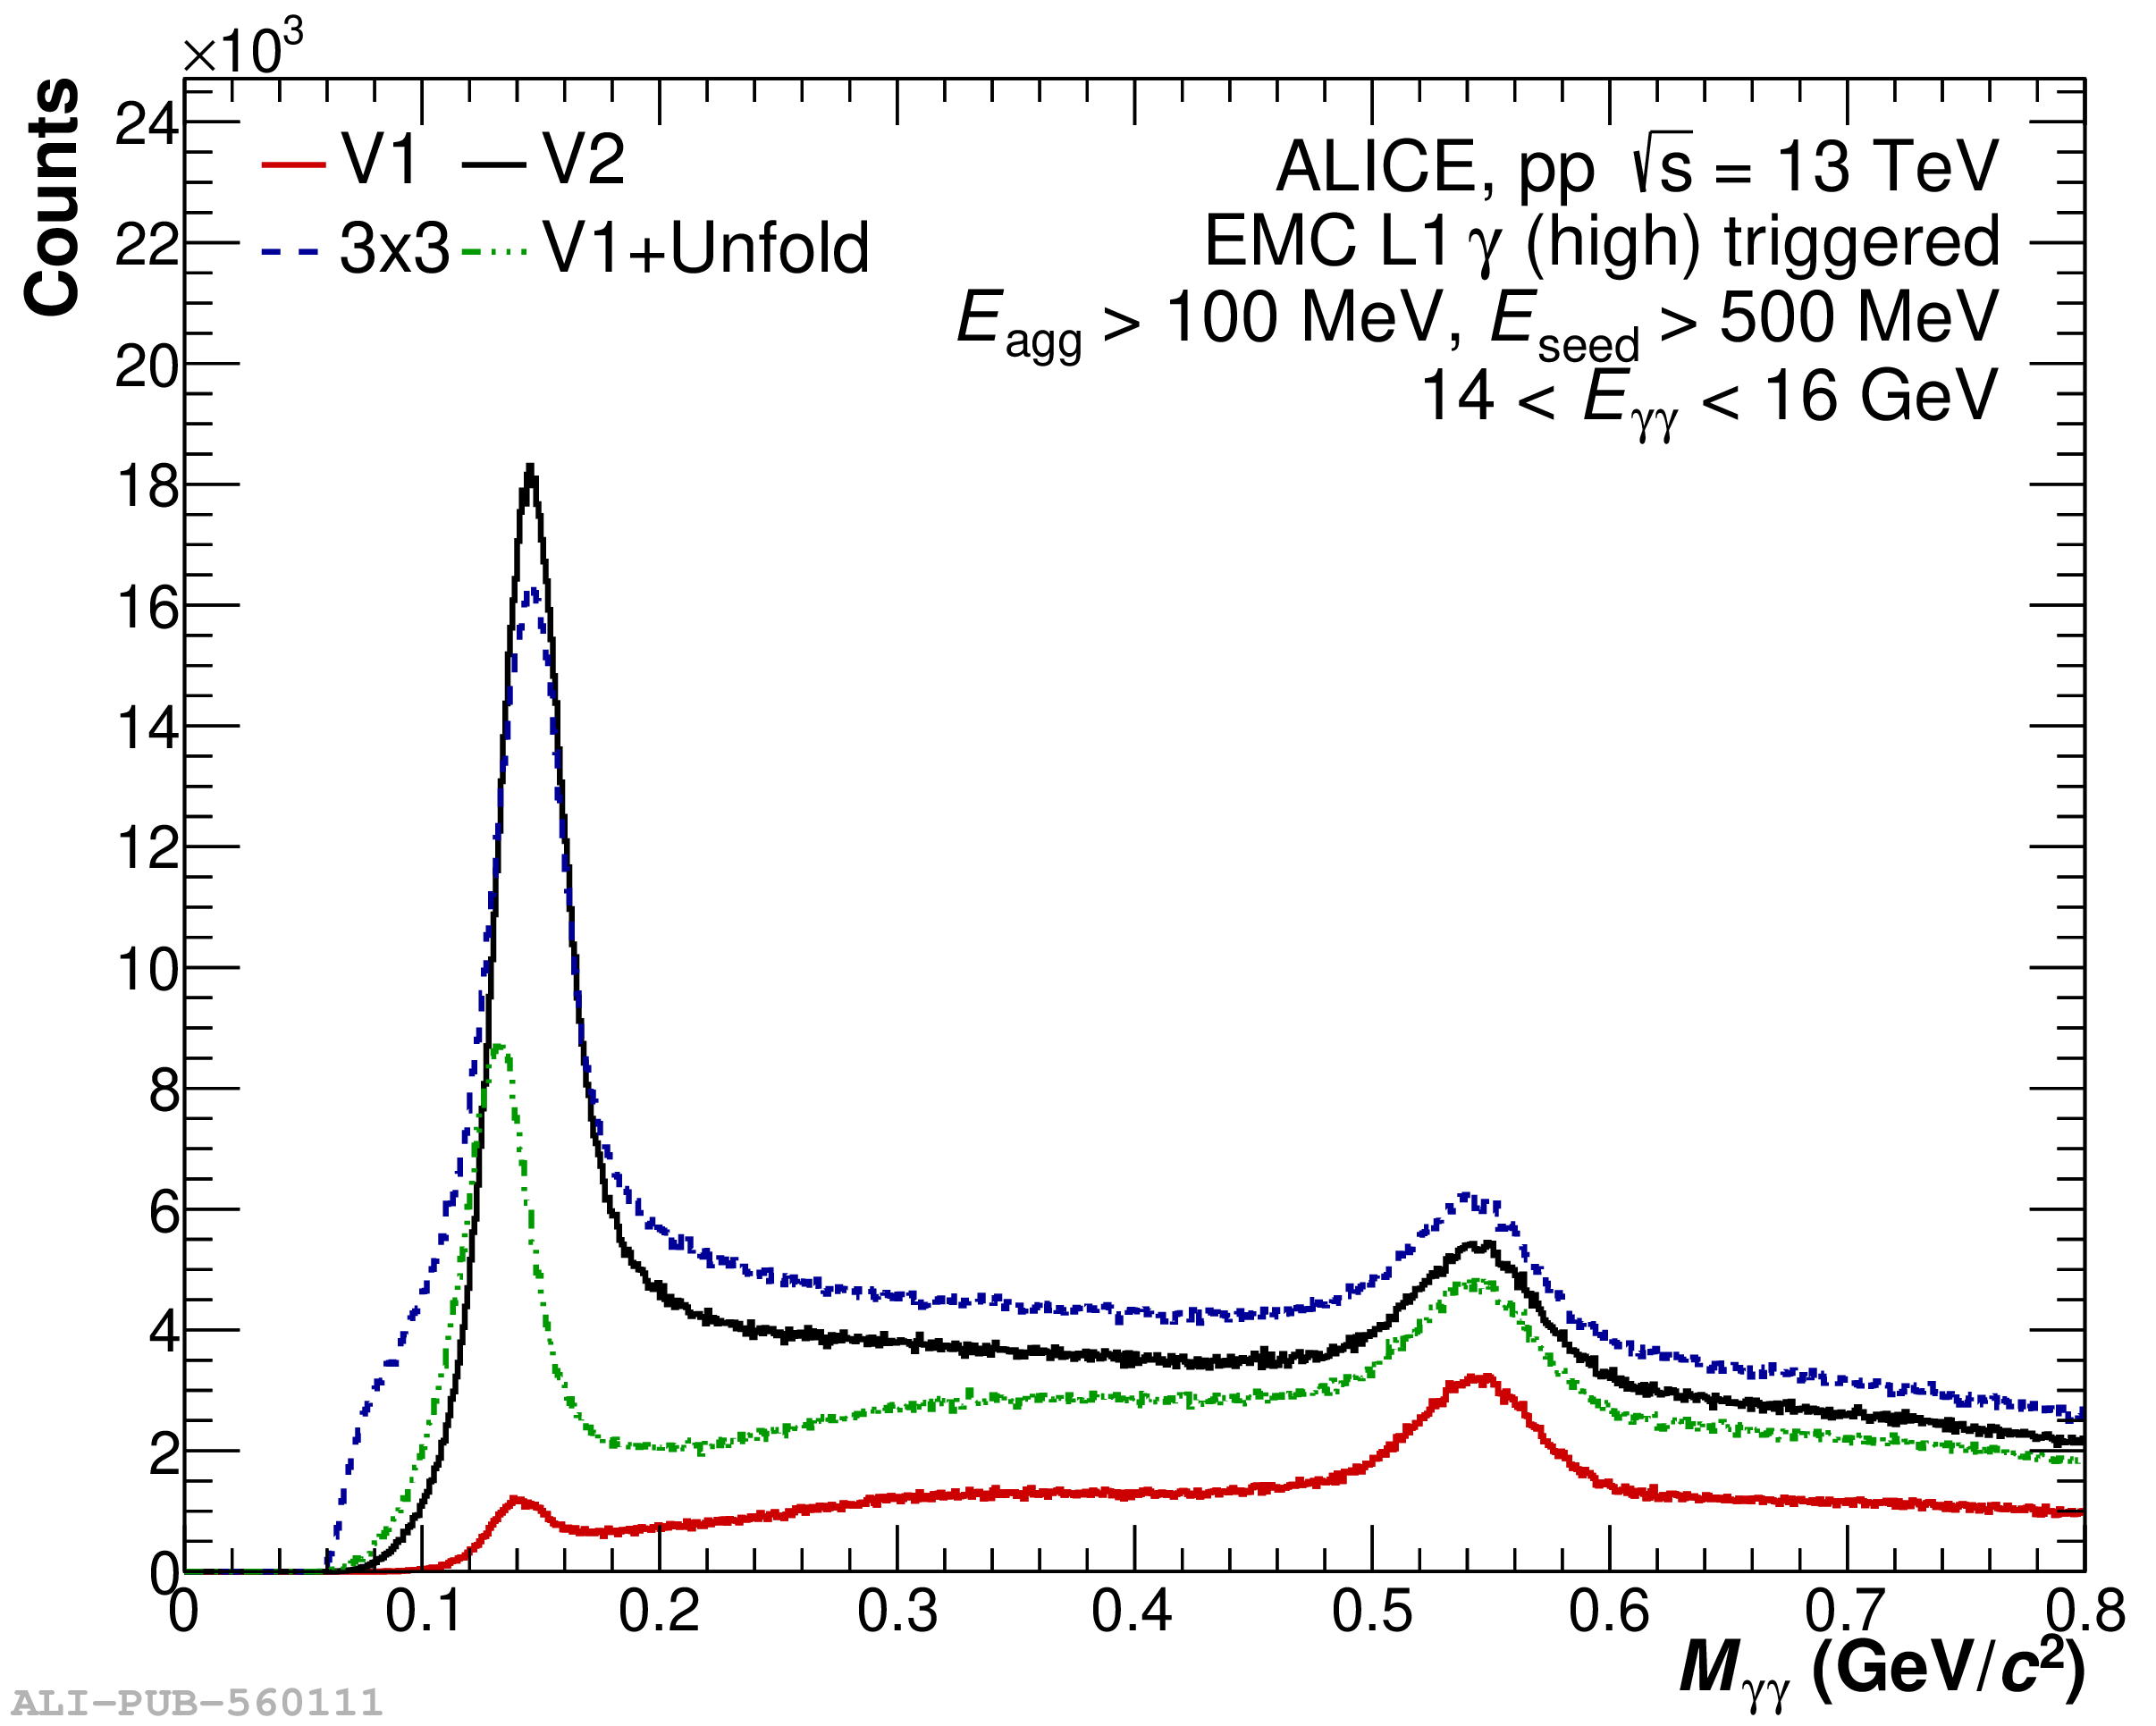 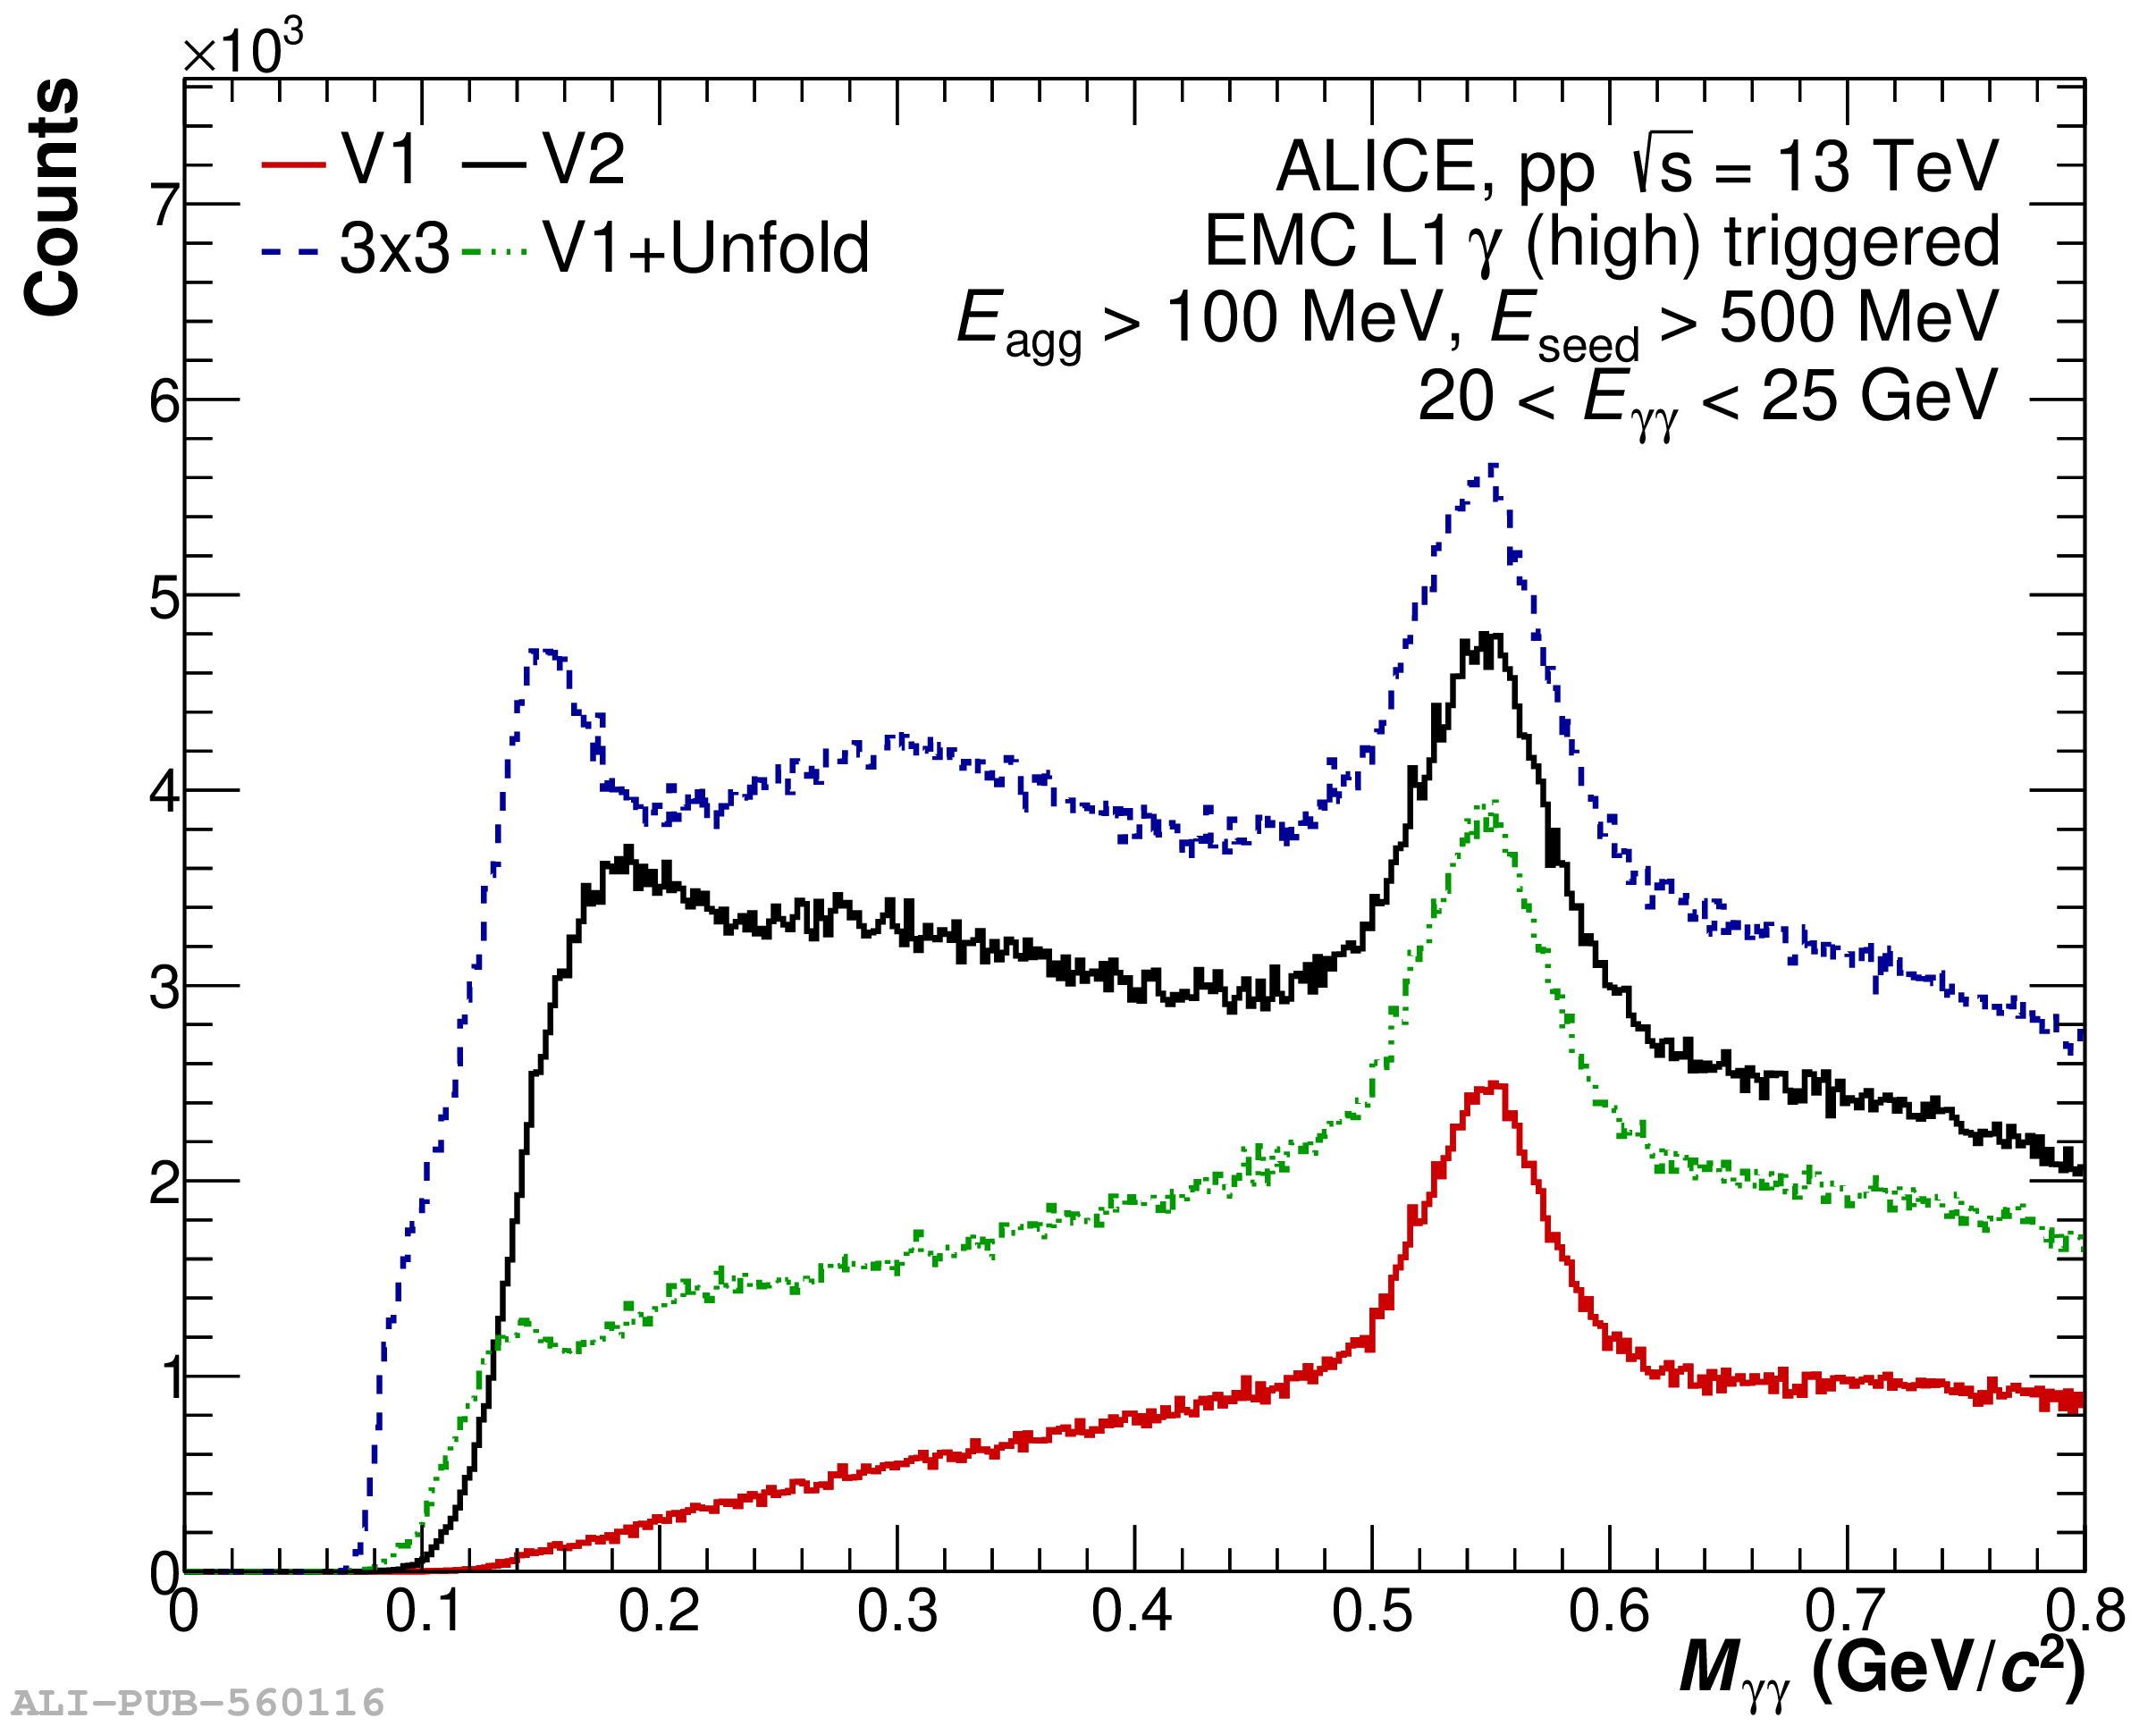 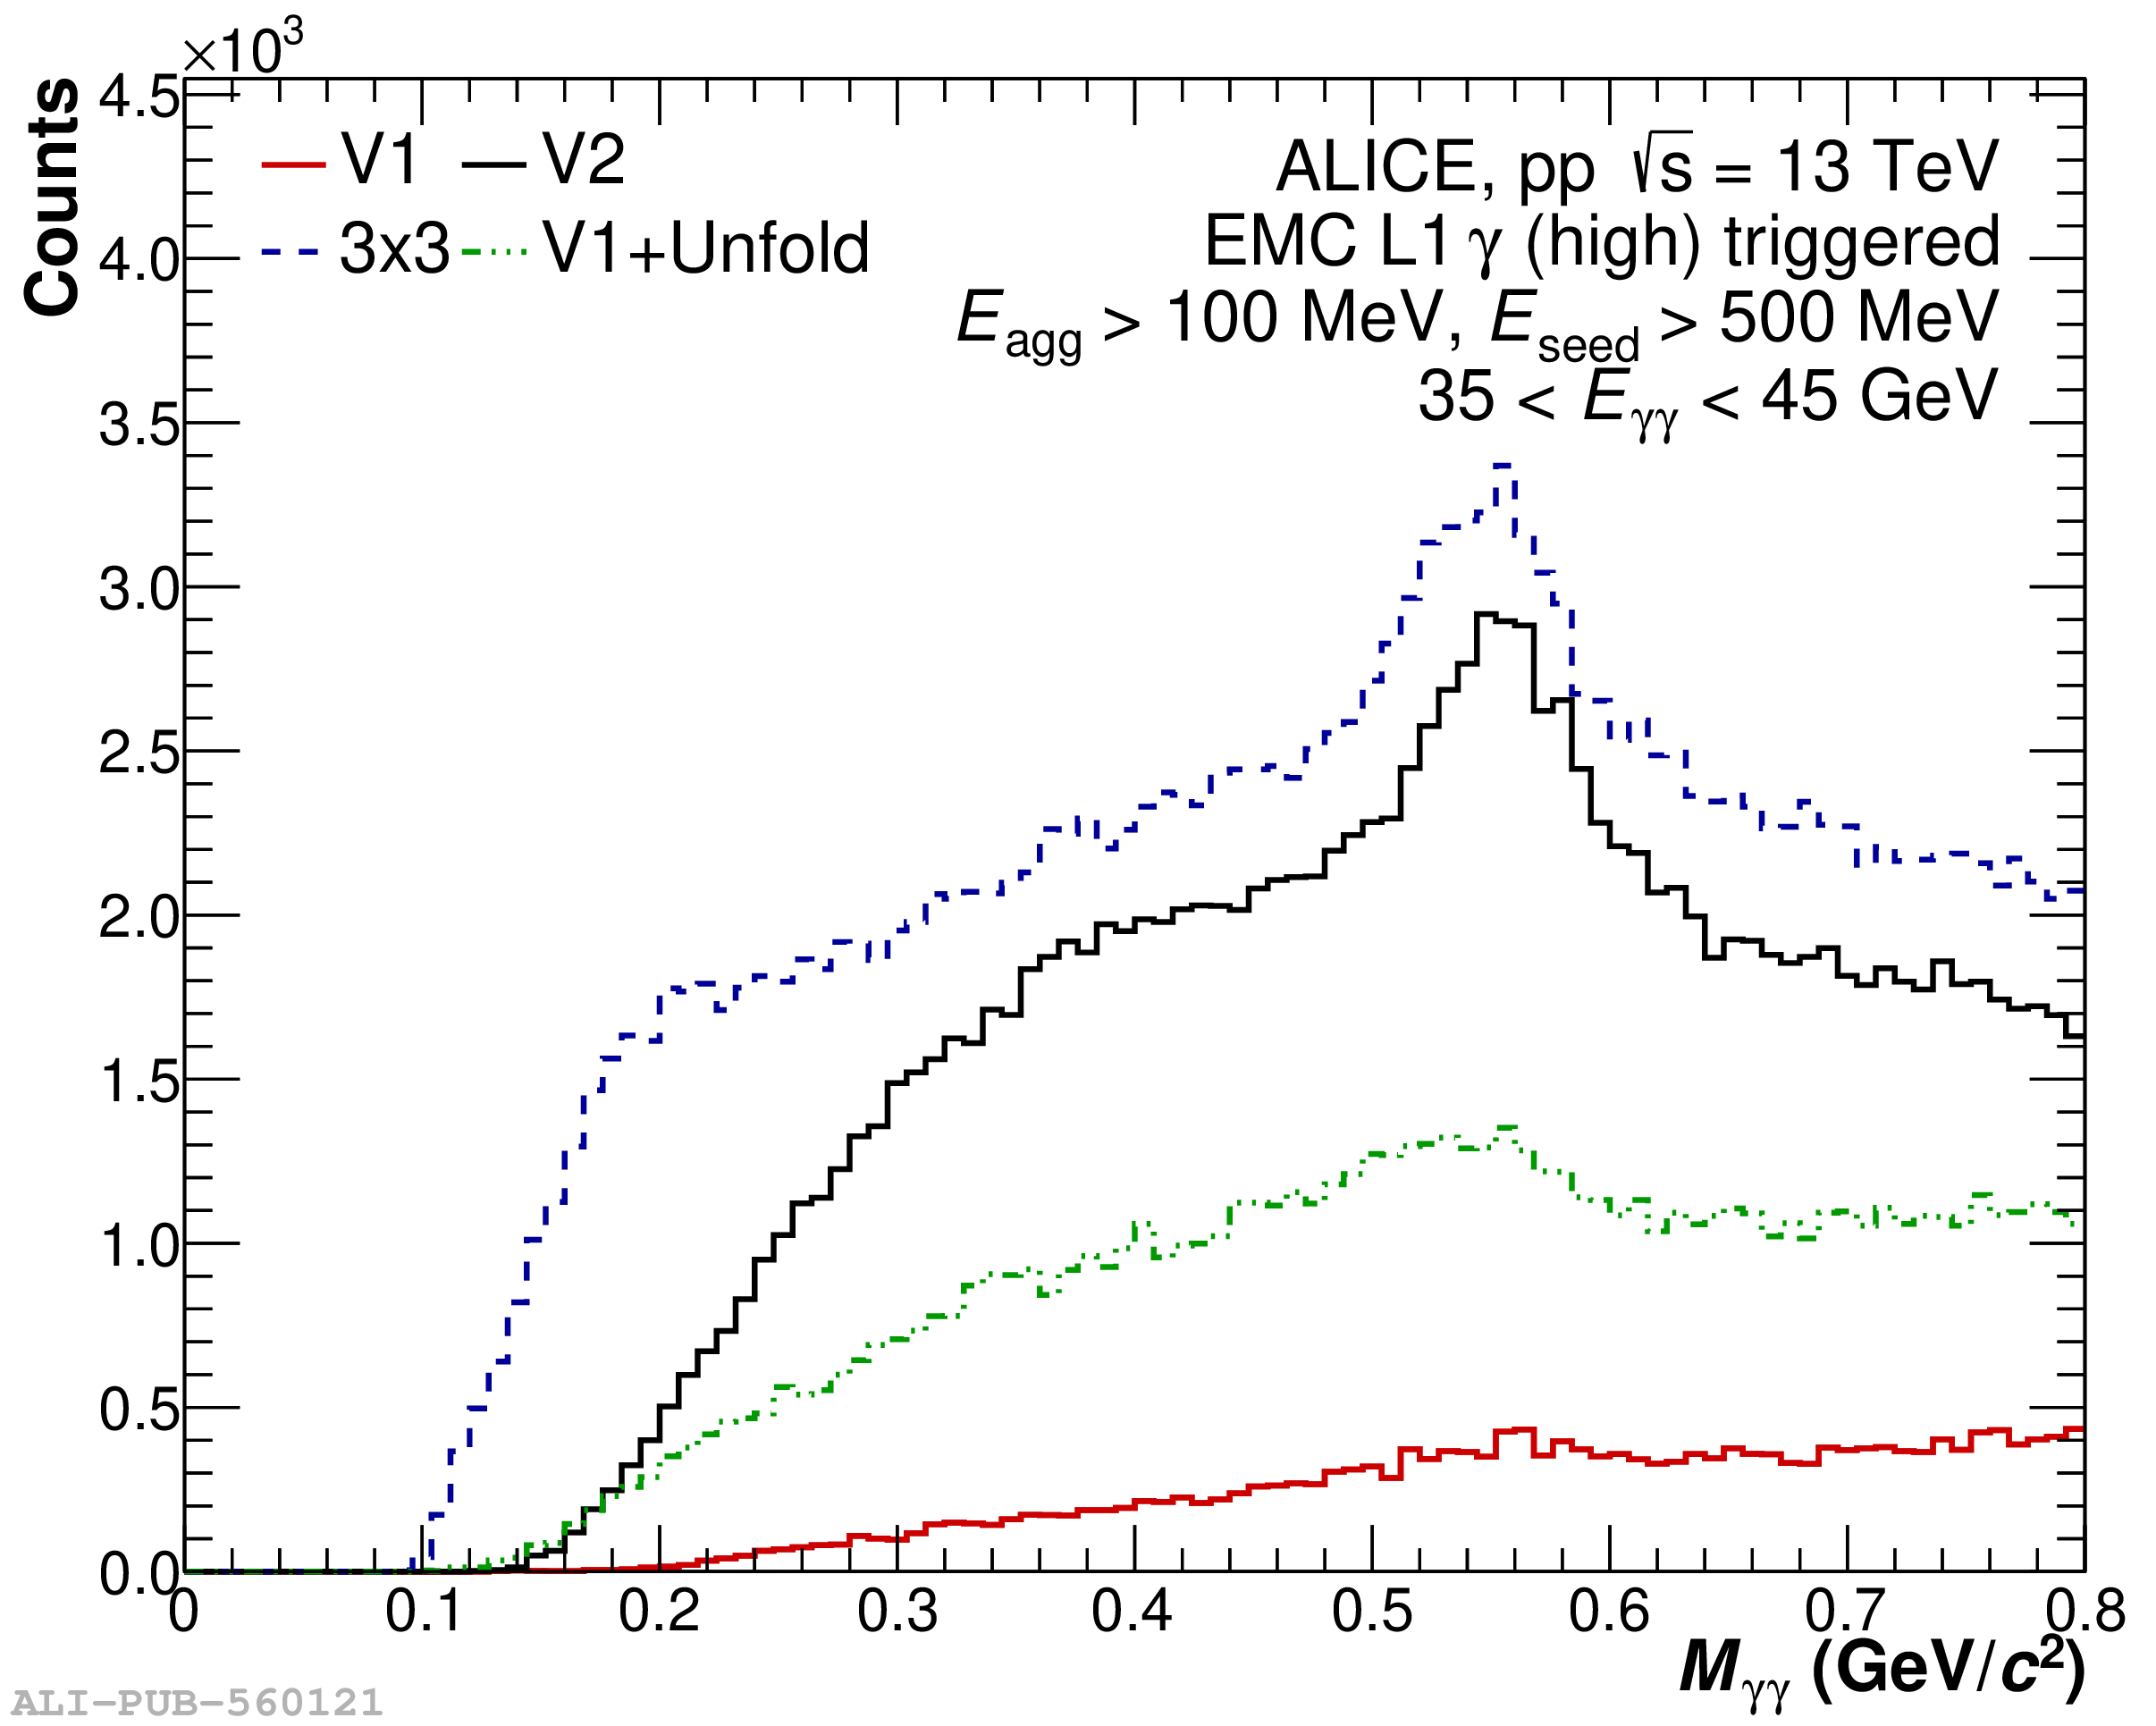 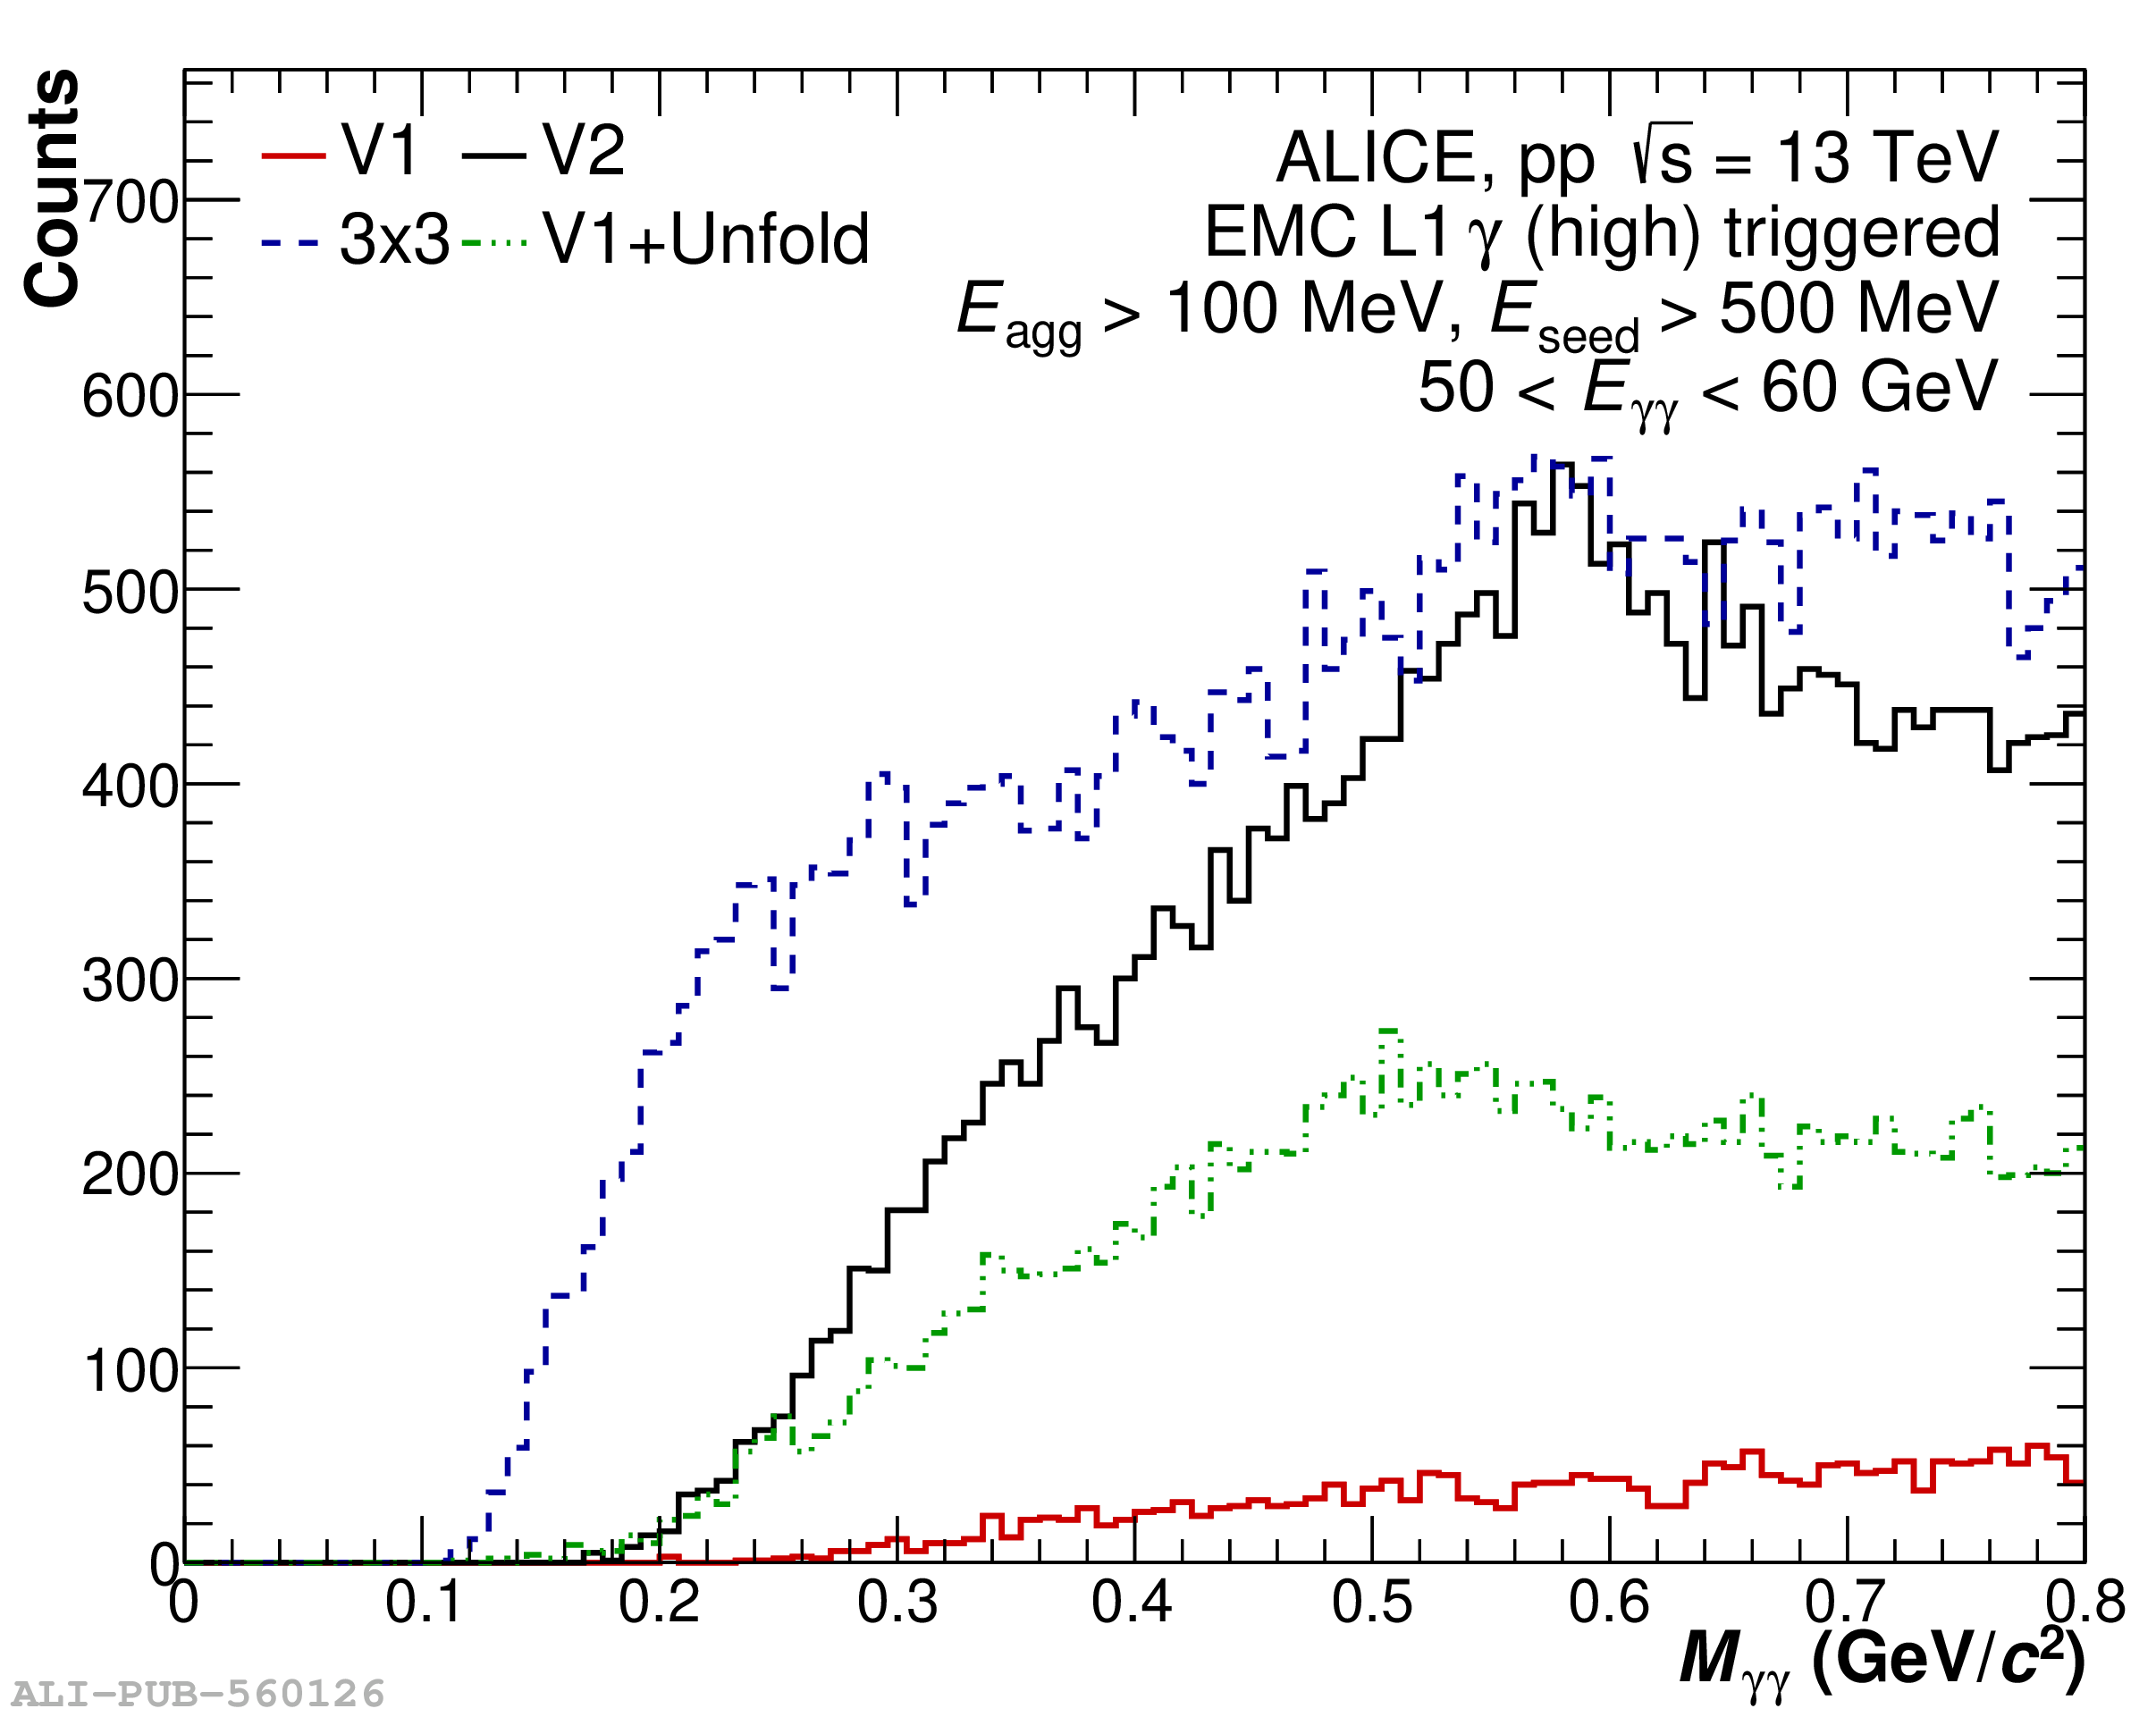 |