Average transverse momentum as a function of $R_{\rm T}$. The $\langle p_{\rm T} \rangle$ in the toward, away, and transverse regions are shown from left to right. The results for pion, kaon, and protons are shown in the first, second, and third row, respectively. Statistical and systematic uncertainties are represented with error bars and boxes, respectively. The shaded bands around the model lines represent the statistical uncertainties. | 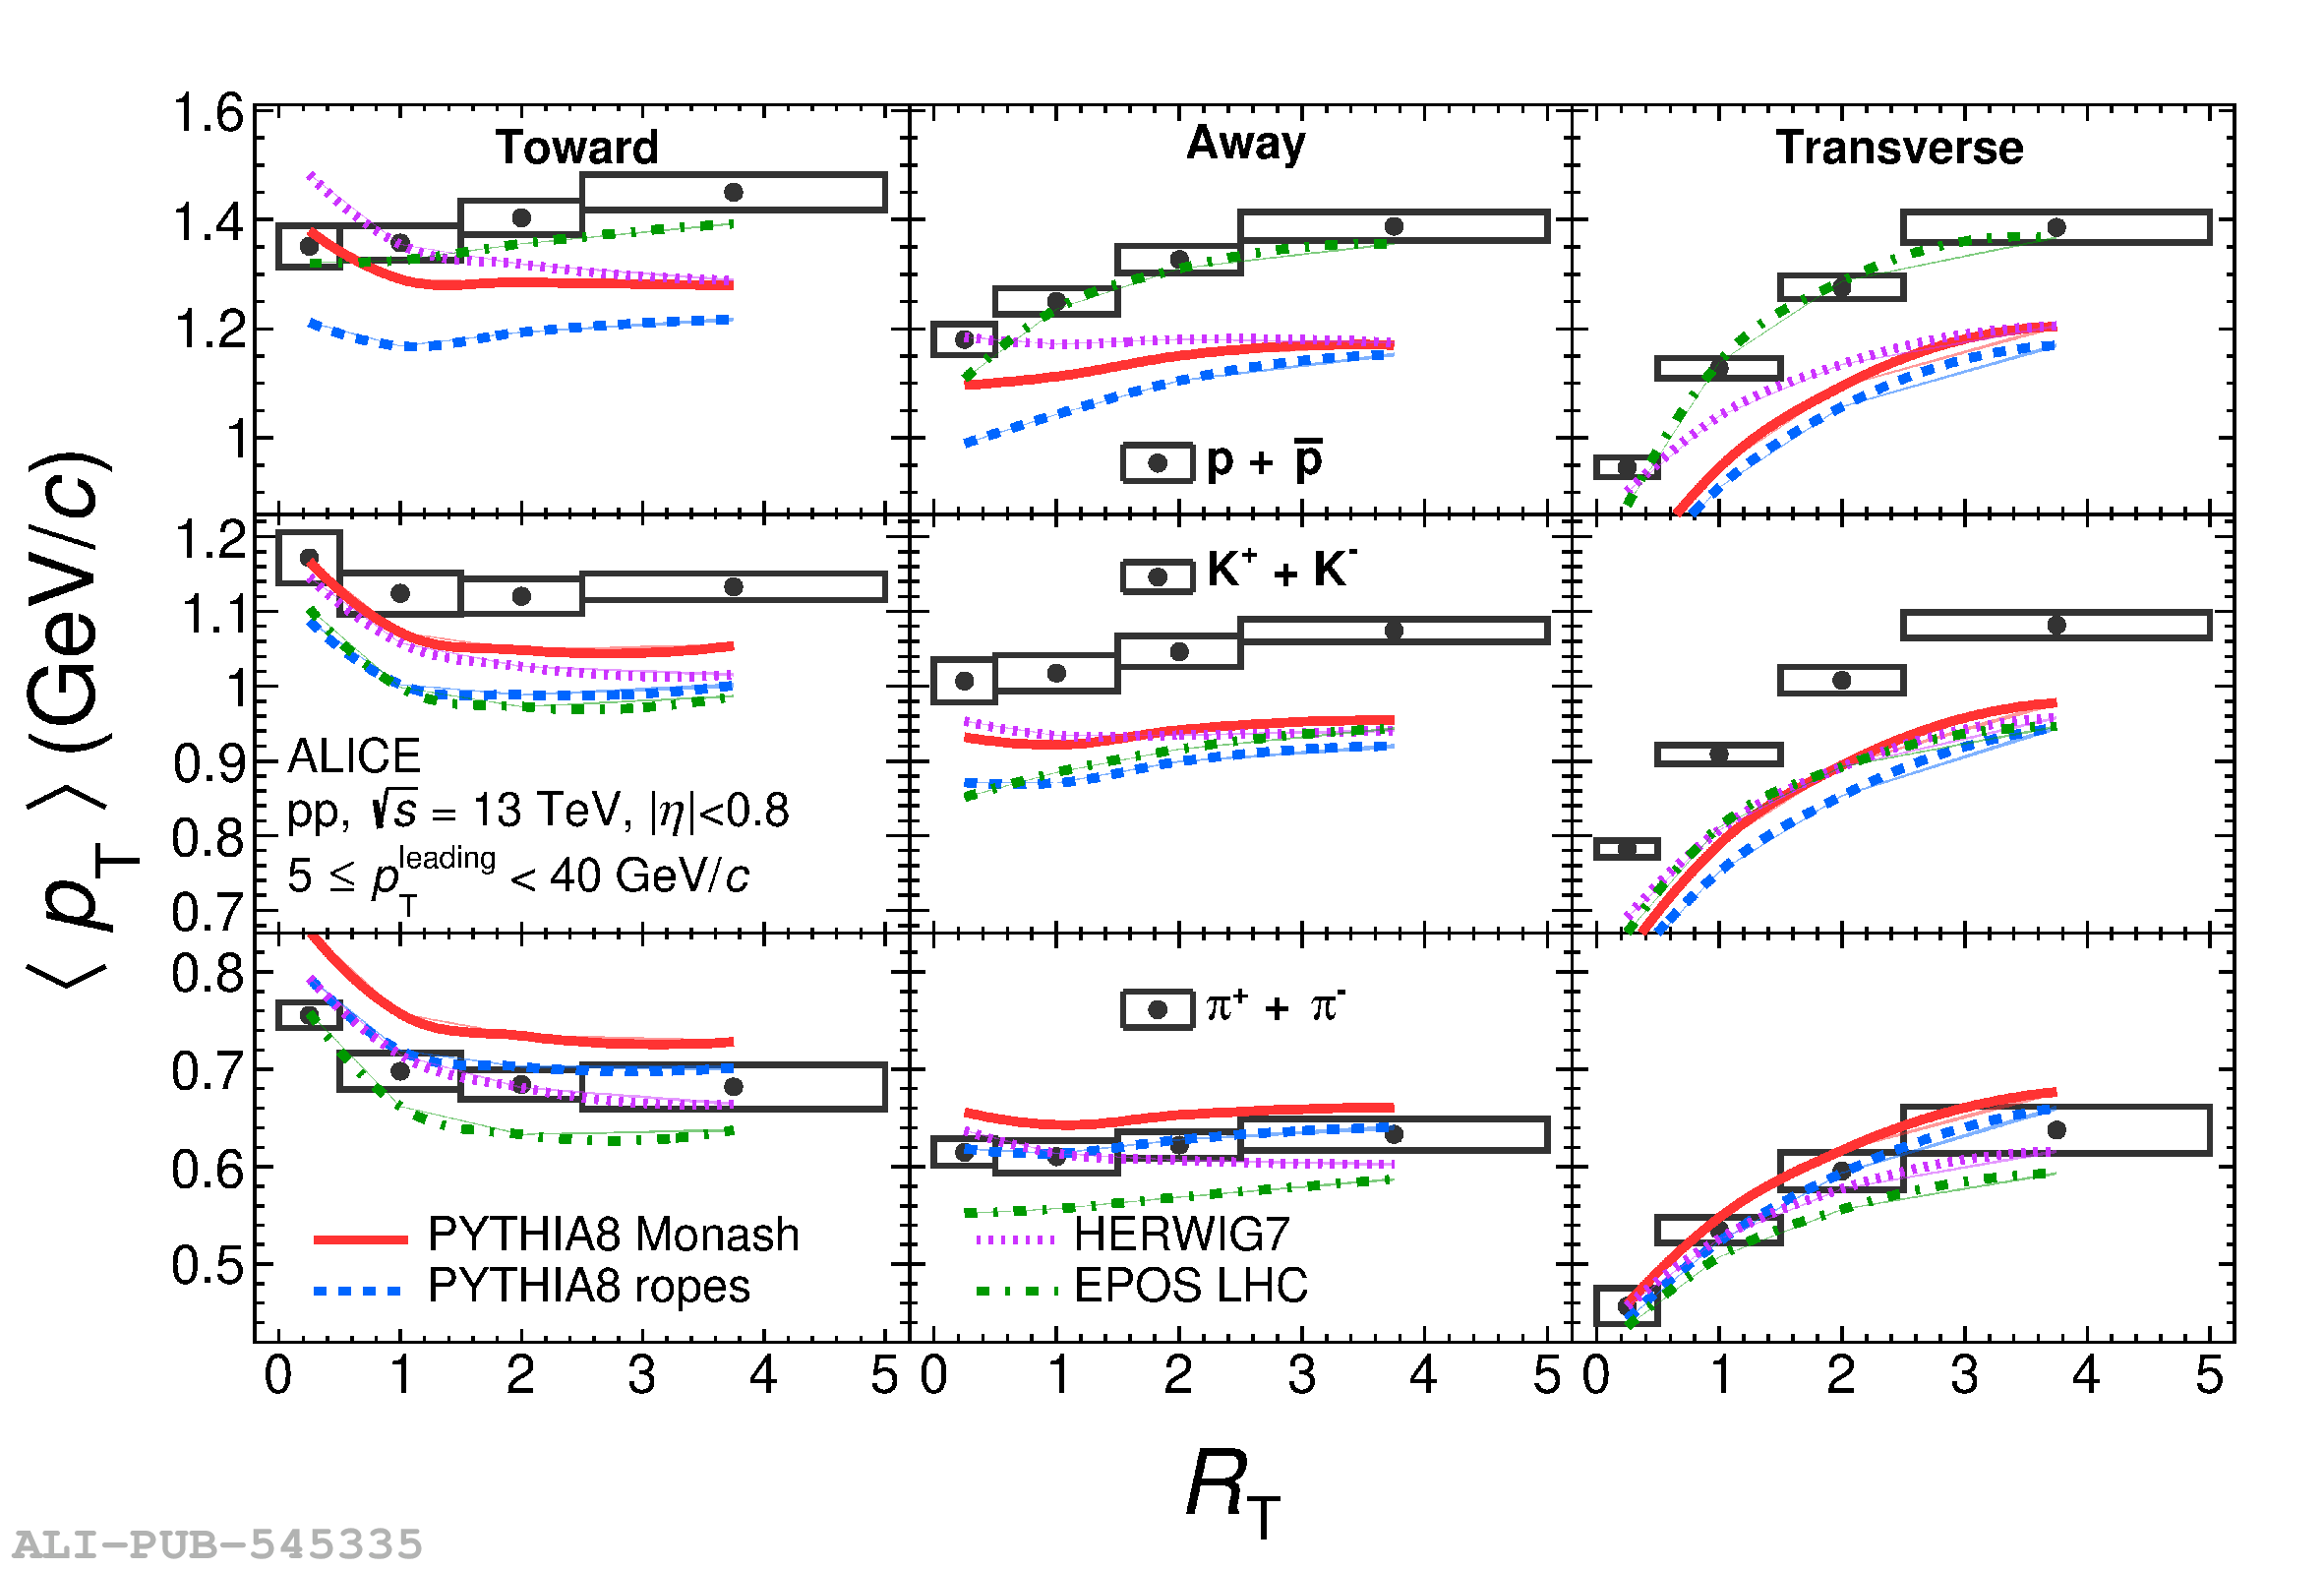 |