$N_{\rm T}$ (left) and $R_{\rm T}$ (right) probability distributions in the transverse region in events with the leading particle. The data are represented with solid black markers and statistical and systematic uncertainties with error bars and boxes, respectively. Model predictions are presented with colour lines and the bands around the model predictions represent only the statistical uncertainty. The bottom panels show the model-to-data ratios. The grey band centred at one in the bottom panel represents the systematic uncertainties of the data. | 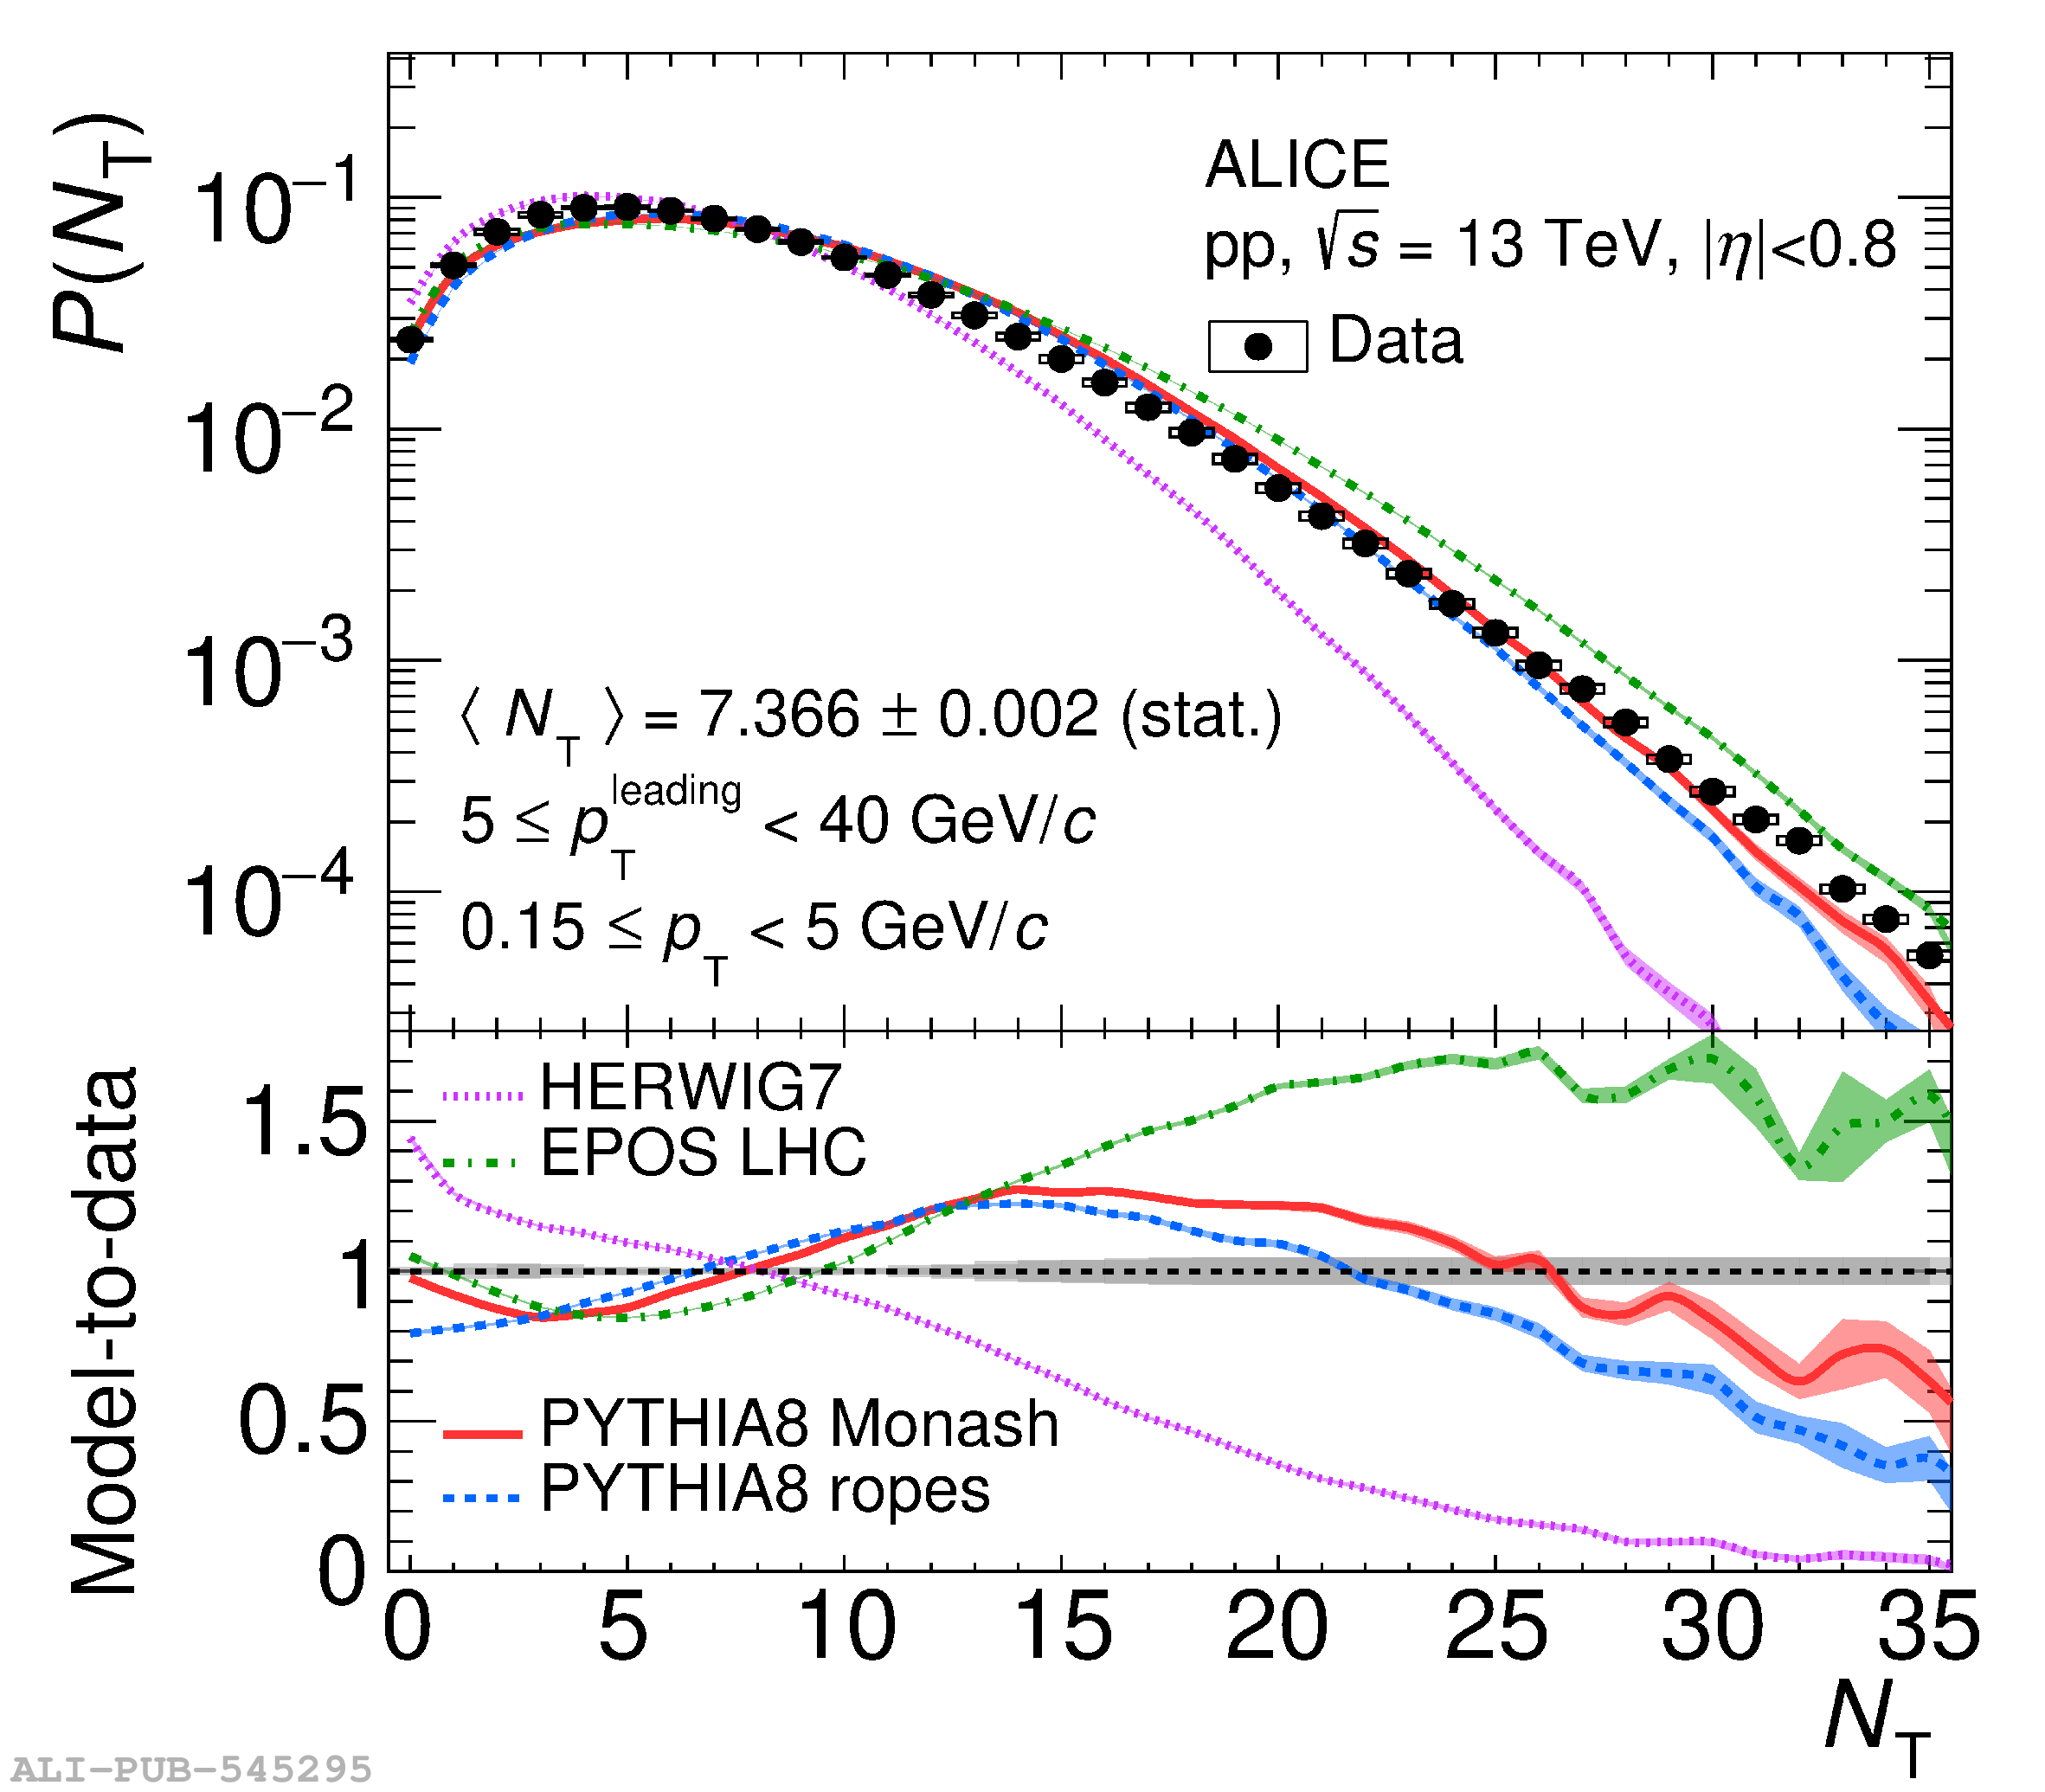 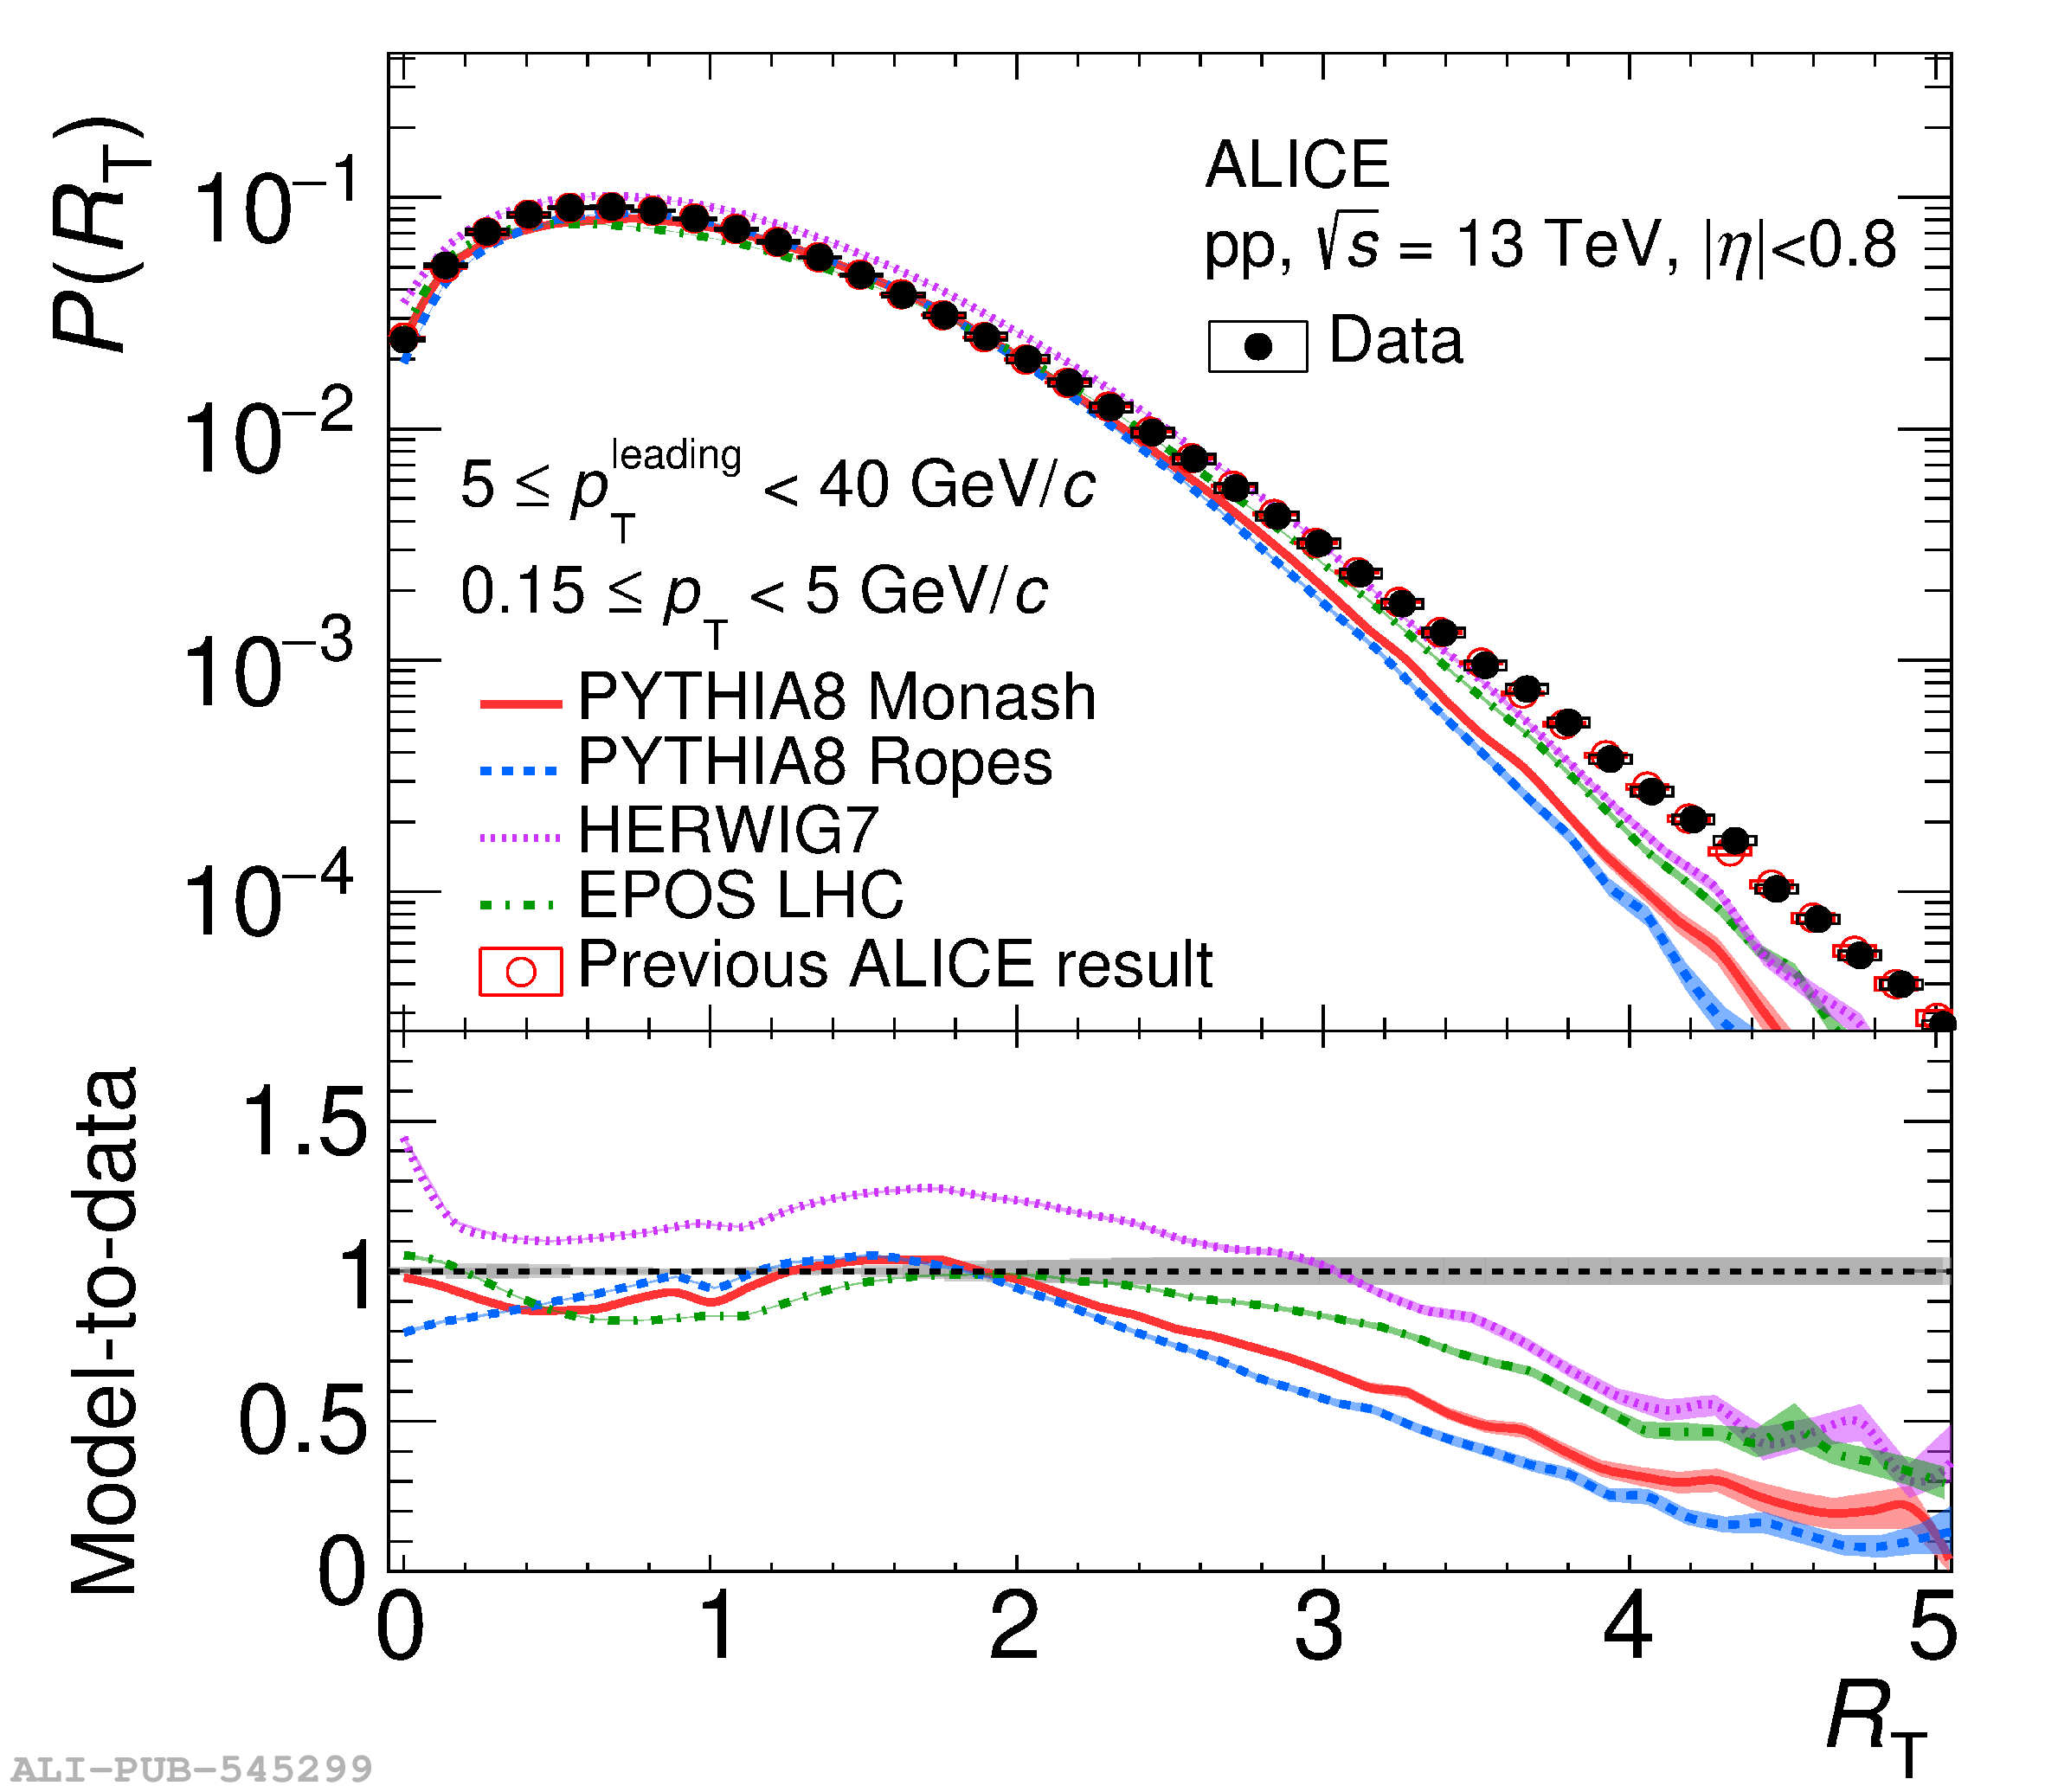 |