Left: ratios of transverse momentum spectra of \antiHH and \antiHee in different centrality intervals. Right: multiplicity dependence of the average \antiHH/\antiHee ratio compared with the coalescence model expectations (two-body coalescence in orange and three-body coalescence in blue) . The open boxes represent the total systematic uncertainties, while the vertical lines are the statistical ones. | 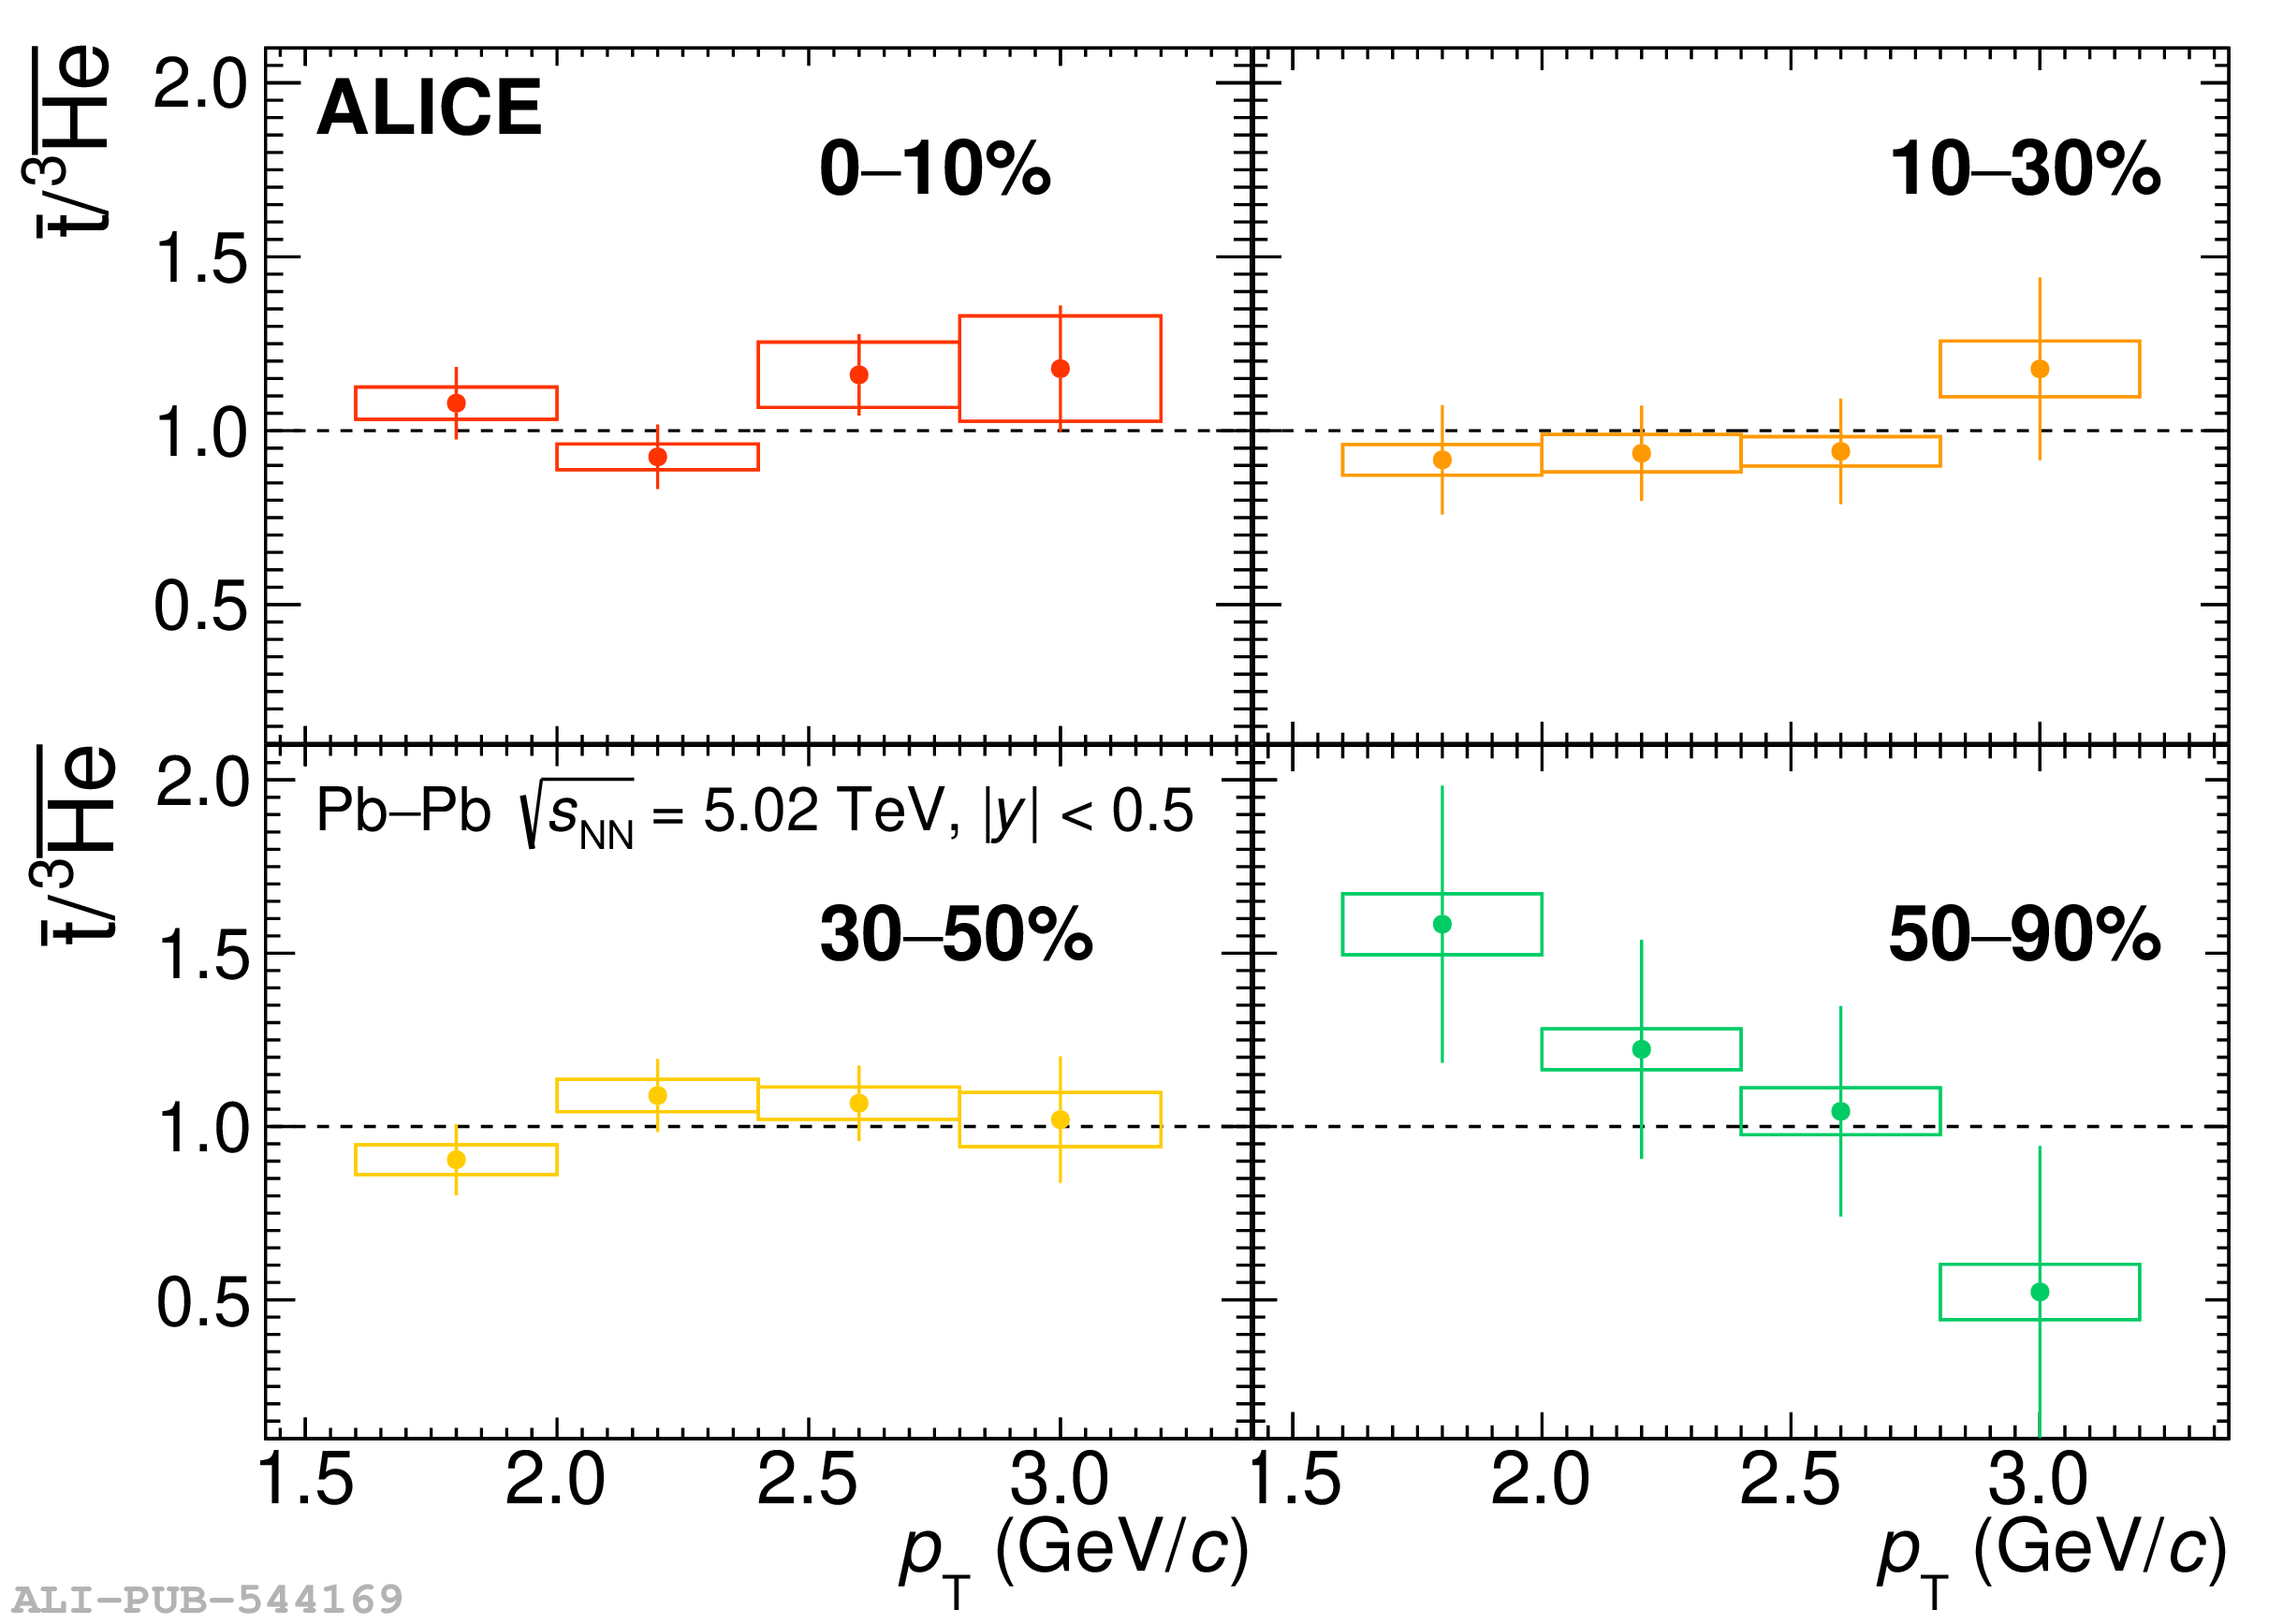 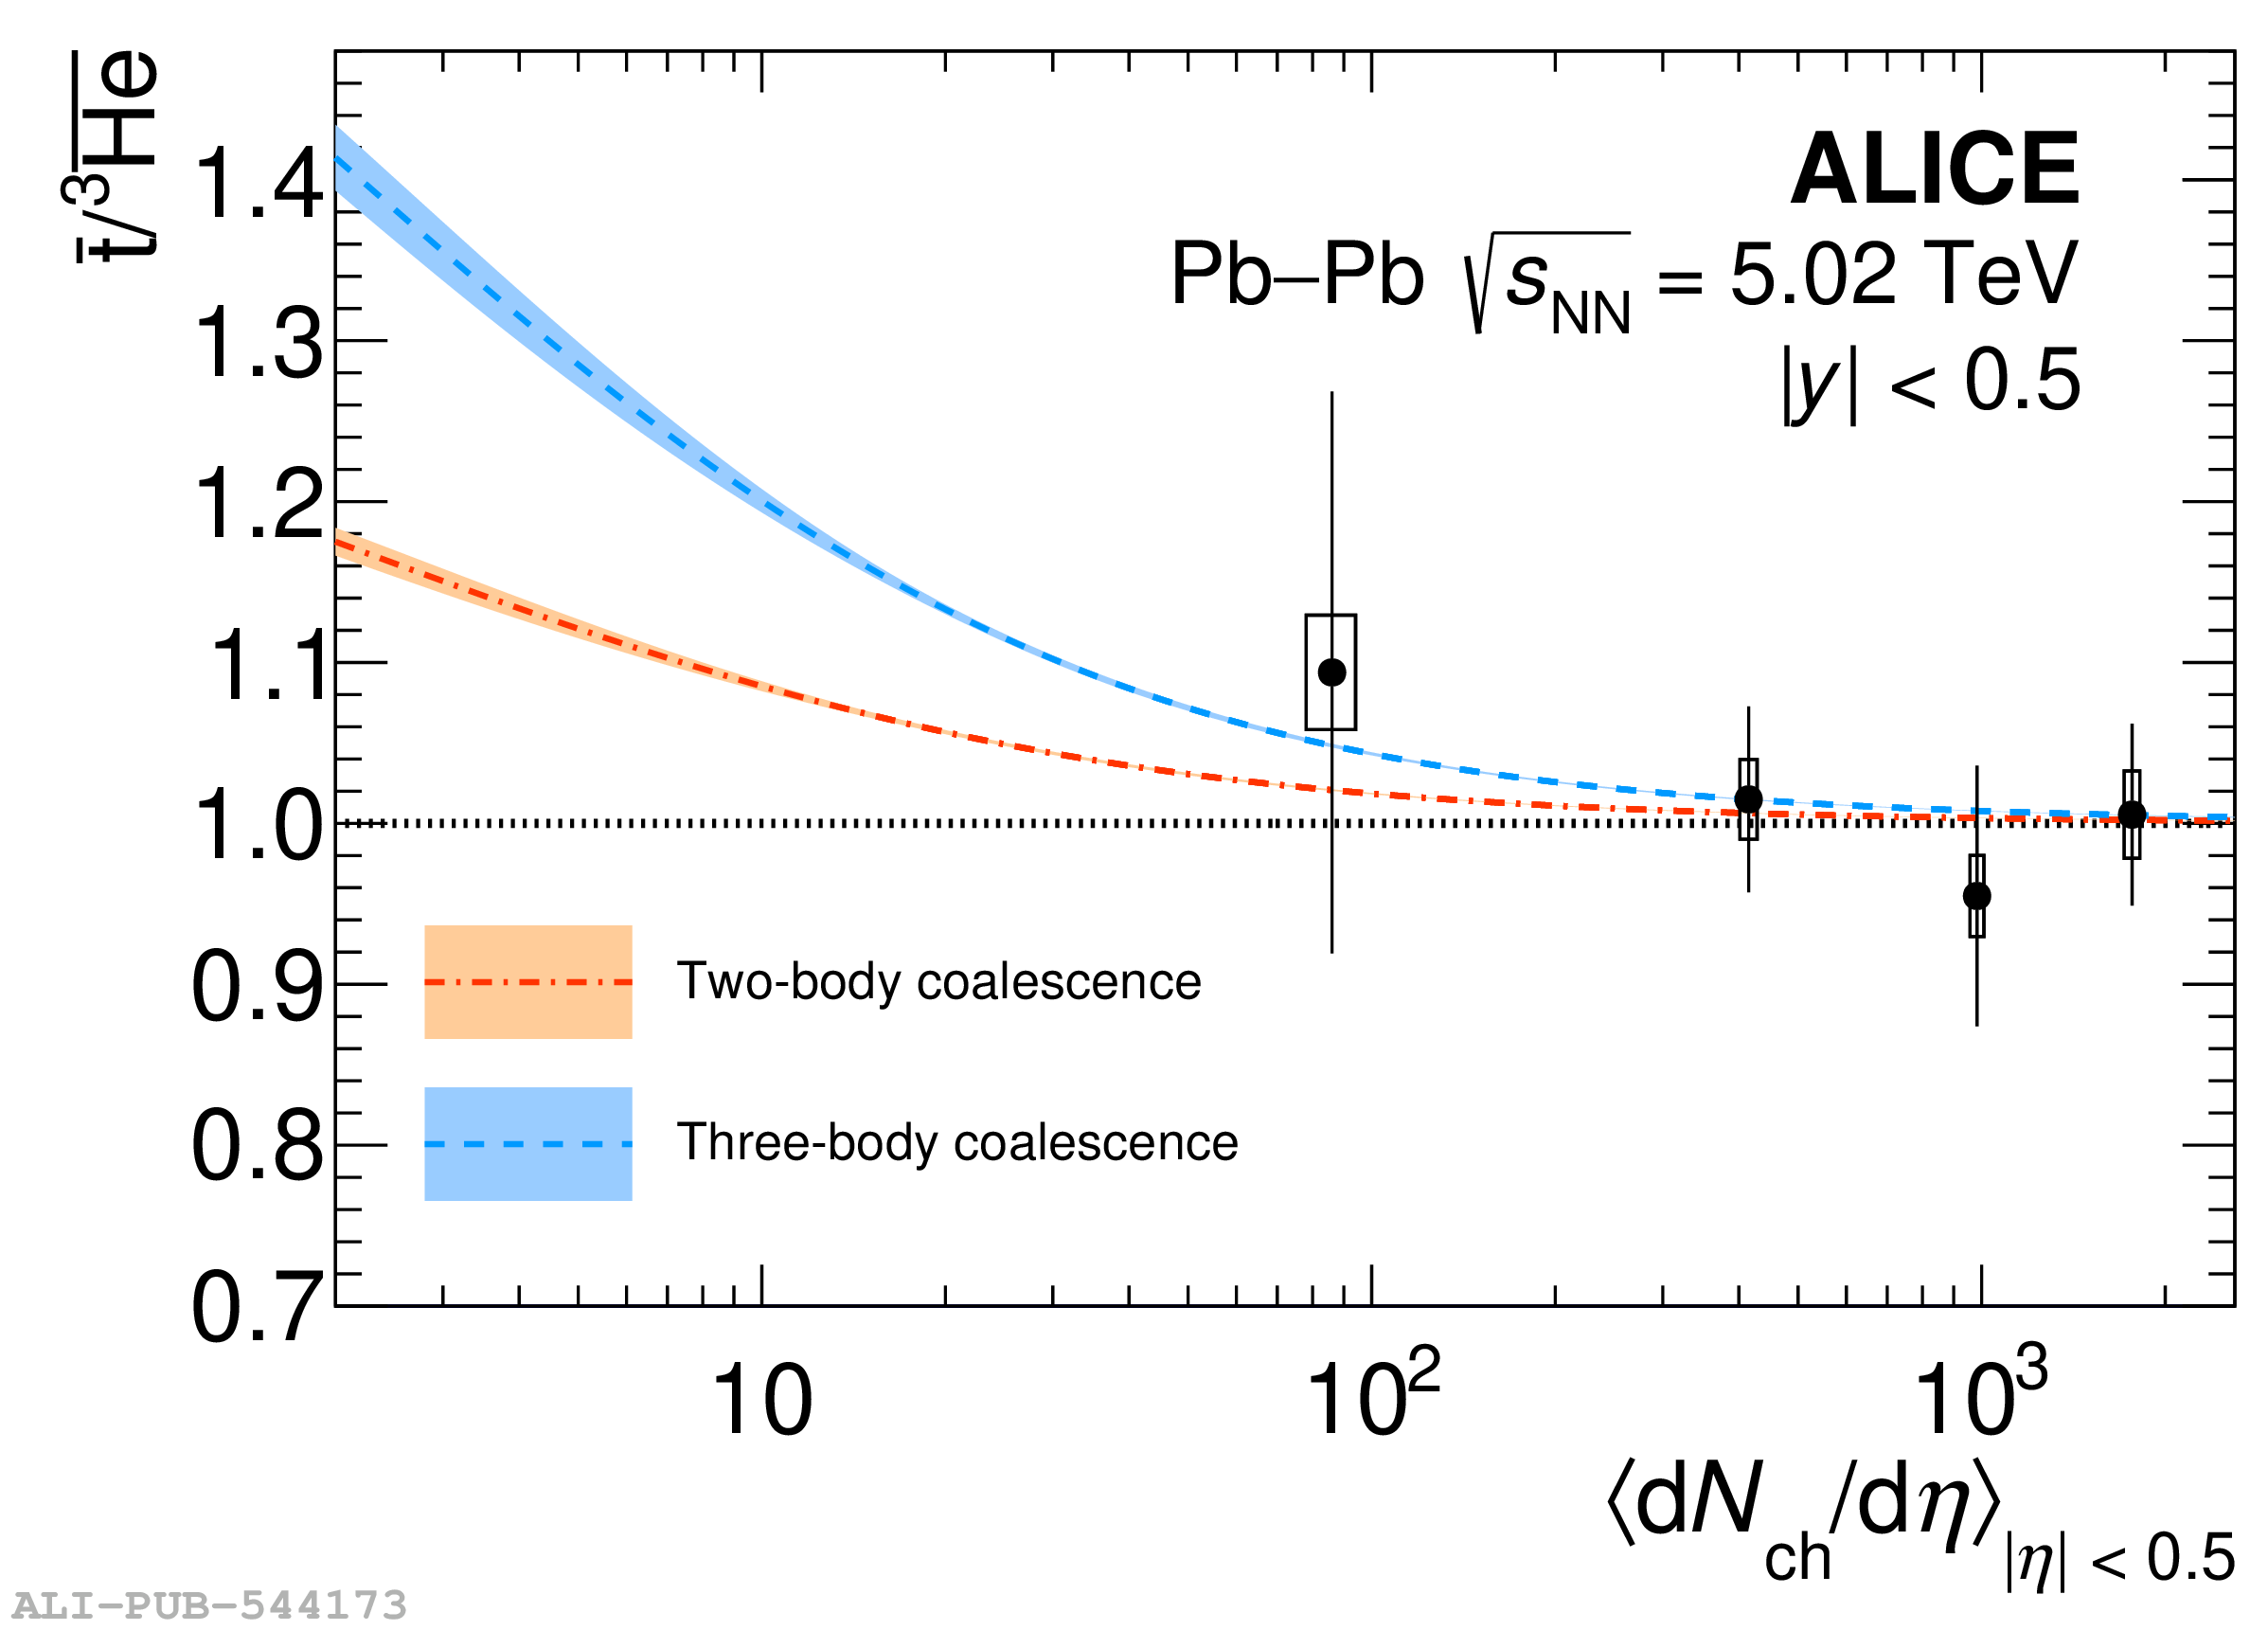 |