(Anti)deuteron, (anti)\Hee and (anti)\HH spectra measured in Pb--Pb collisions at $\mathbf{\sqrt{{\textit s}_{\rm NN}}} = 5.02$ TeV for different centrality classes reported with different colours The boxes represent the systematic uncertainties, while the vertical lines are the statistical ones. The dashed lines represent the individual Blast-Wave fits to the spectra. The Blast-Wave fits of (anti)\Hee are used on (anti)\HH spectra as well to show the trend. | 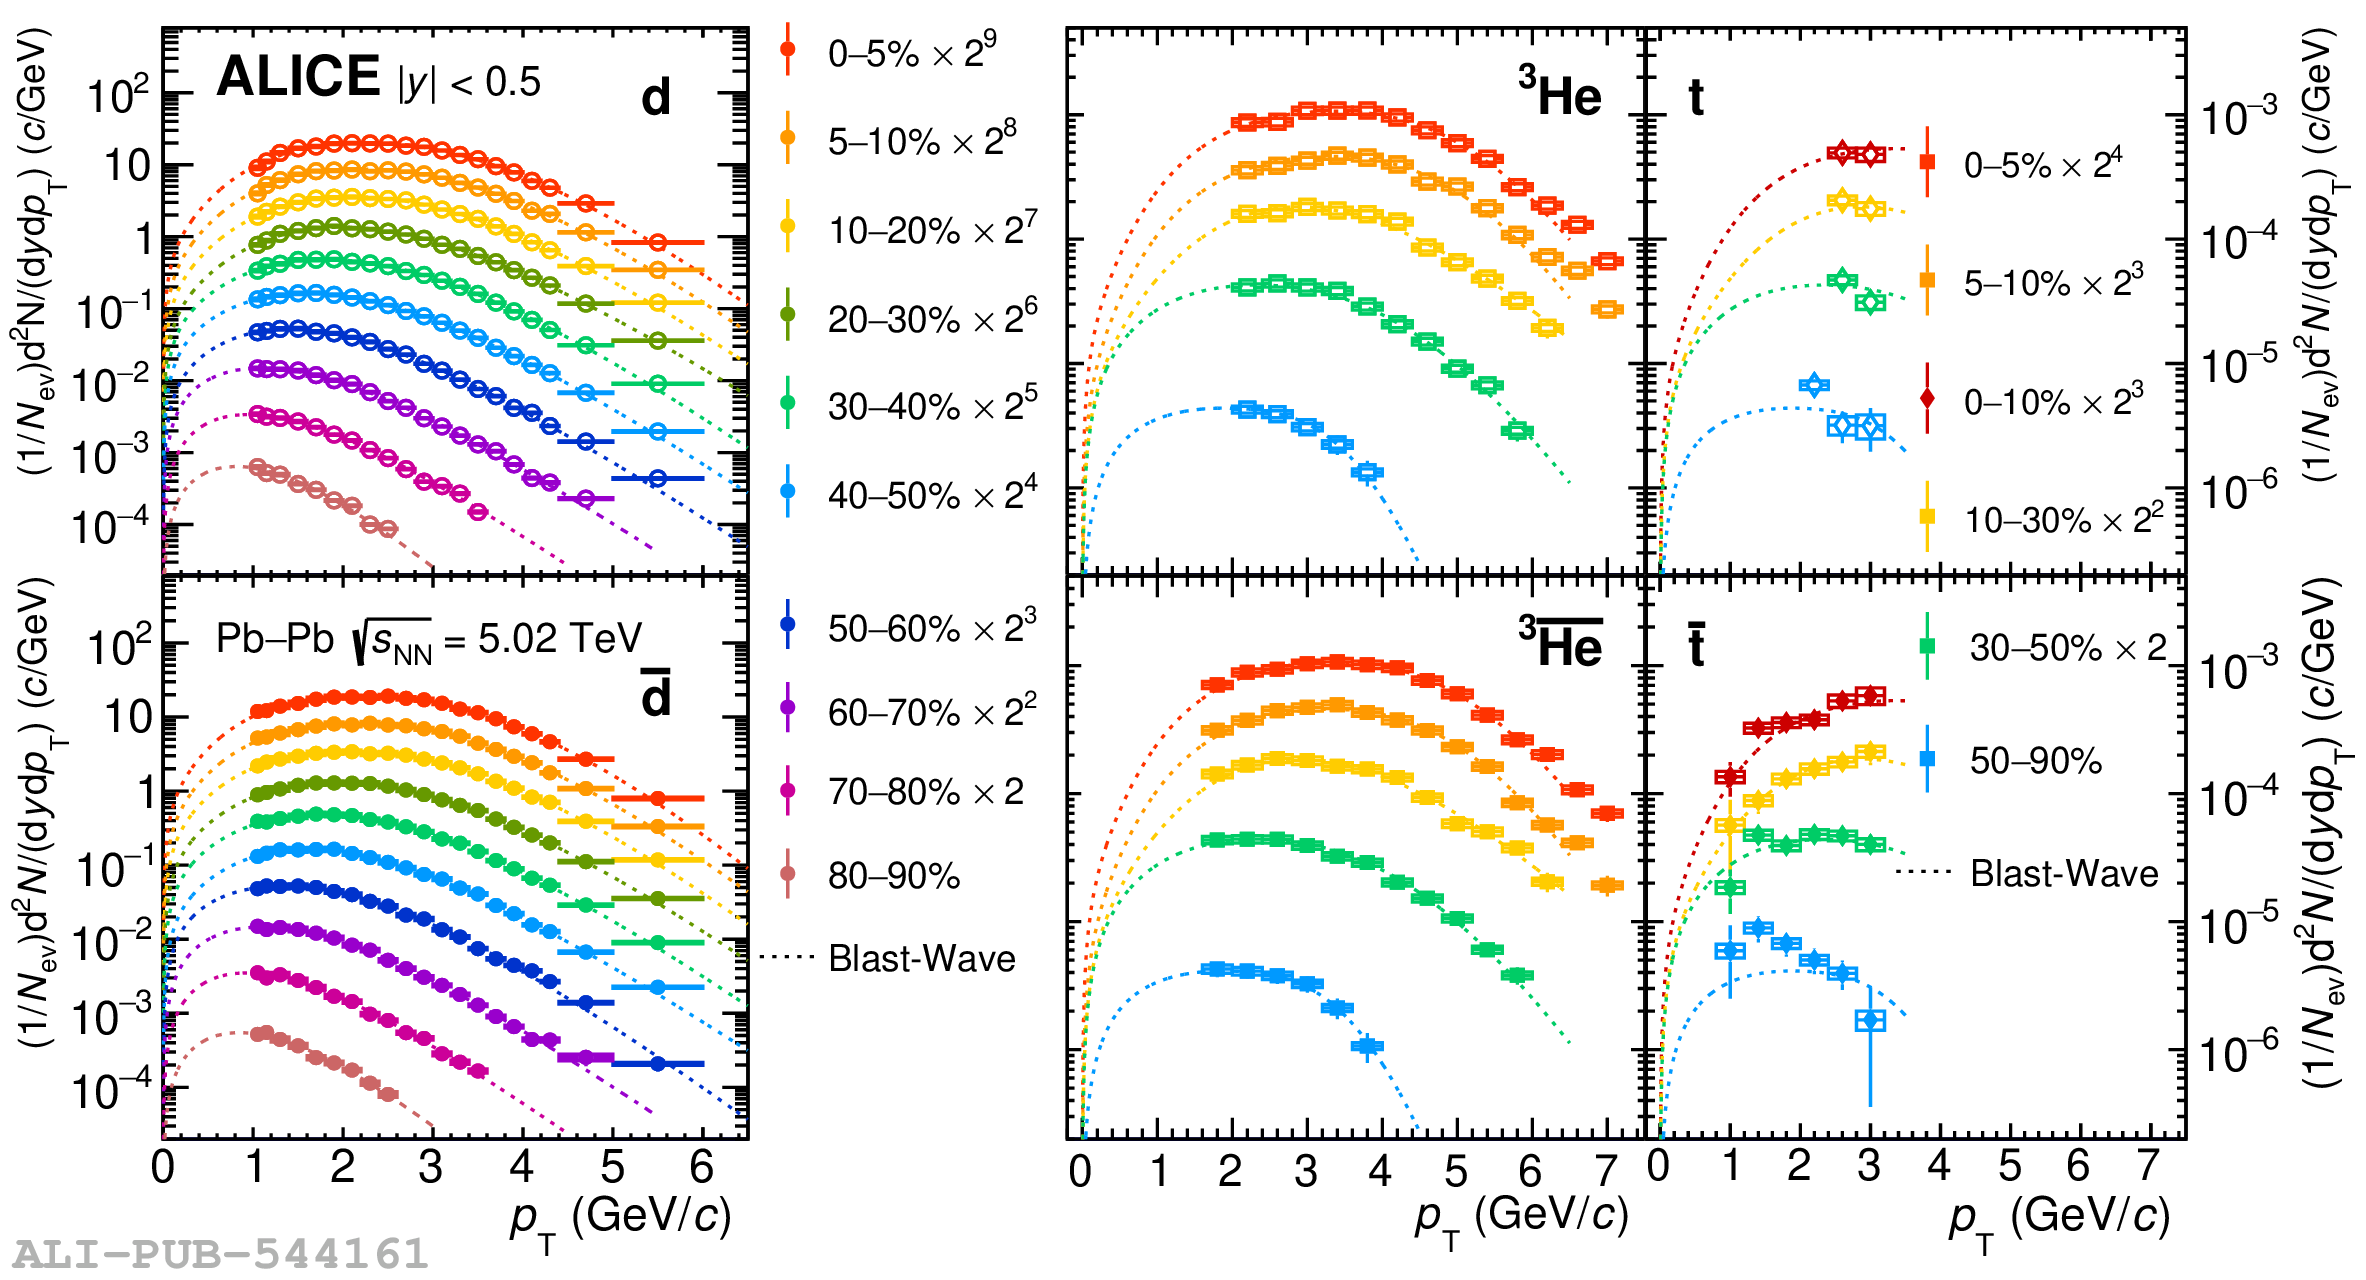 |