Height of $\phi$(1020) meson peak ($C_\phi$) as a function of source radius $R$, for three centrality classes. Statistical uncertainties are shown by bars. Systematic uncertainties are smaller than the size of the markers. Blue solid line corresponds to the fit of CF with$C_\phi^{\rm direct} = {\rm const}/R^3$. Red dashed line corresponds to the fit with the second line in Eq. (13). | 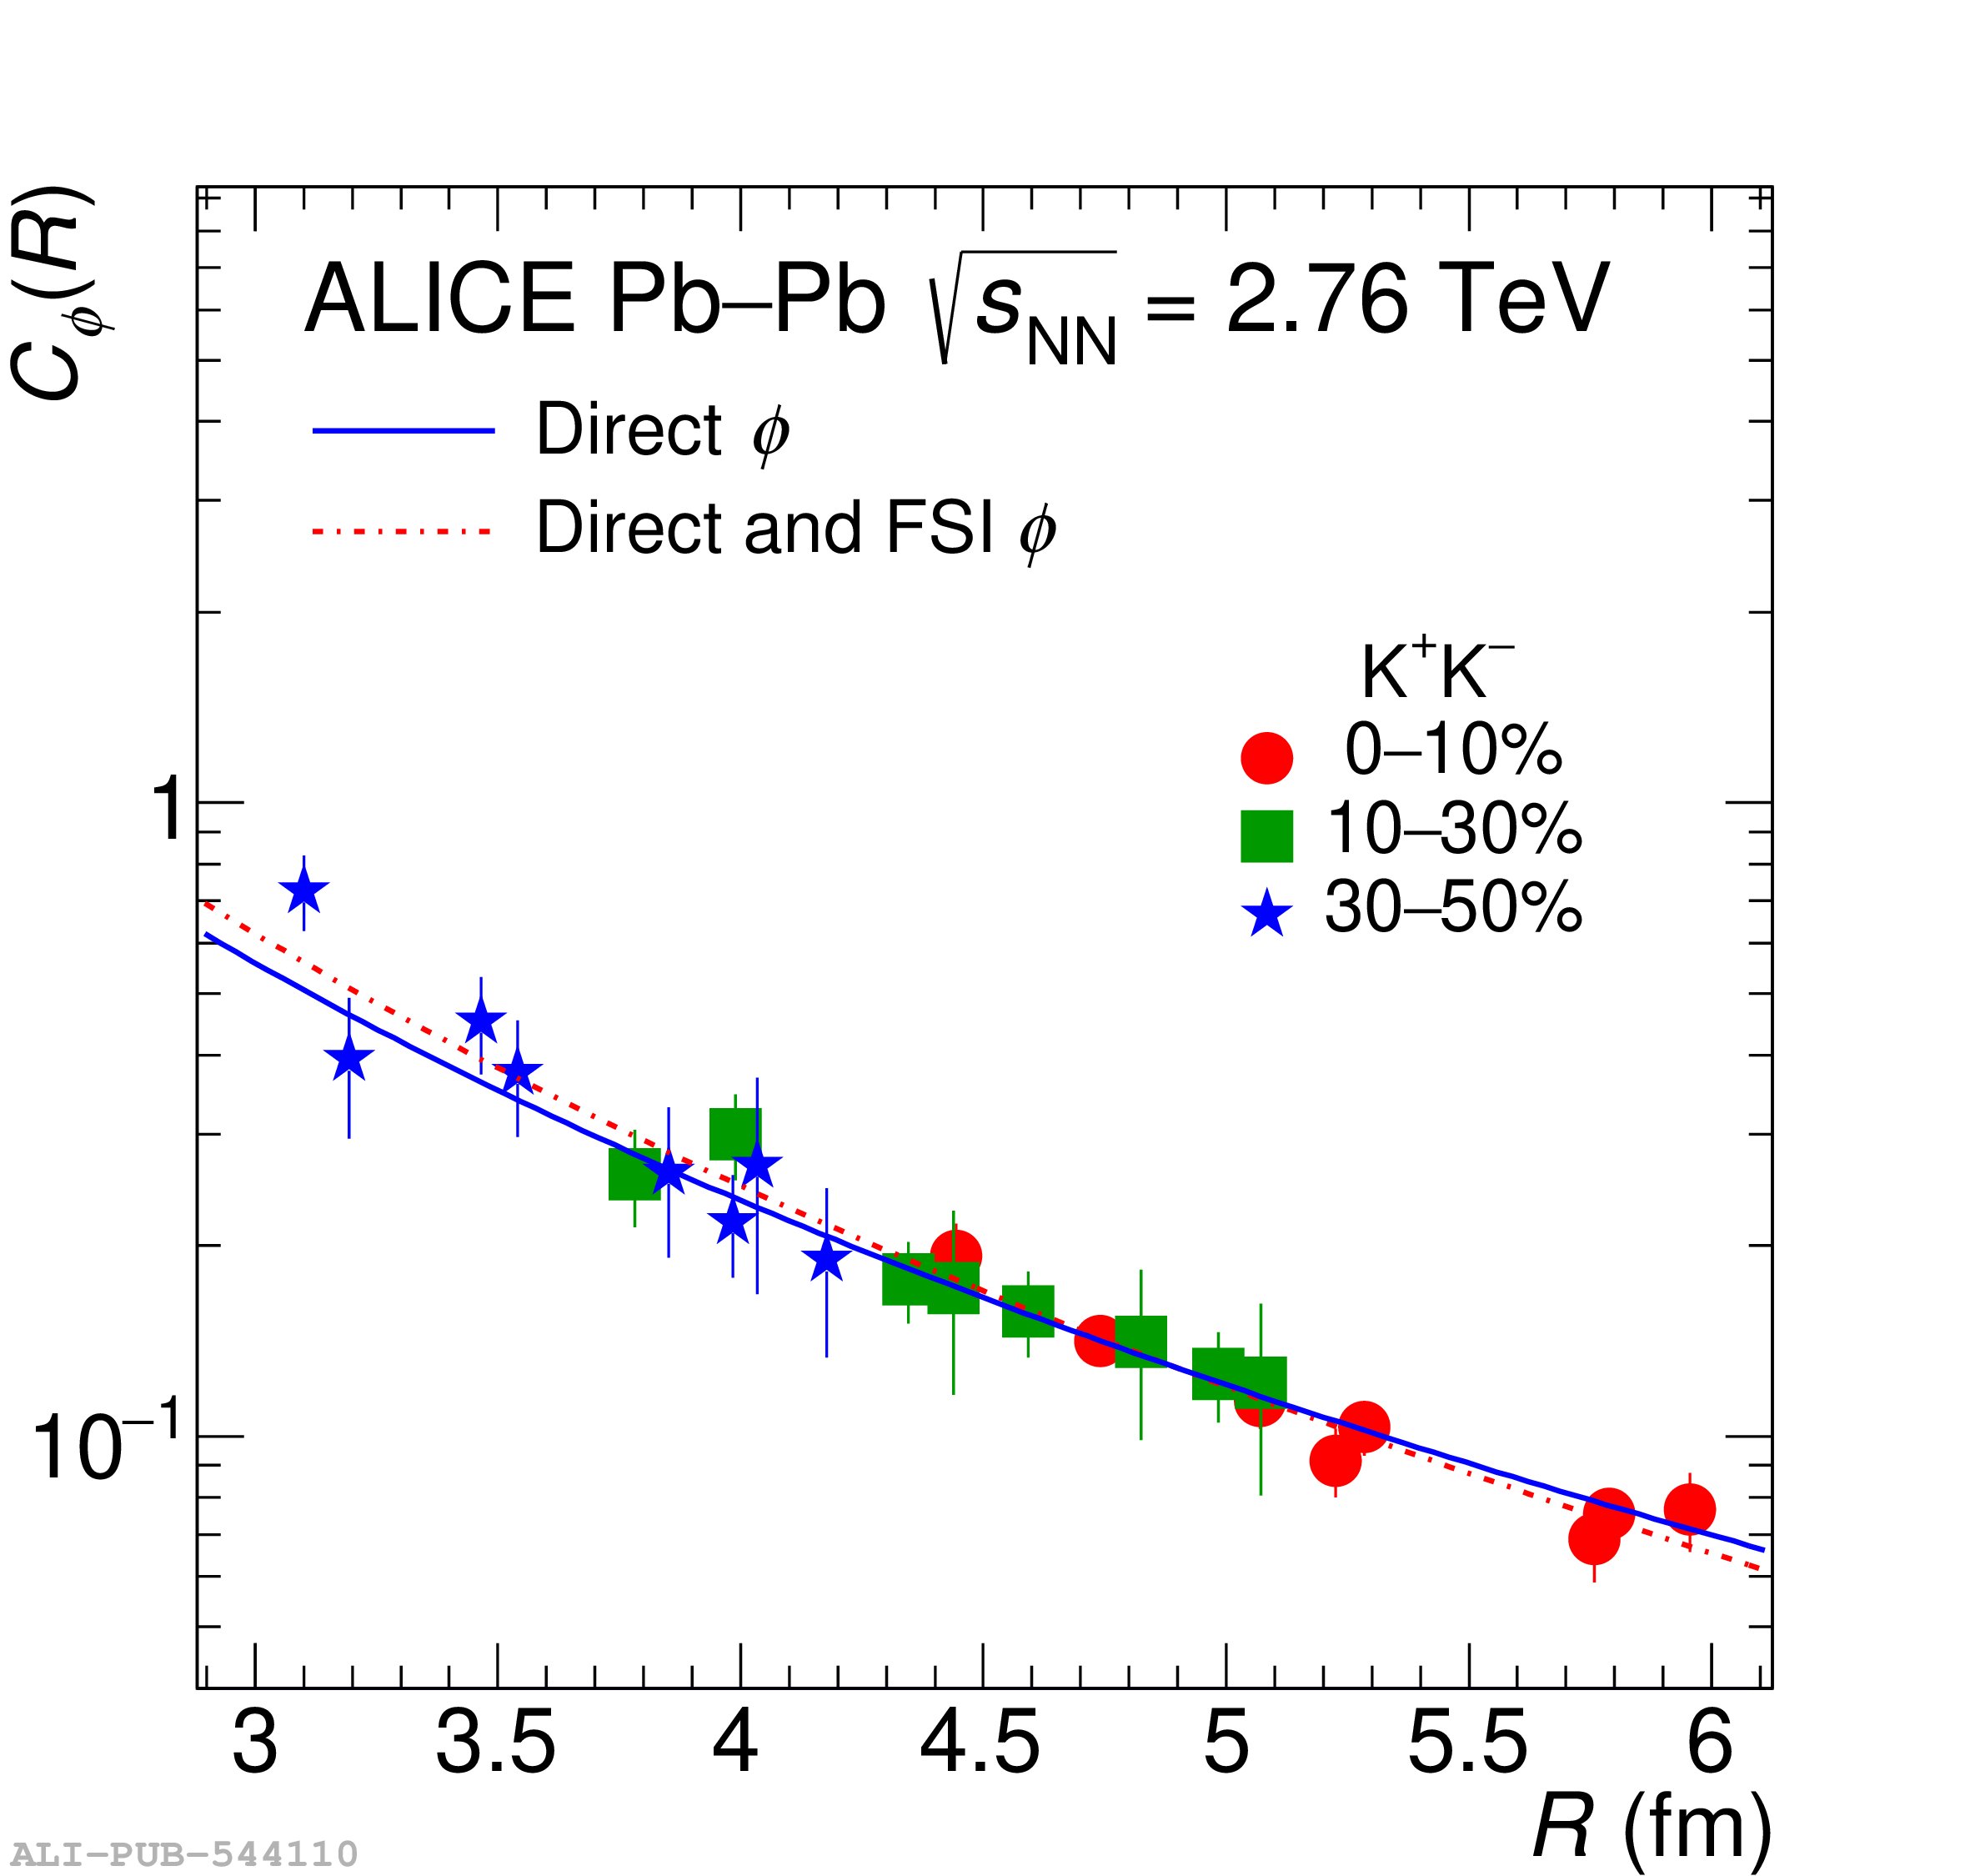 |