The measurements of the inclusive J/$\psi$ yield at midrapidity ($\left | y \right | <~ 0.9$) and forward rapidity (2.5 $<~ y <~$ 4) in Pb$-$Pb collisions at $\sqrt{s_{\mathrm{NN}}}=5.02$ TeV with the ALICE detector at the LHC are reported. The inclusive J/$\psi$ production yields and nuclear modification factors, $R_{\rm AA}$, are measured as a function of the collision centrality, J/$\psi$ transverse momentum ($p_{\rm T}$), and rapidity. The J/$\psi$ average transverse momentum and squared transverse momentum ($\langle p_{\mathrm{T}}\rangle$ and $\langle p_{\mathrm{T}}^{\mathrm{2}}\rangle$) are evaluated as a function of the centrality at midrapidity. Compared to the previous ALICE publications, here the entire Pb$-$Pb collisions dataset collected during the LHC Run 2 is used, which improves the precision of the measurements and extends the $p_{\rm T}$ coverage. The $p_{\rm T}$-integrated $R_{\rm AA}$ shows a hint of an increasing trend towards unity from semicentral to central collisions at midrapidity, while it is flat at forward rapidity. The $p_{\rm T}$-differential $R_{\rm AA}$ shows a strong suppression at high $p_{\rm T}$ with less suppression at low $p_{\rm T}$ where it reaches a larger value at midrapidity compared to forward rapidity. The ratio of the $p_{\rm T}$-integrated yields of J/$\psi$ to those of D$^{0}$ mesons is reported for the first time for the central and semicentral event classes at midrapidity. Model calculations implementing charmonium production via the coalescence of charm quarks and antiquarks during the fireball evolution (transport models) or in a statistical approach with thermal weights are in good agreement with the data at low $p_{\rm T}$. At higher $p_{\rm T}$, the data are well described by transport models and a model based on energy loss in the strongly-interacting medium produced in nuclear collisions at the LHC.
Phys. Lett. B 849 (2024) 138451
HEP Data
e-Print: arXiv:2303.13361 | PDF | inSPIRE
CERN-EP-2023-054
Figure group
Figure 1
Upper panels: invariant-mass distribution of opposite-sign lepton pairs from the same event (black points) and mixed events (red histograms) at midrapidity (left) and forward rapidity (right) in Pb-Pb collisions at $\snn=5.02$ TeV. Lower panels: invariant-mass distribution after the background subtraction with the event-mixing technique. The fit curves, shown in red, represent the sum of the signal and background shapes and the blue curves correspond to the residual background. |  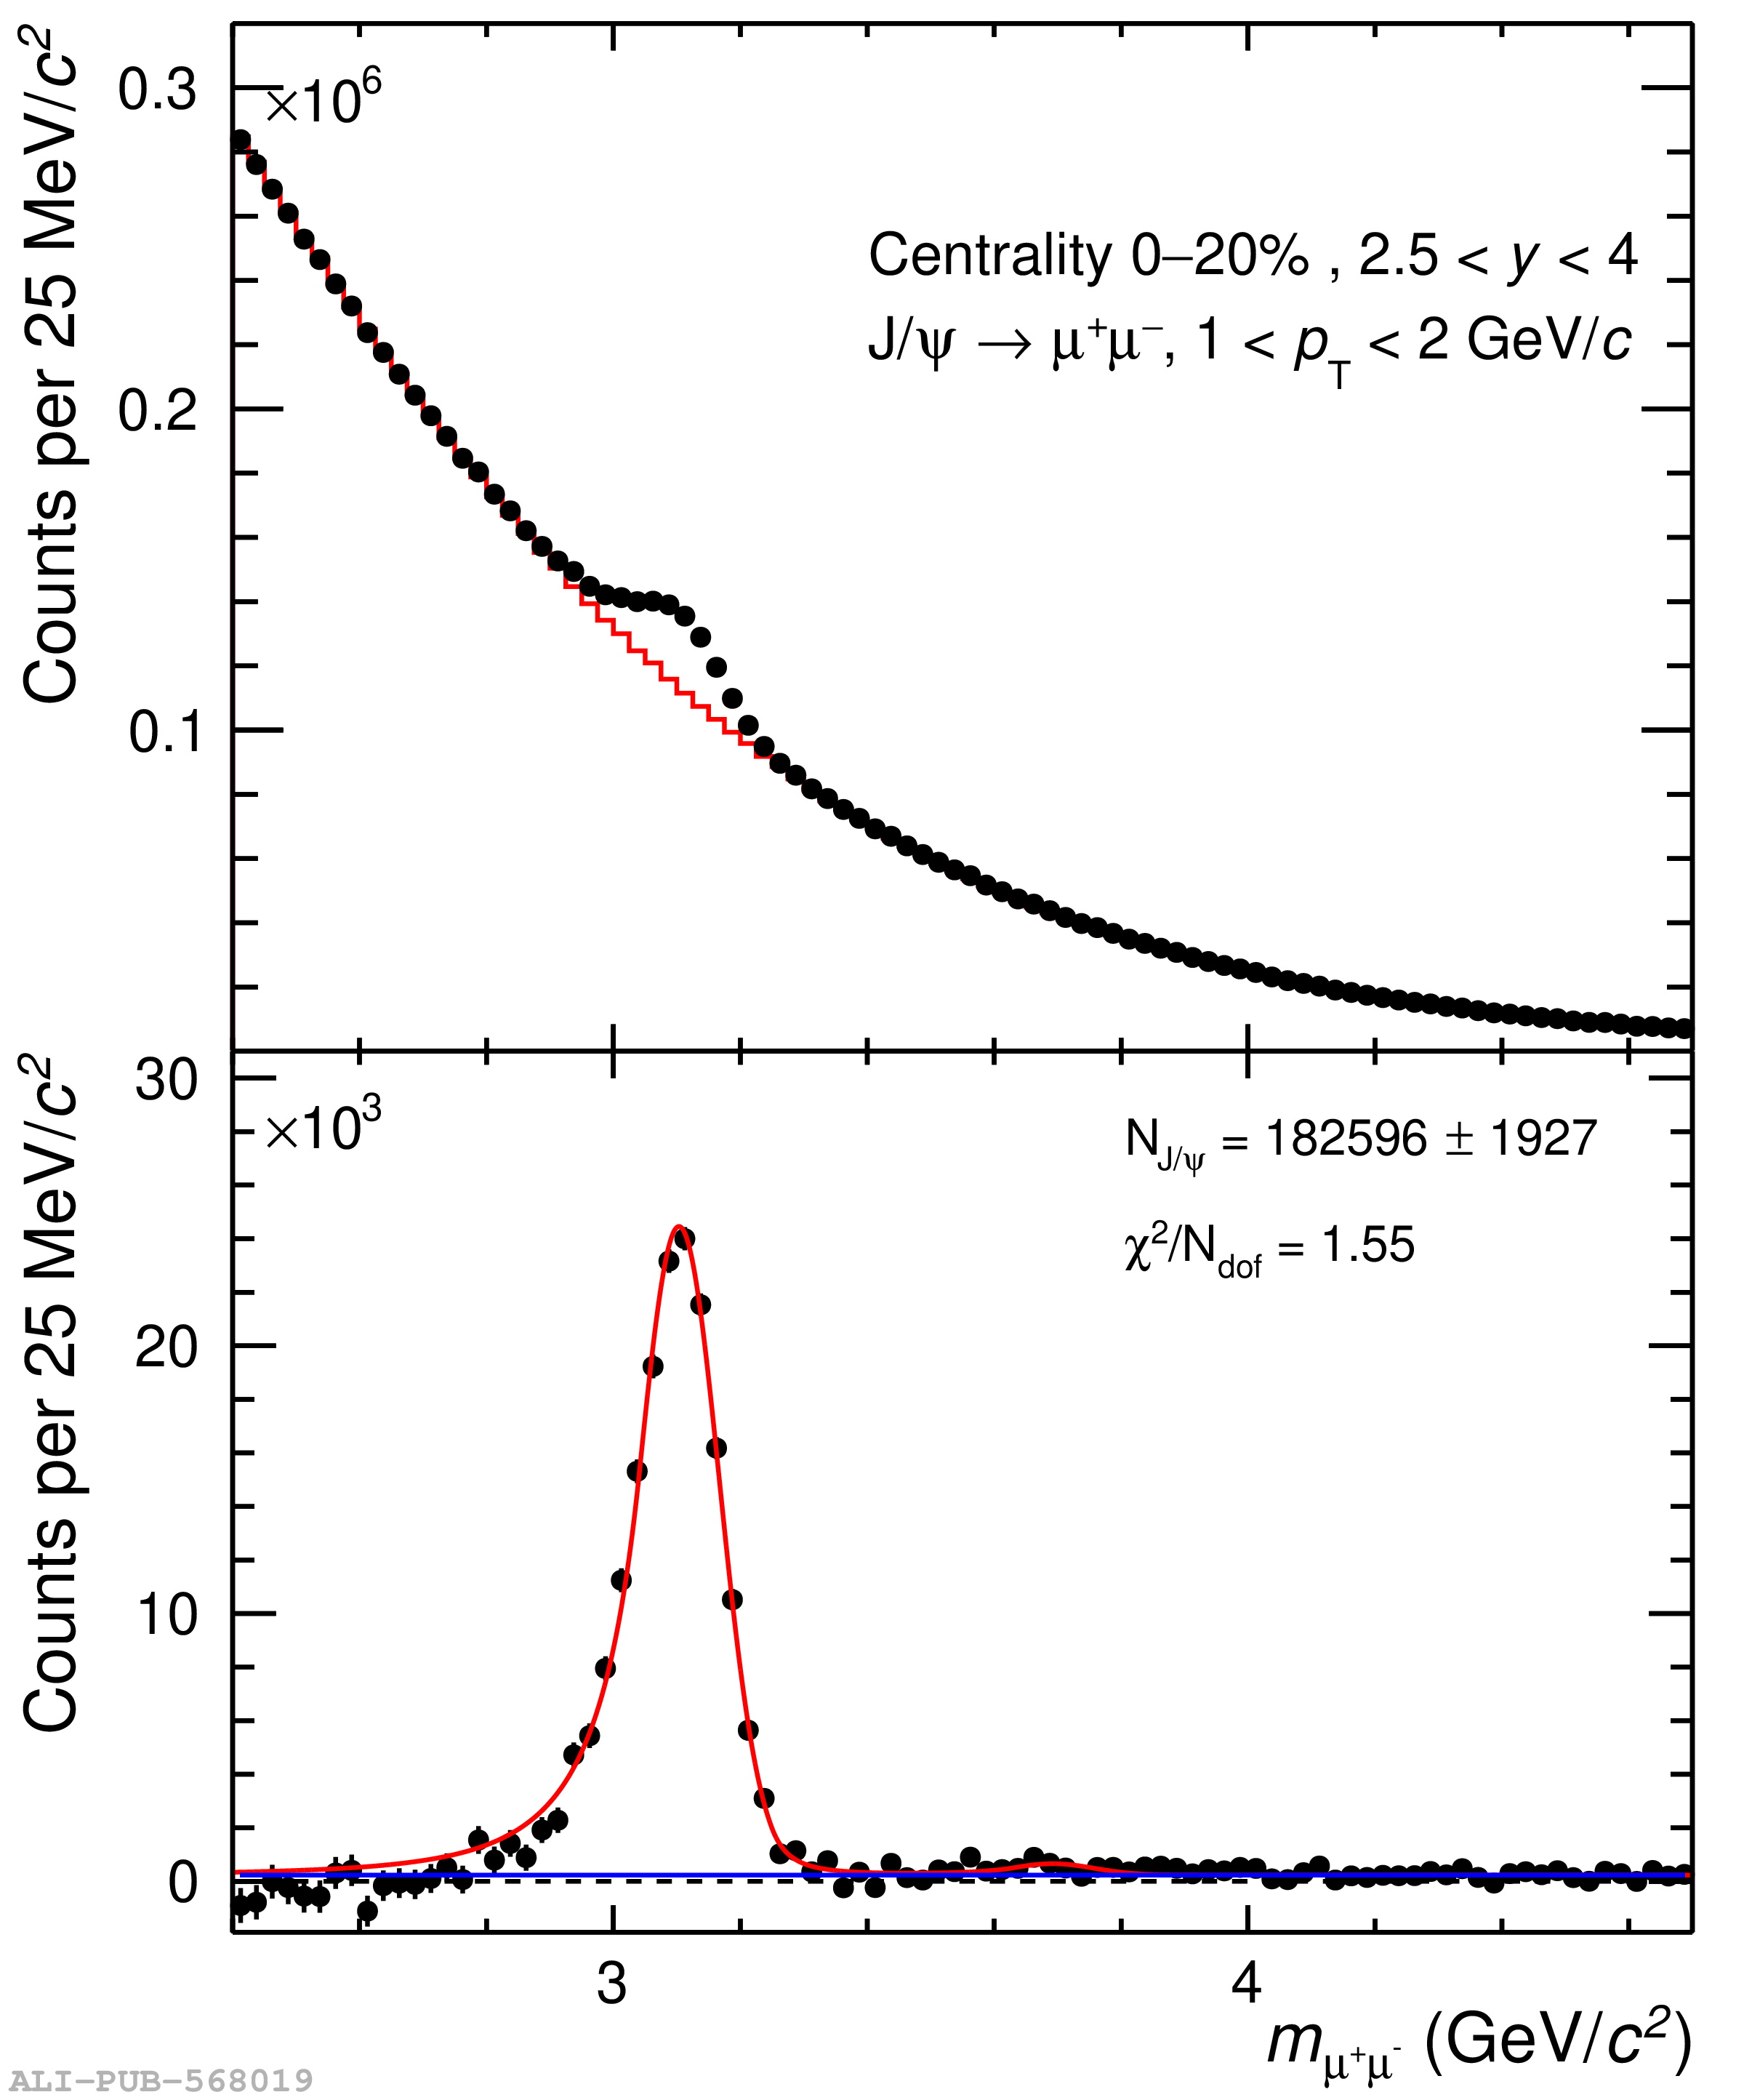 |
Figure 2
$\jpsi$ $\langle \pt \rangle$ extraction in Pb-Pb collisions at $\snn = 5.02$ TeV at midrapidity for the 0$-$5% (left panel) and the 70$-$90% (right panel) centrality interval. The data points correspond to opposite-sign ${\rm e^+e^-}$ pairs from the same event, the blue line to the ${\rm e^+e^-}$ pairs from mixed events, and the red line is the combined fit that includes the mixed events and residual background which is described by the polynomial function. | 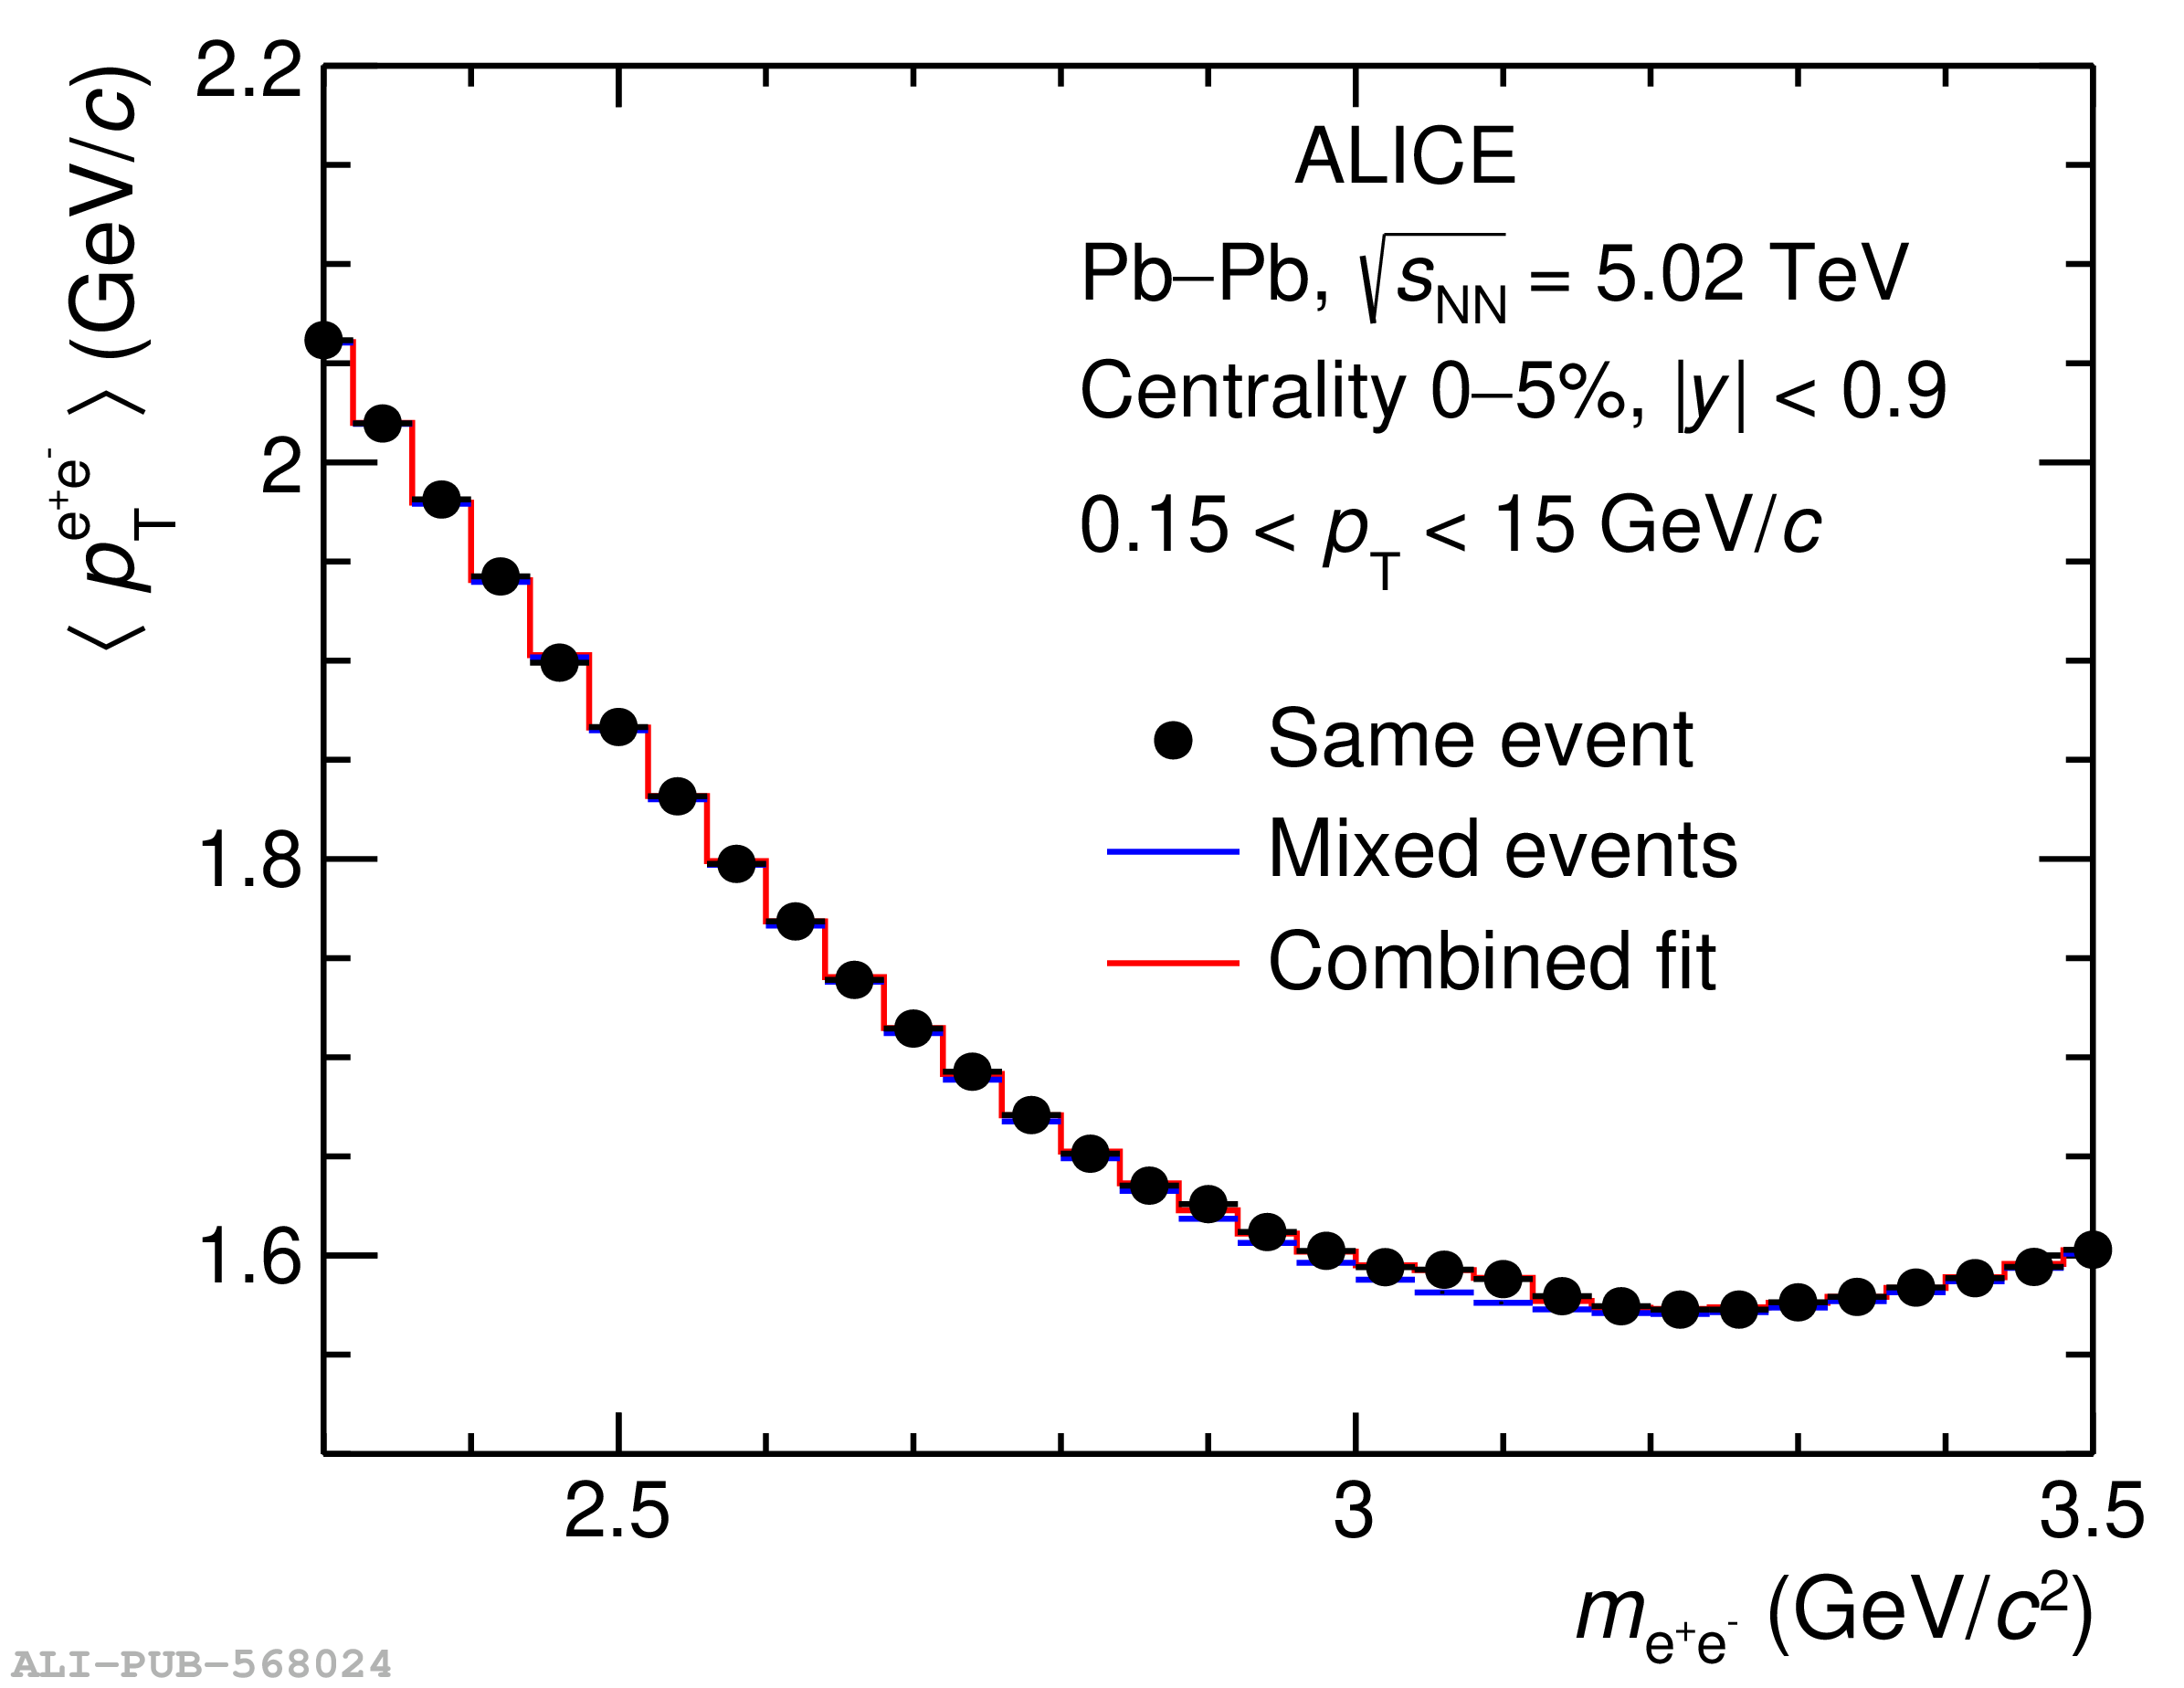  |
Figure 3
$\jpsi$ $\pt$-differential production yields in Pb-Pb collisions at $\snn=5.02$ TeV at midrapidity in the 0$-$10% (left panel) and 30$-$50% (right panel) centrality intervals. The statistical and systematic uncertainties are indicated, respectively, by the vertical error bars and the open boxes. The horizontal bars indicate the $\pt$ intervals. Data are compared to model calculations from Refs. [32, 33, 70]. The ratios between data and models are shown in the lower panels. The filled boxes around unity depict the quadratic sum of statistical and systematic uncertainties from the measurement, while the bands indicate model uncertainties. |  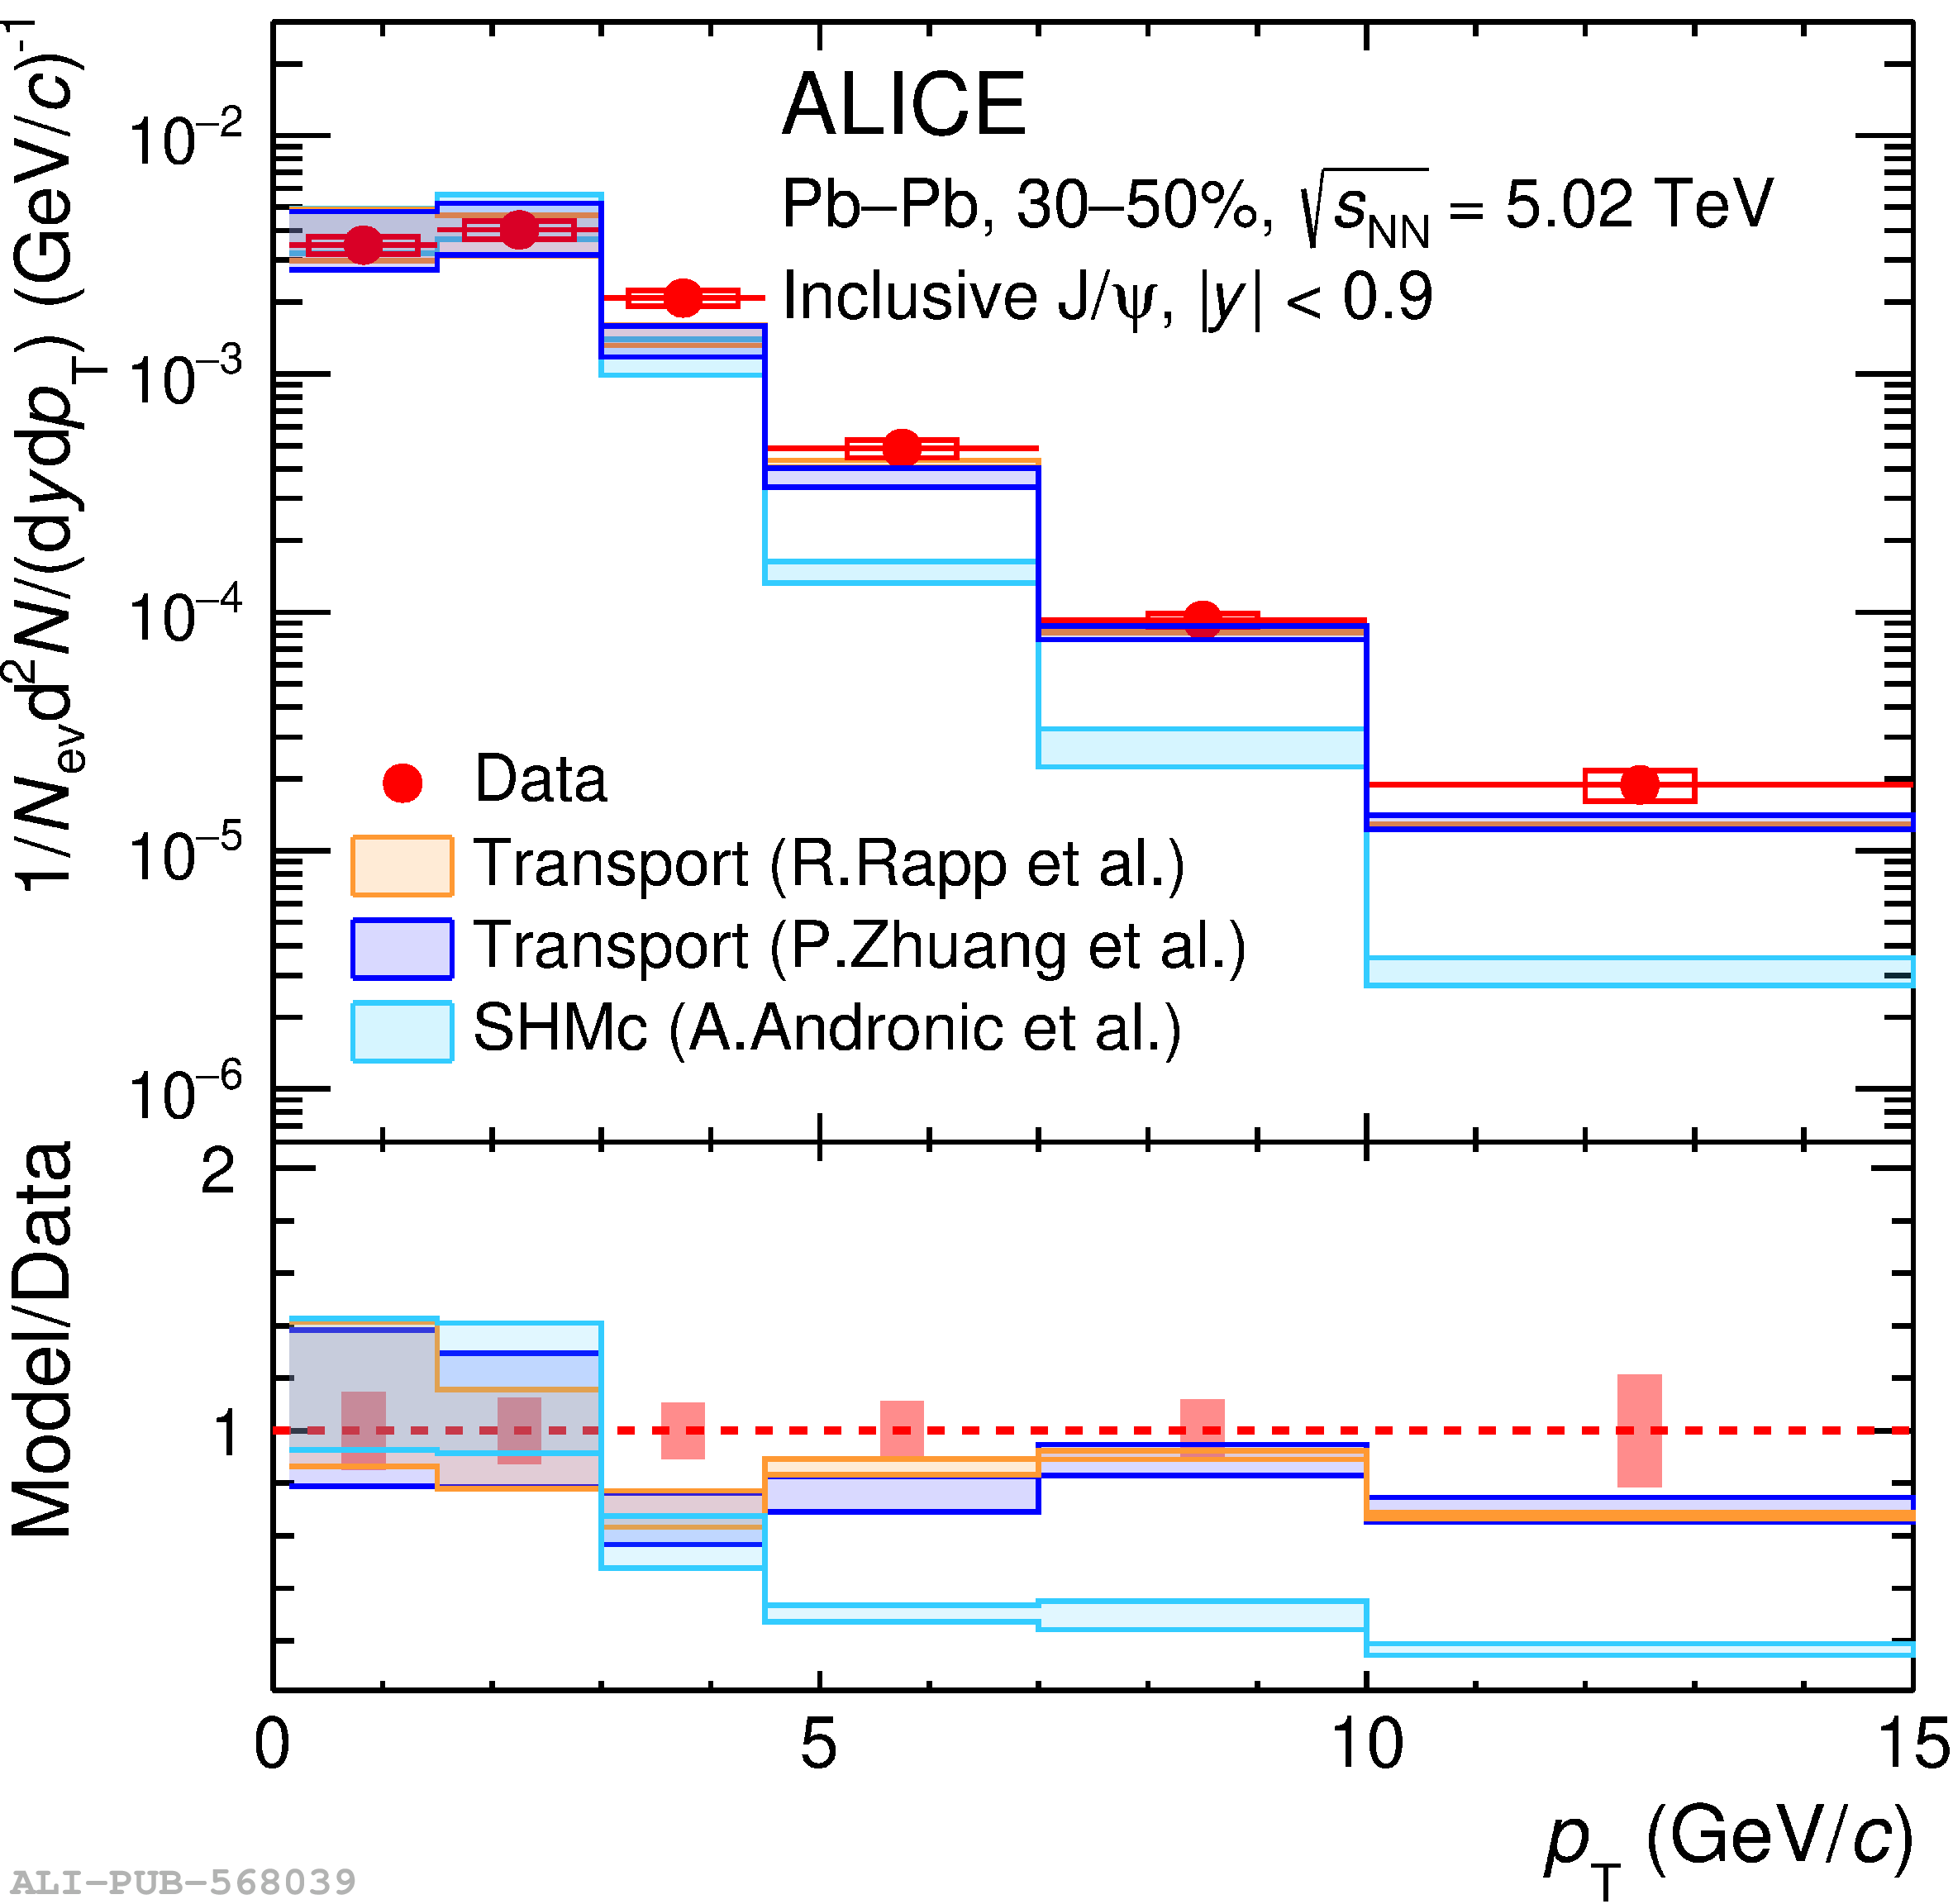 |
Figure 4
$\jpsi$ $\pt$-differential production yields in Pb-Pb collisions at $\snn=5.02$ TeV at forward rapidity in the 0$-$20%, 20$-$40%, and 40$-$90% centrality intervals. The statistical and systematic uncertainties are indicated, respectively, by the vertical error bars and the open boxes. The horizontal bars indicate the $\pt$ intervals. Data are compared to model calculations from Refs. [32, 33, 70]. The ratio between data and models is shown in the lower panels. The filled boxes around unity depict the quadratic sum of statistical and systematic uncertainties from the measurement, while the bands indicate model uncertainties. | 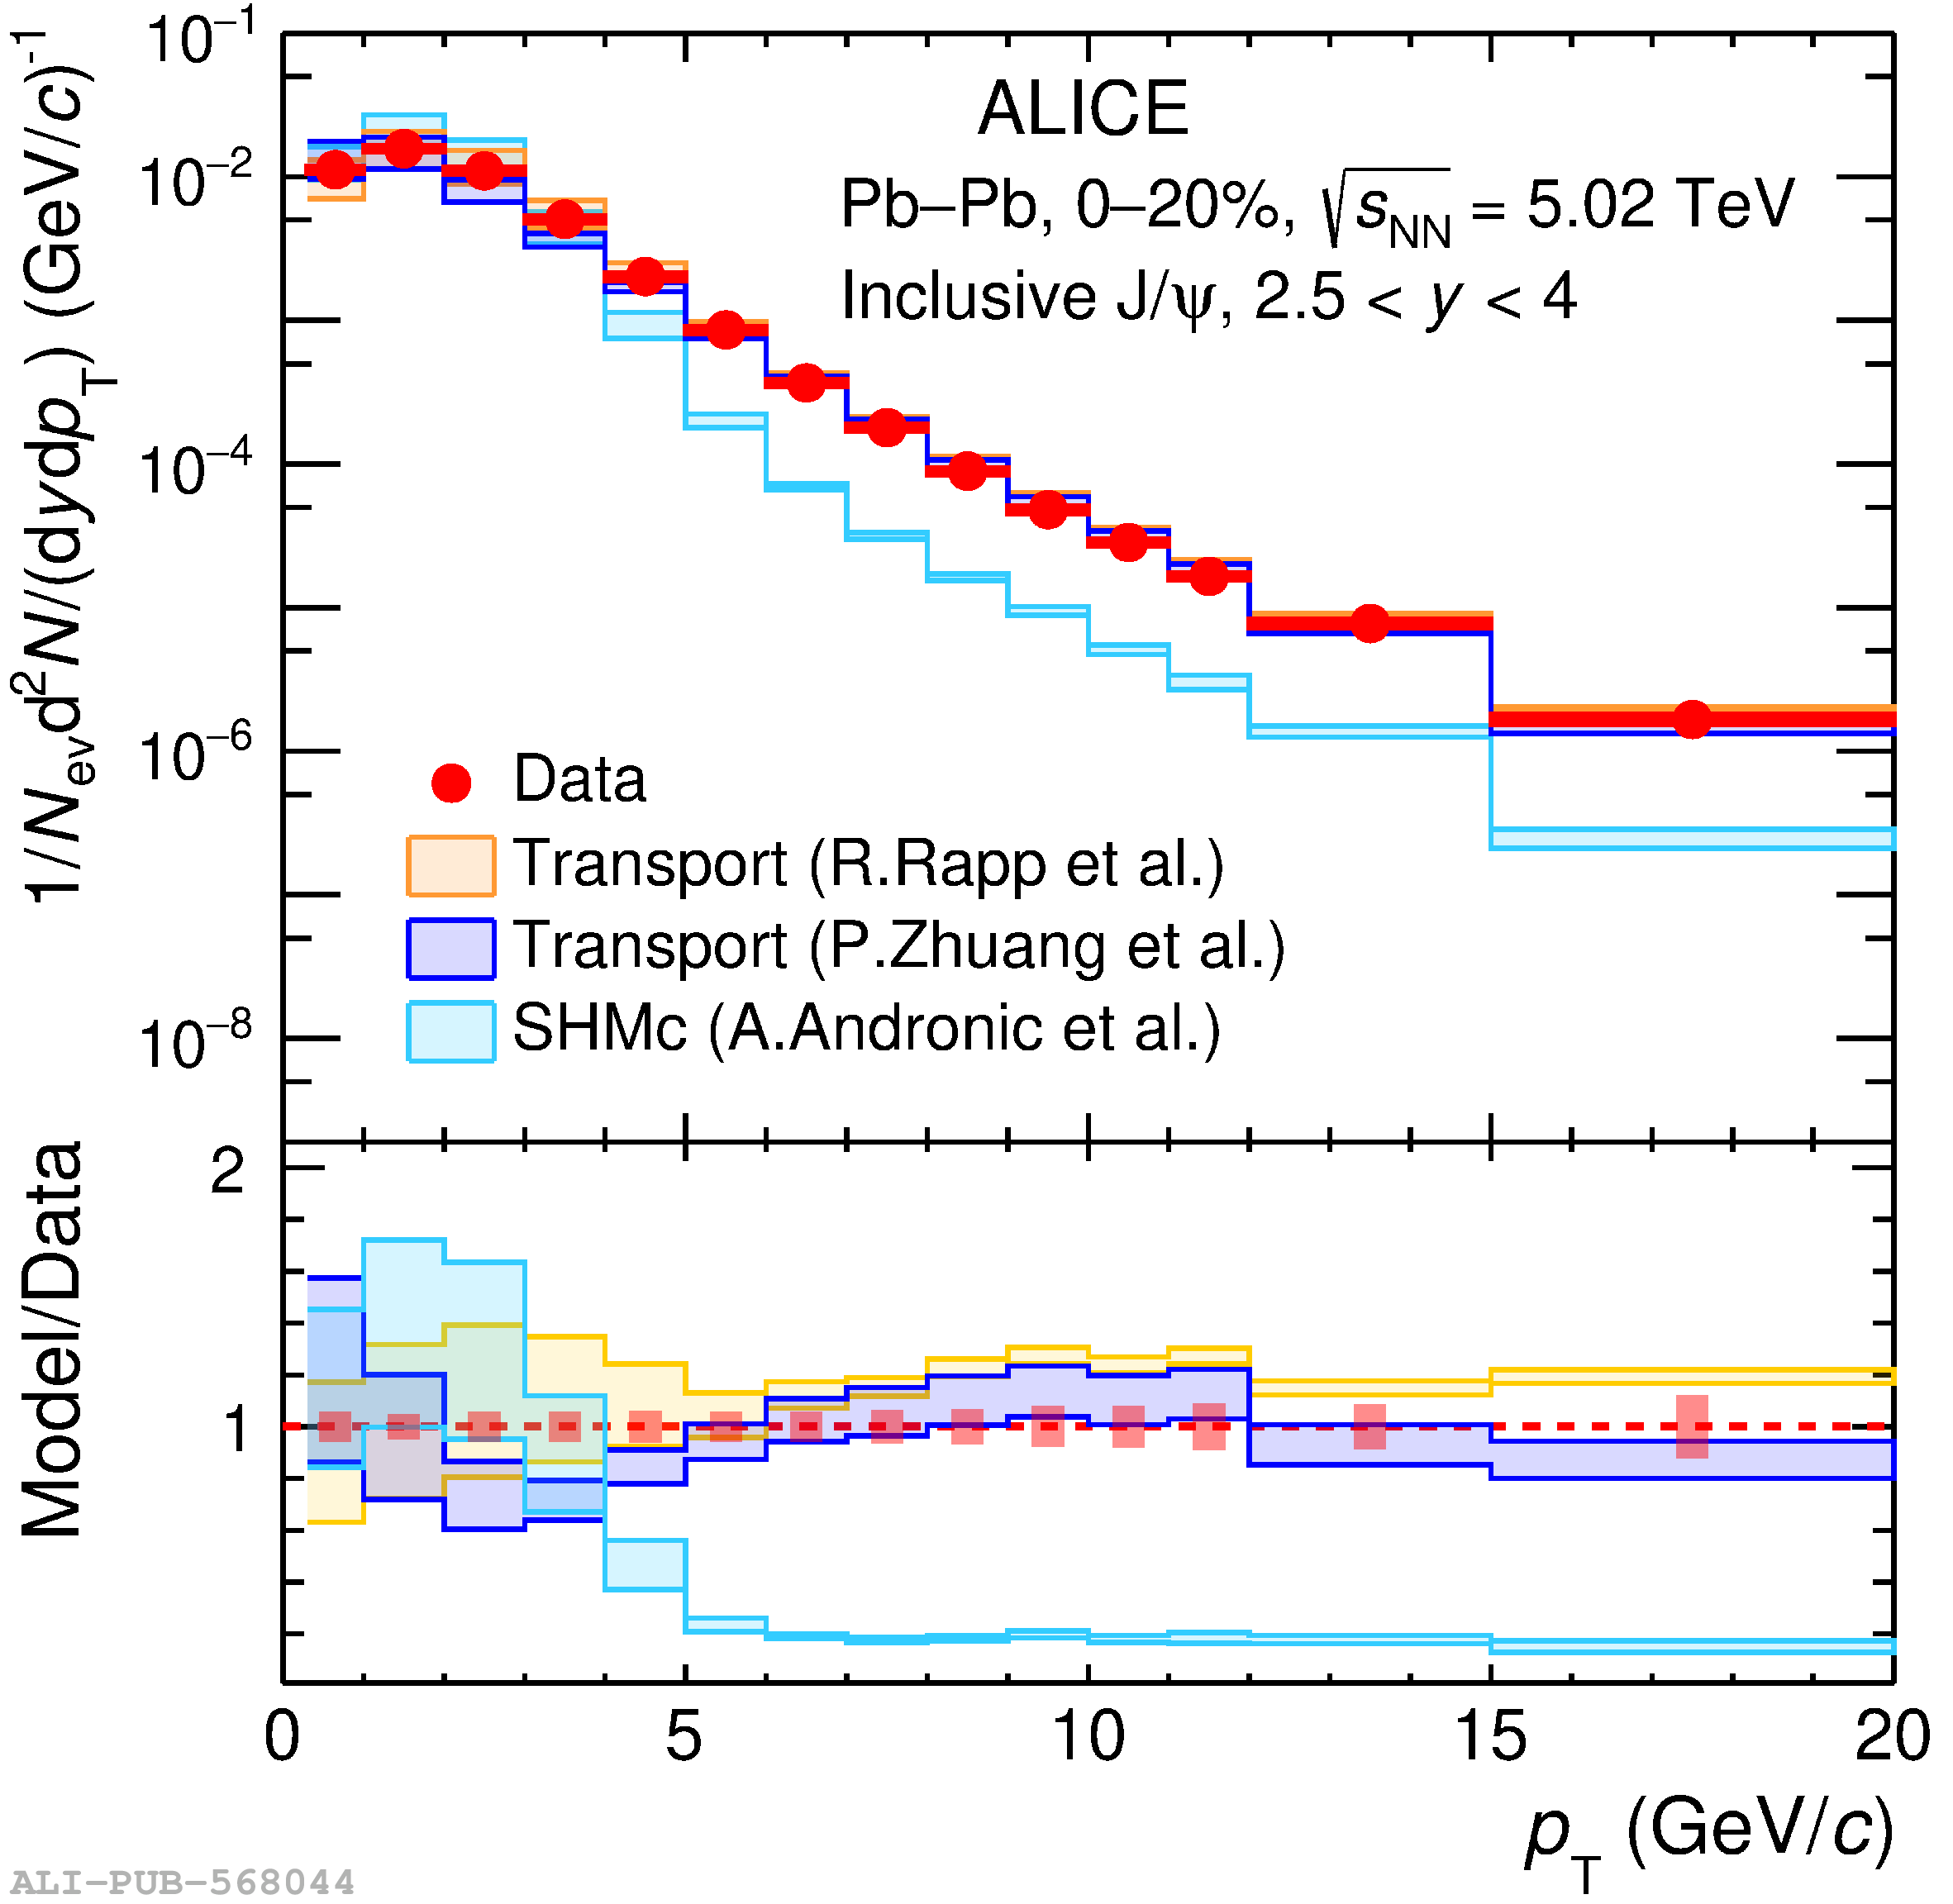 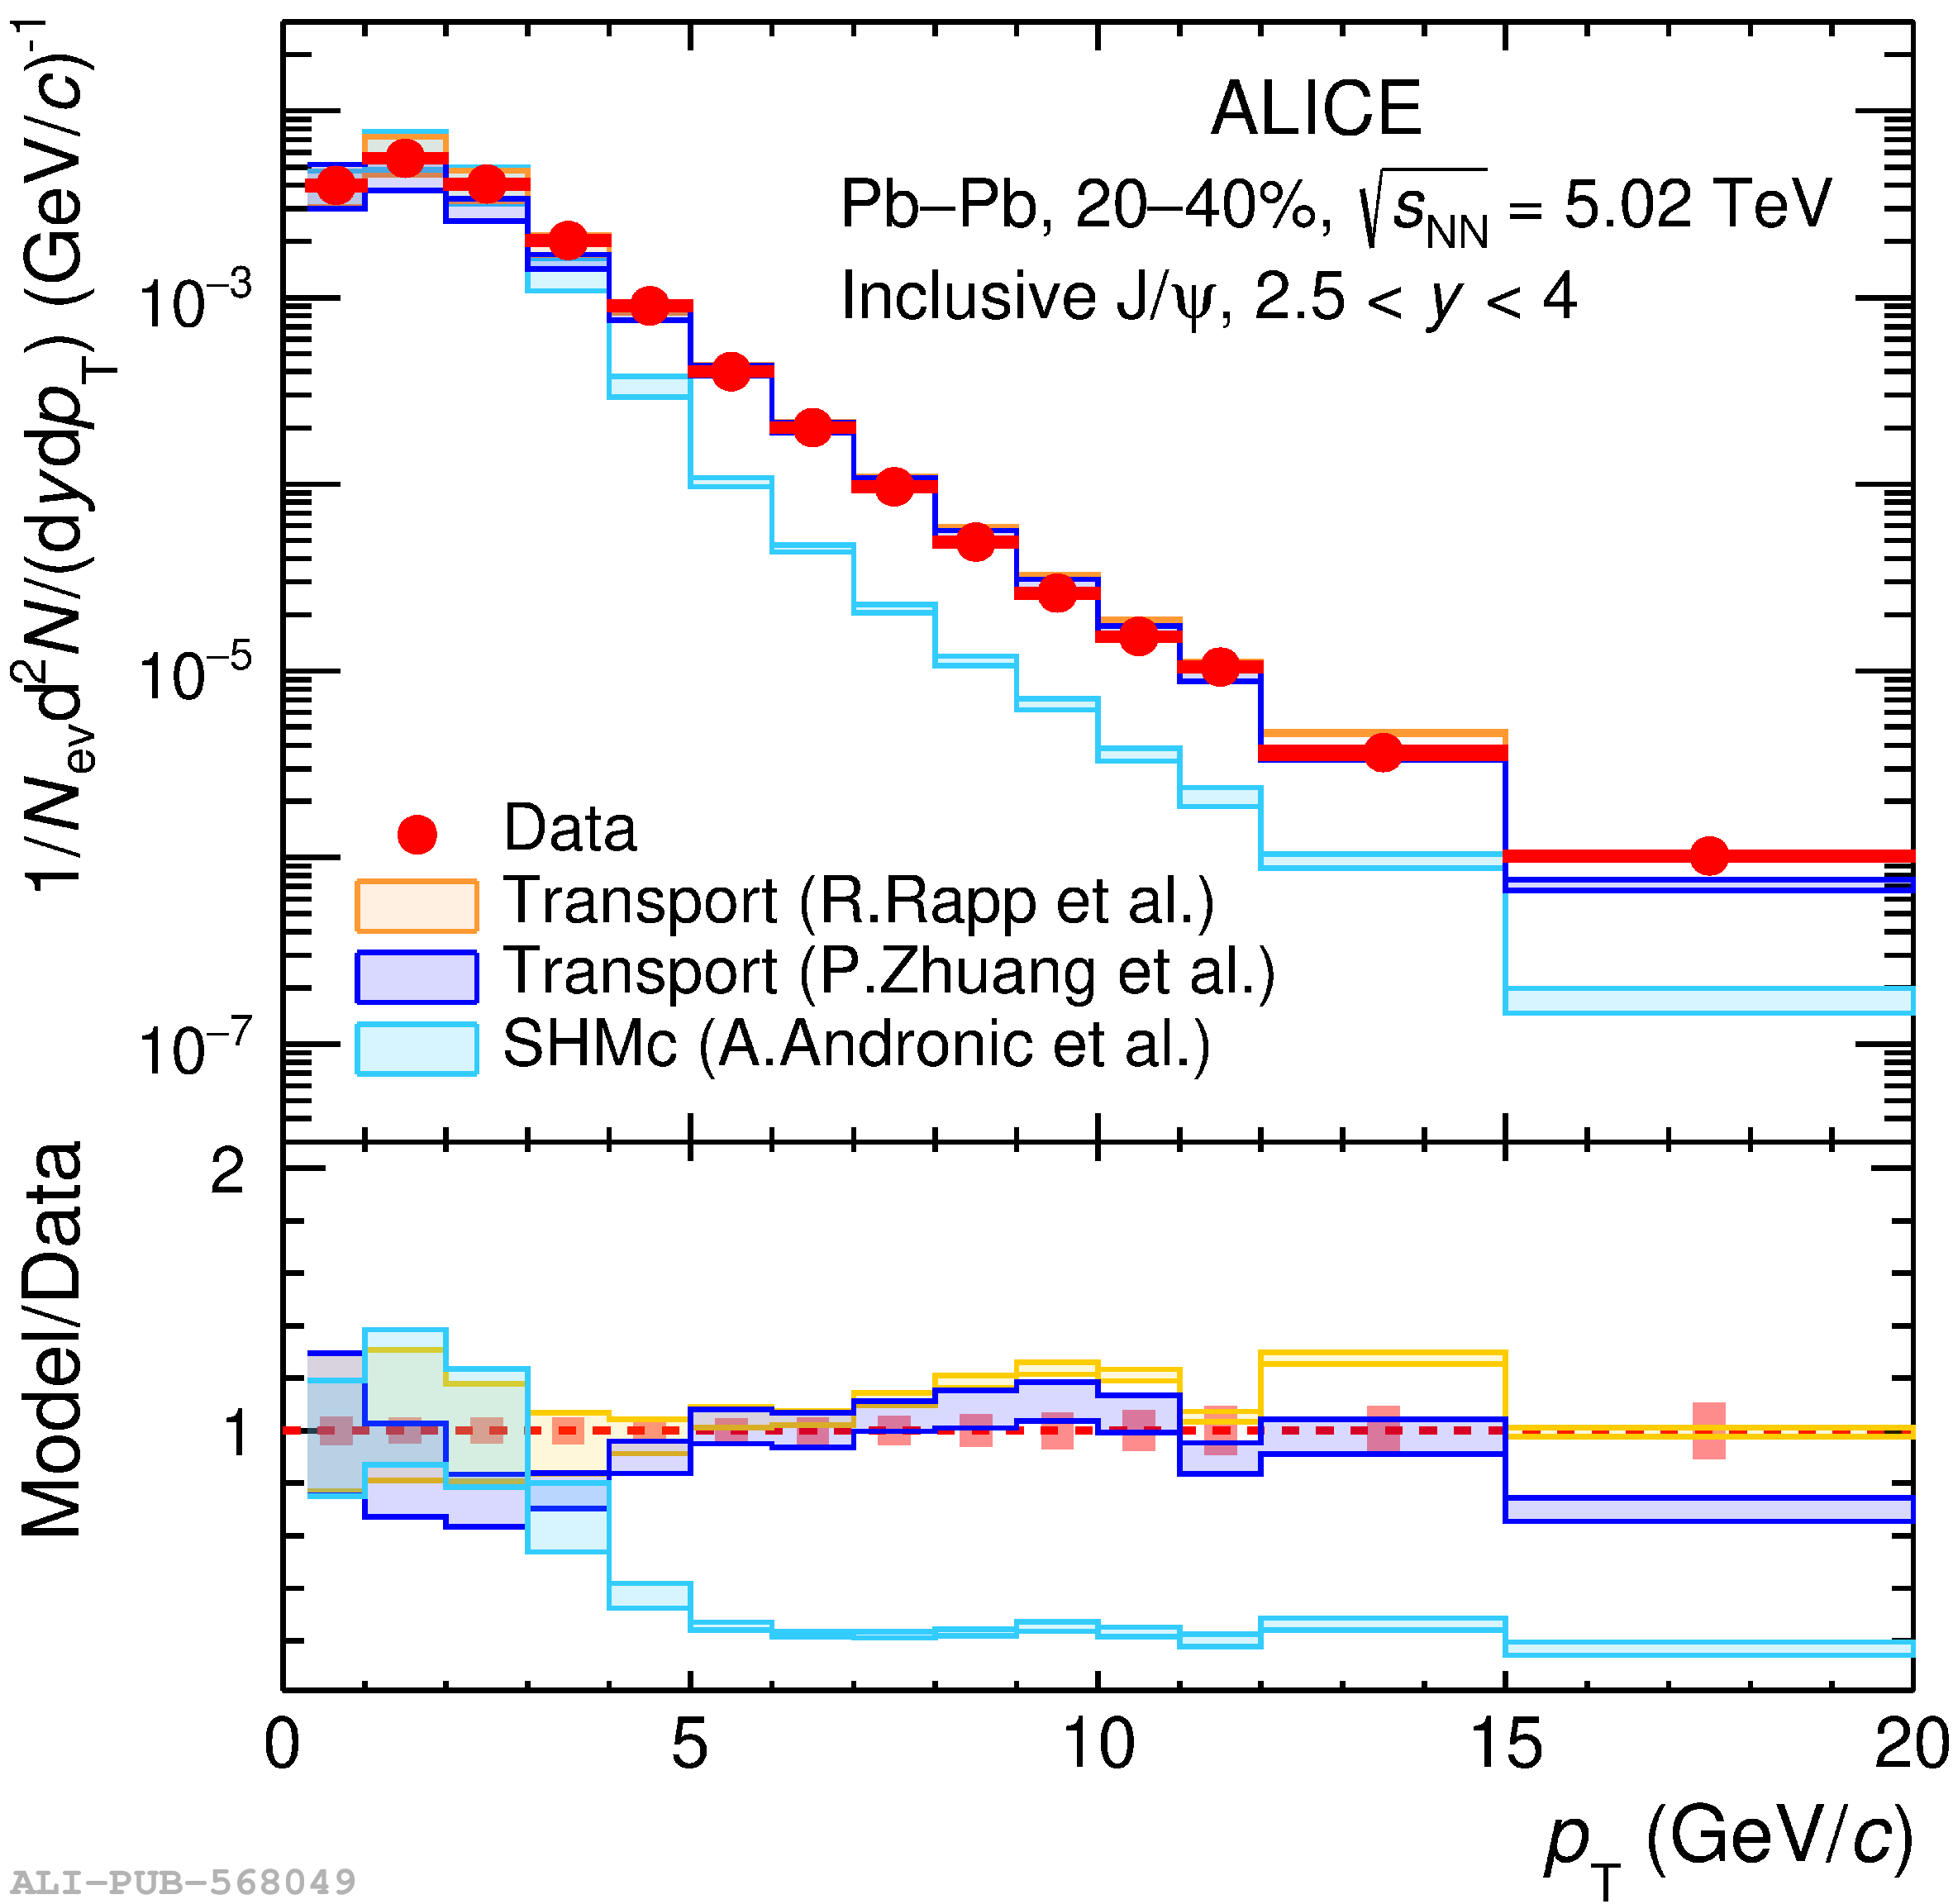 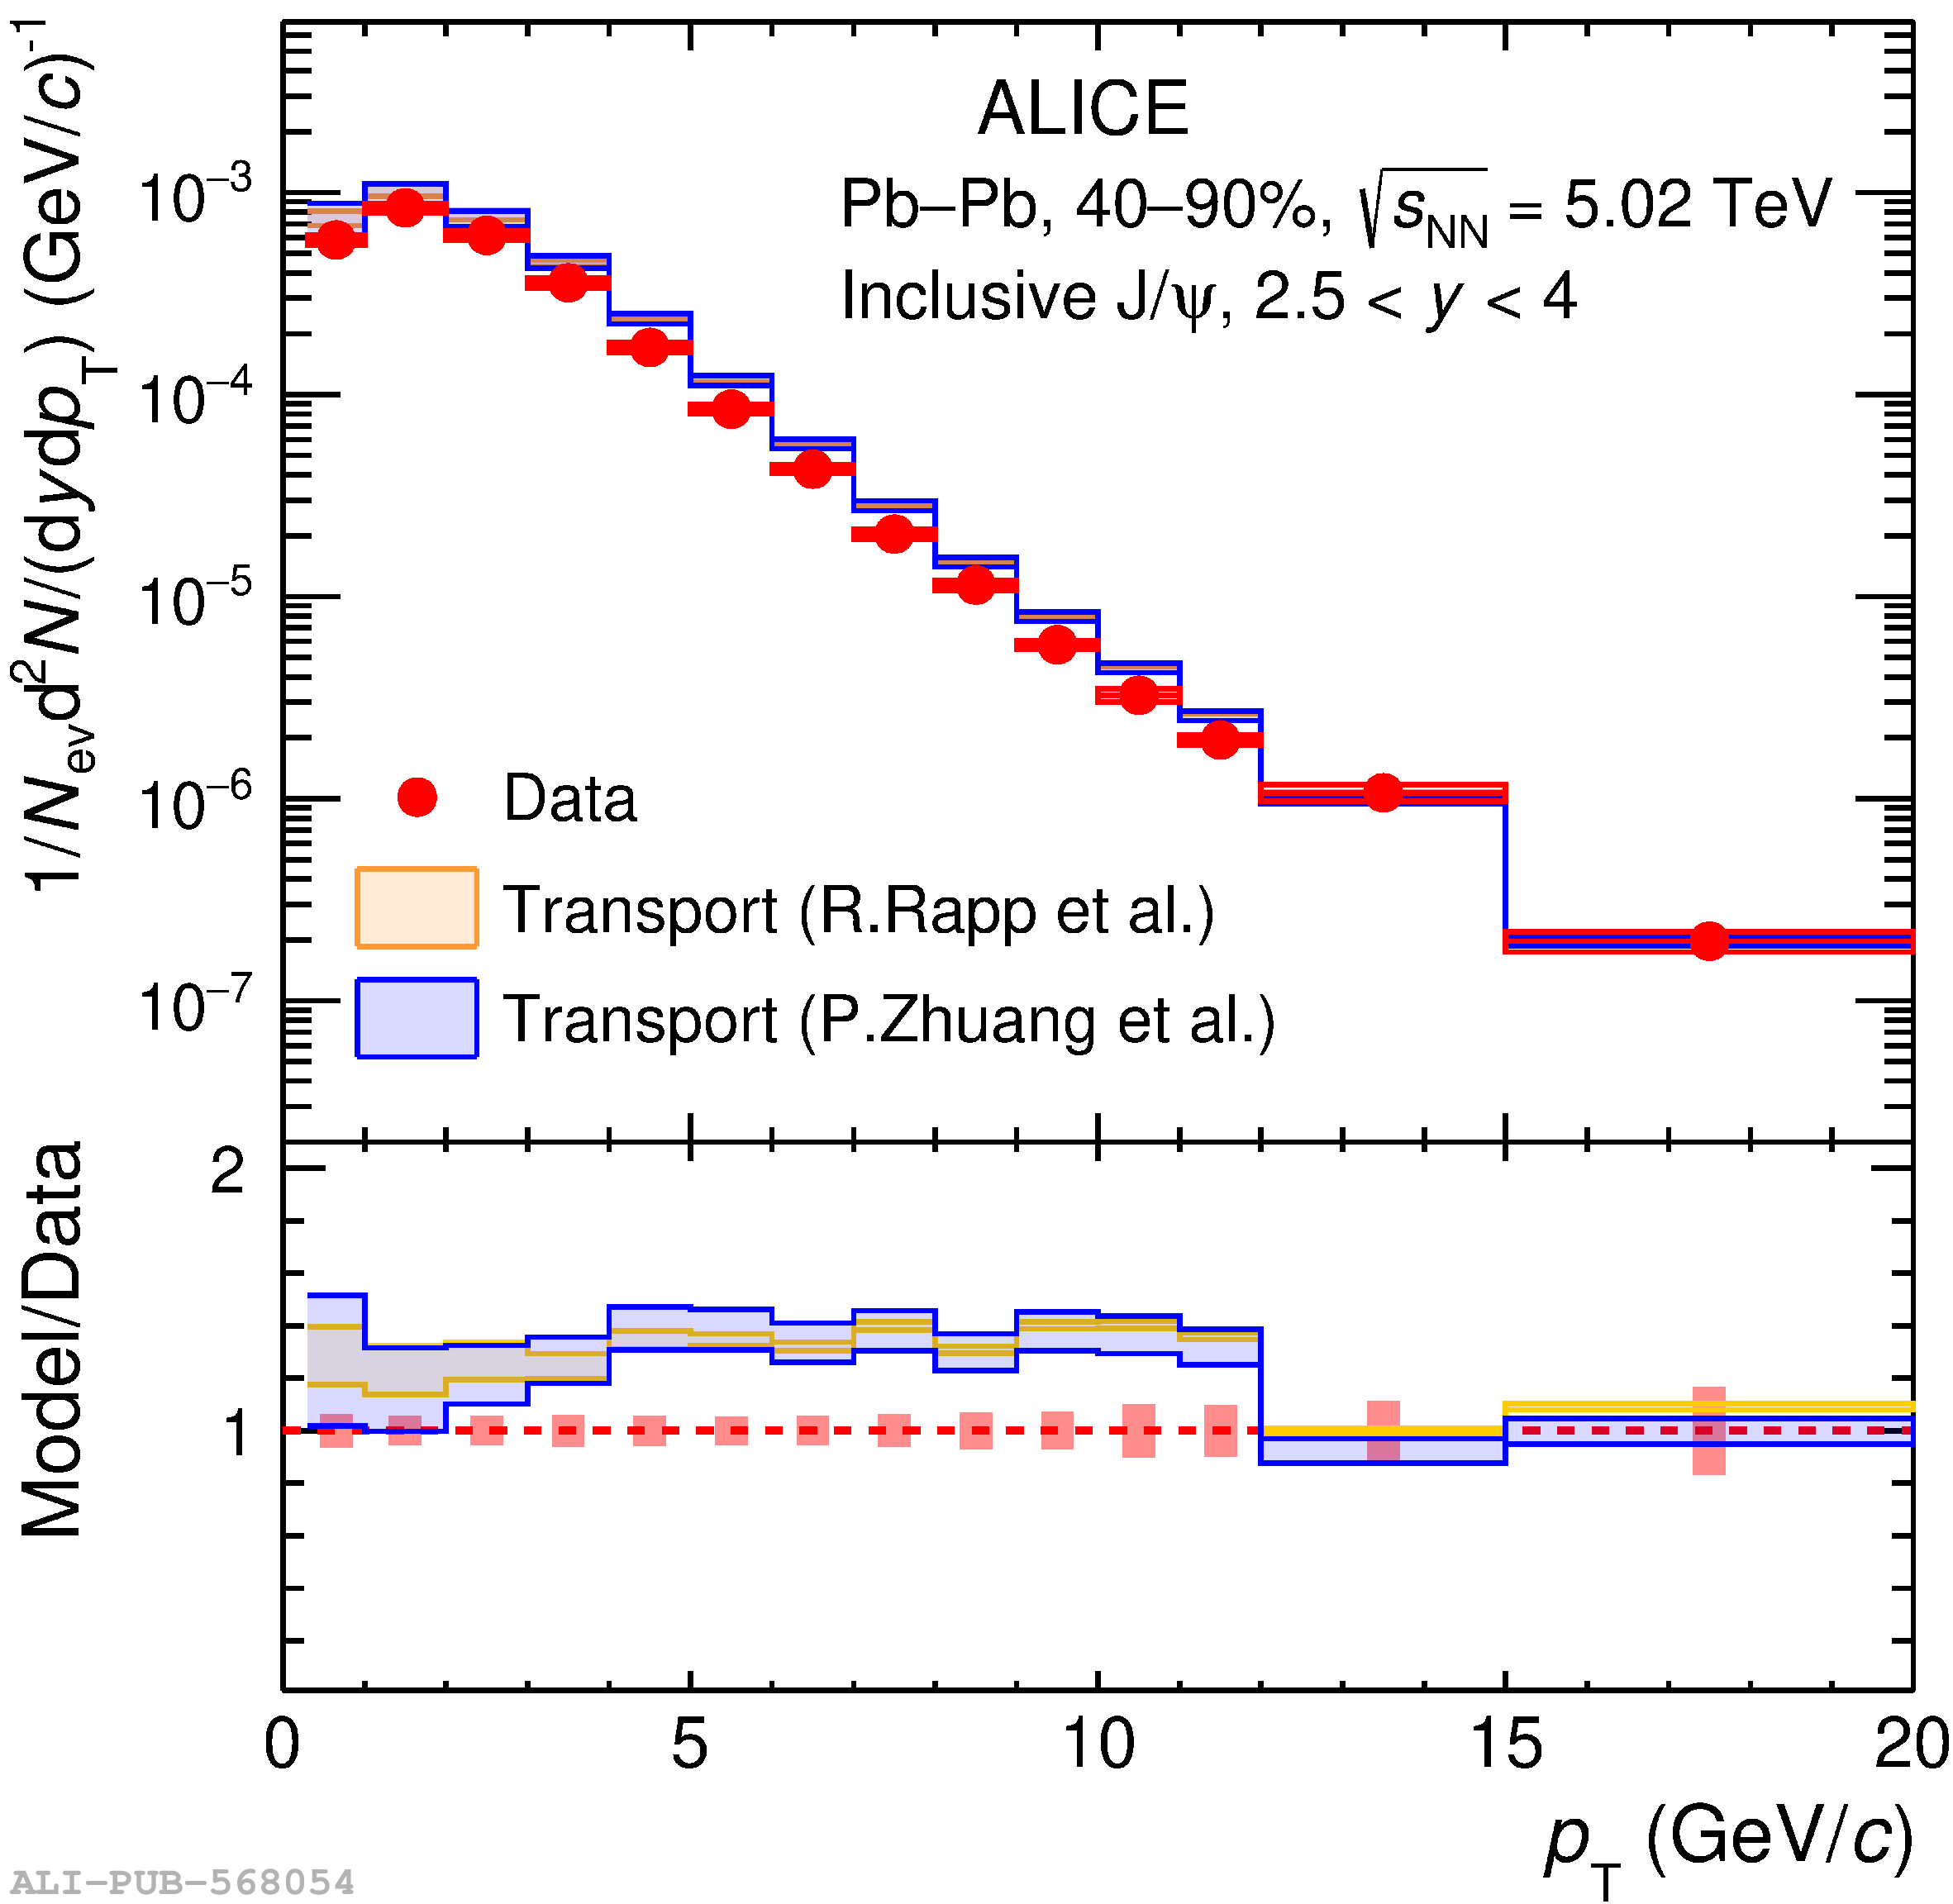 |
Figure 5
Inclusive $\jpsi$ nuclear modification factor at midrapidity and forward rapidity, integrated over $\pt$, as a function of the number of participants in Pb-Pb collisions at $\snn=5.02$ TeV. The statistical and systematic uncertainties are indicated, respectively, by the vertical error bars and the open boxes around the data points. The filled boxes around unity show the global uncertainties. | 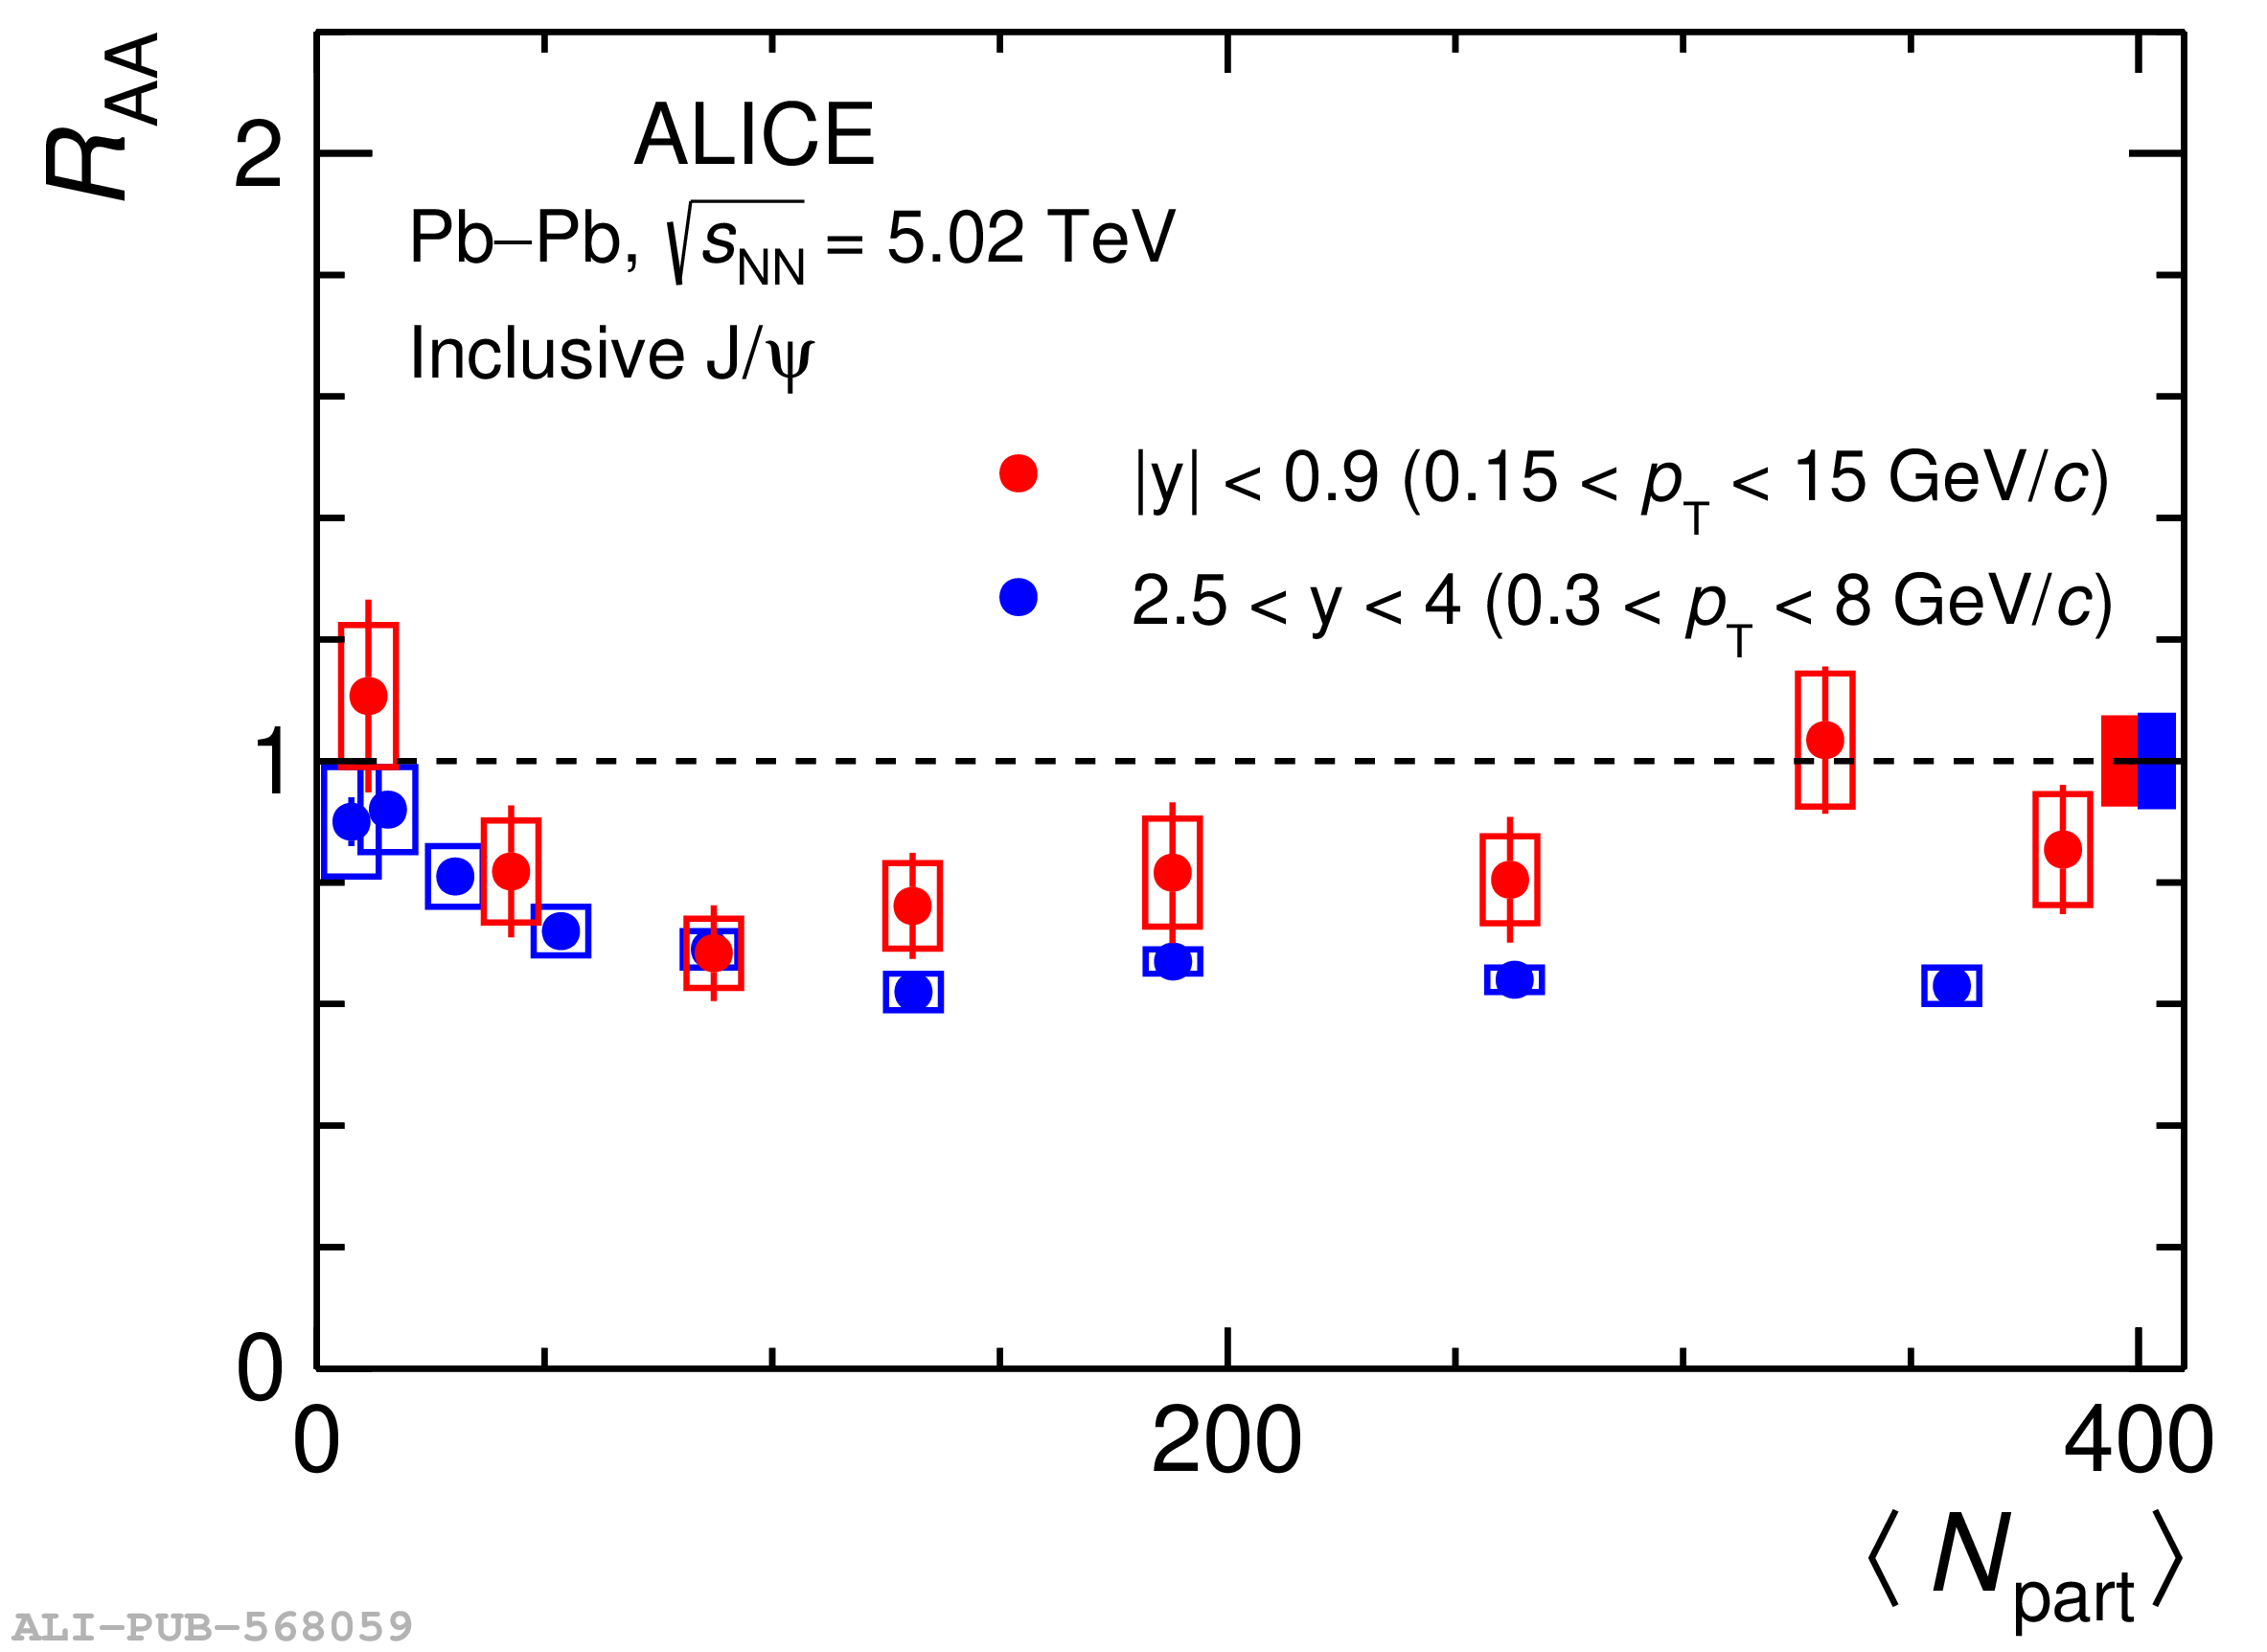 |
Figure 6
Inclusive $\jpsi$ $\pt$-differential $\RAA$ in Pb-Pb collisions at $\snn=5.02$ TeV in various centrality intervals. The left panel shows the comparison of $\RAA$ measured in central (0$-$10%) and semicentral (30$-$50%) collisions at midrapidity. For the data point in the $\pt$ bin 10 $< \pt <$ 15 GeV/$c$ an open symbol is used to highlight the usage of pp reference from the extrapolation approach. The right panel shows the measured $\RAA$ in three centrality classes, 0$-$20%, 20$-$40%, and 40$-$90%, at forward rapidity. The statistical and systematic uncertainties are indicated, respectively, by the vertical error bars and the open boxes around the data points. The filled boxes around unity show the global uncertainties. | 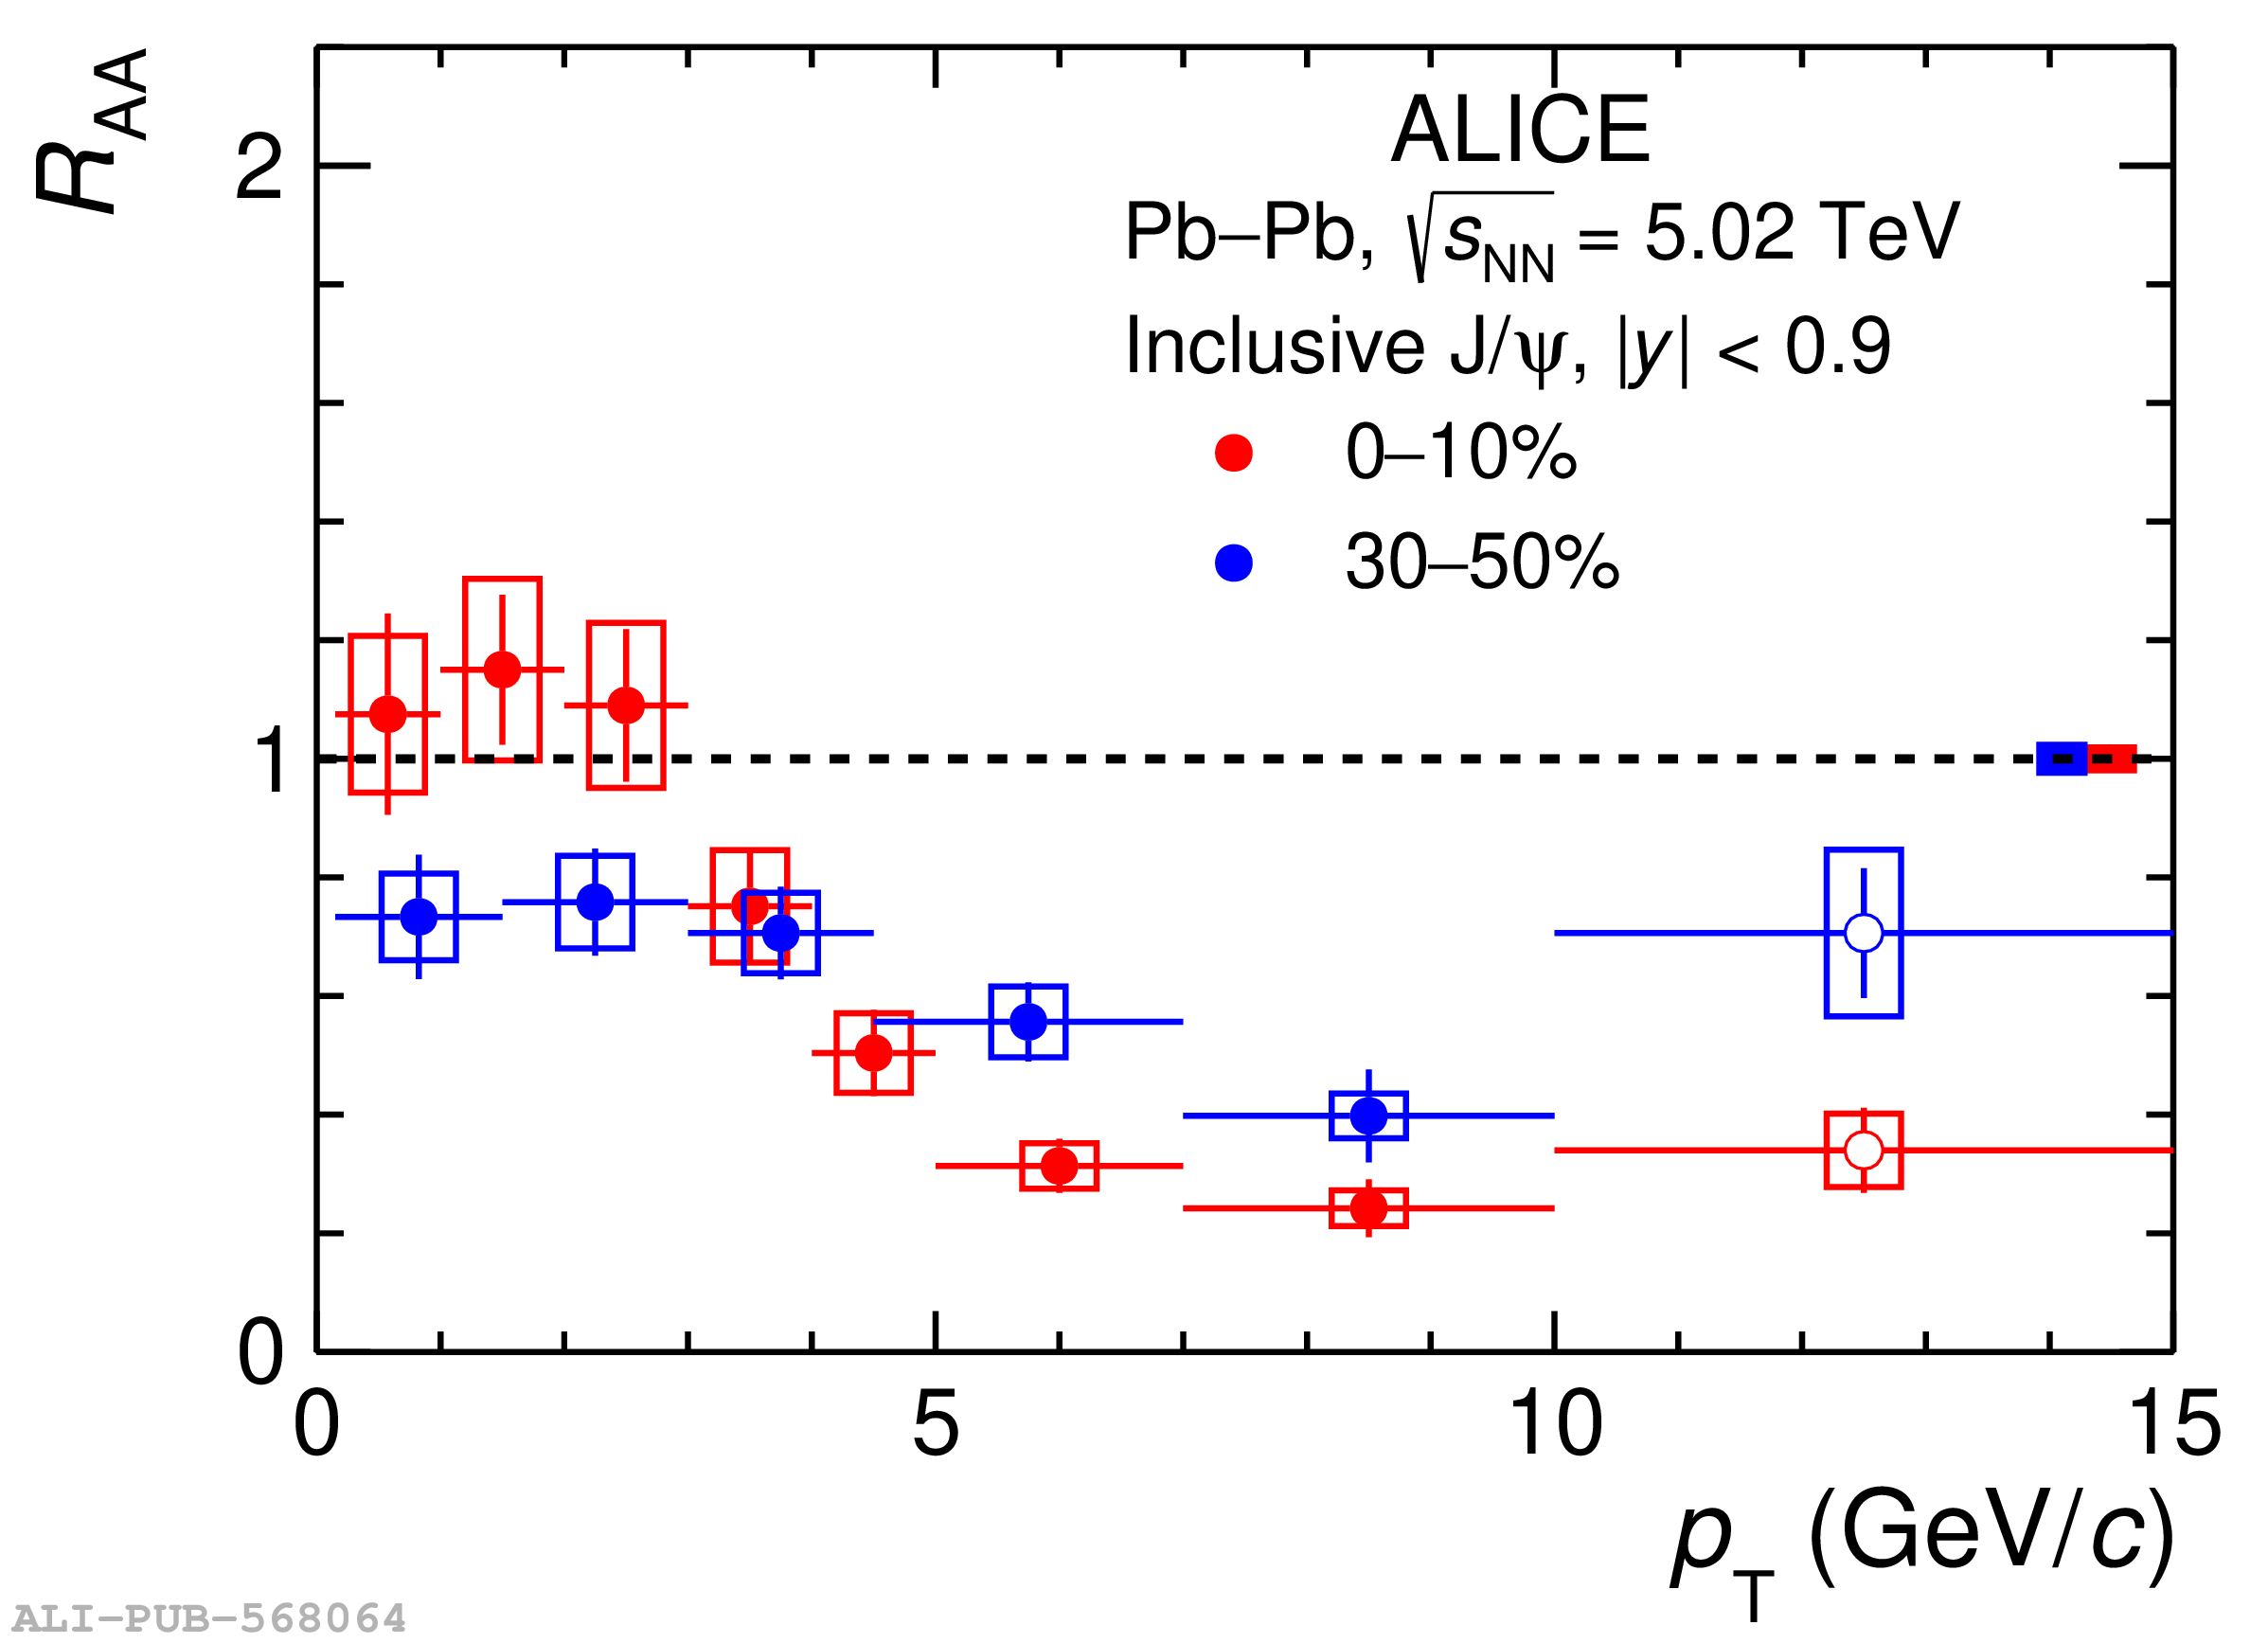 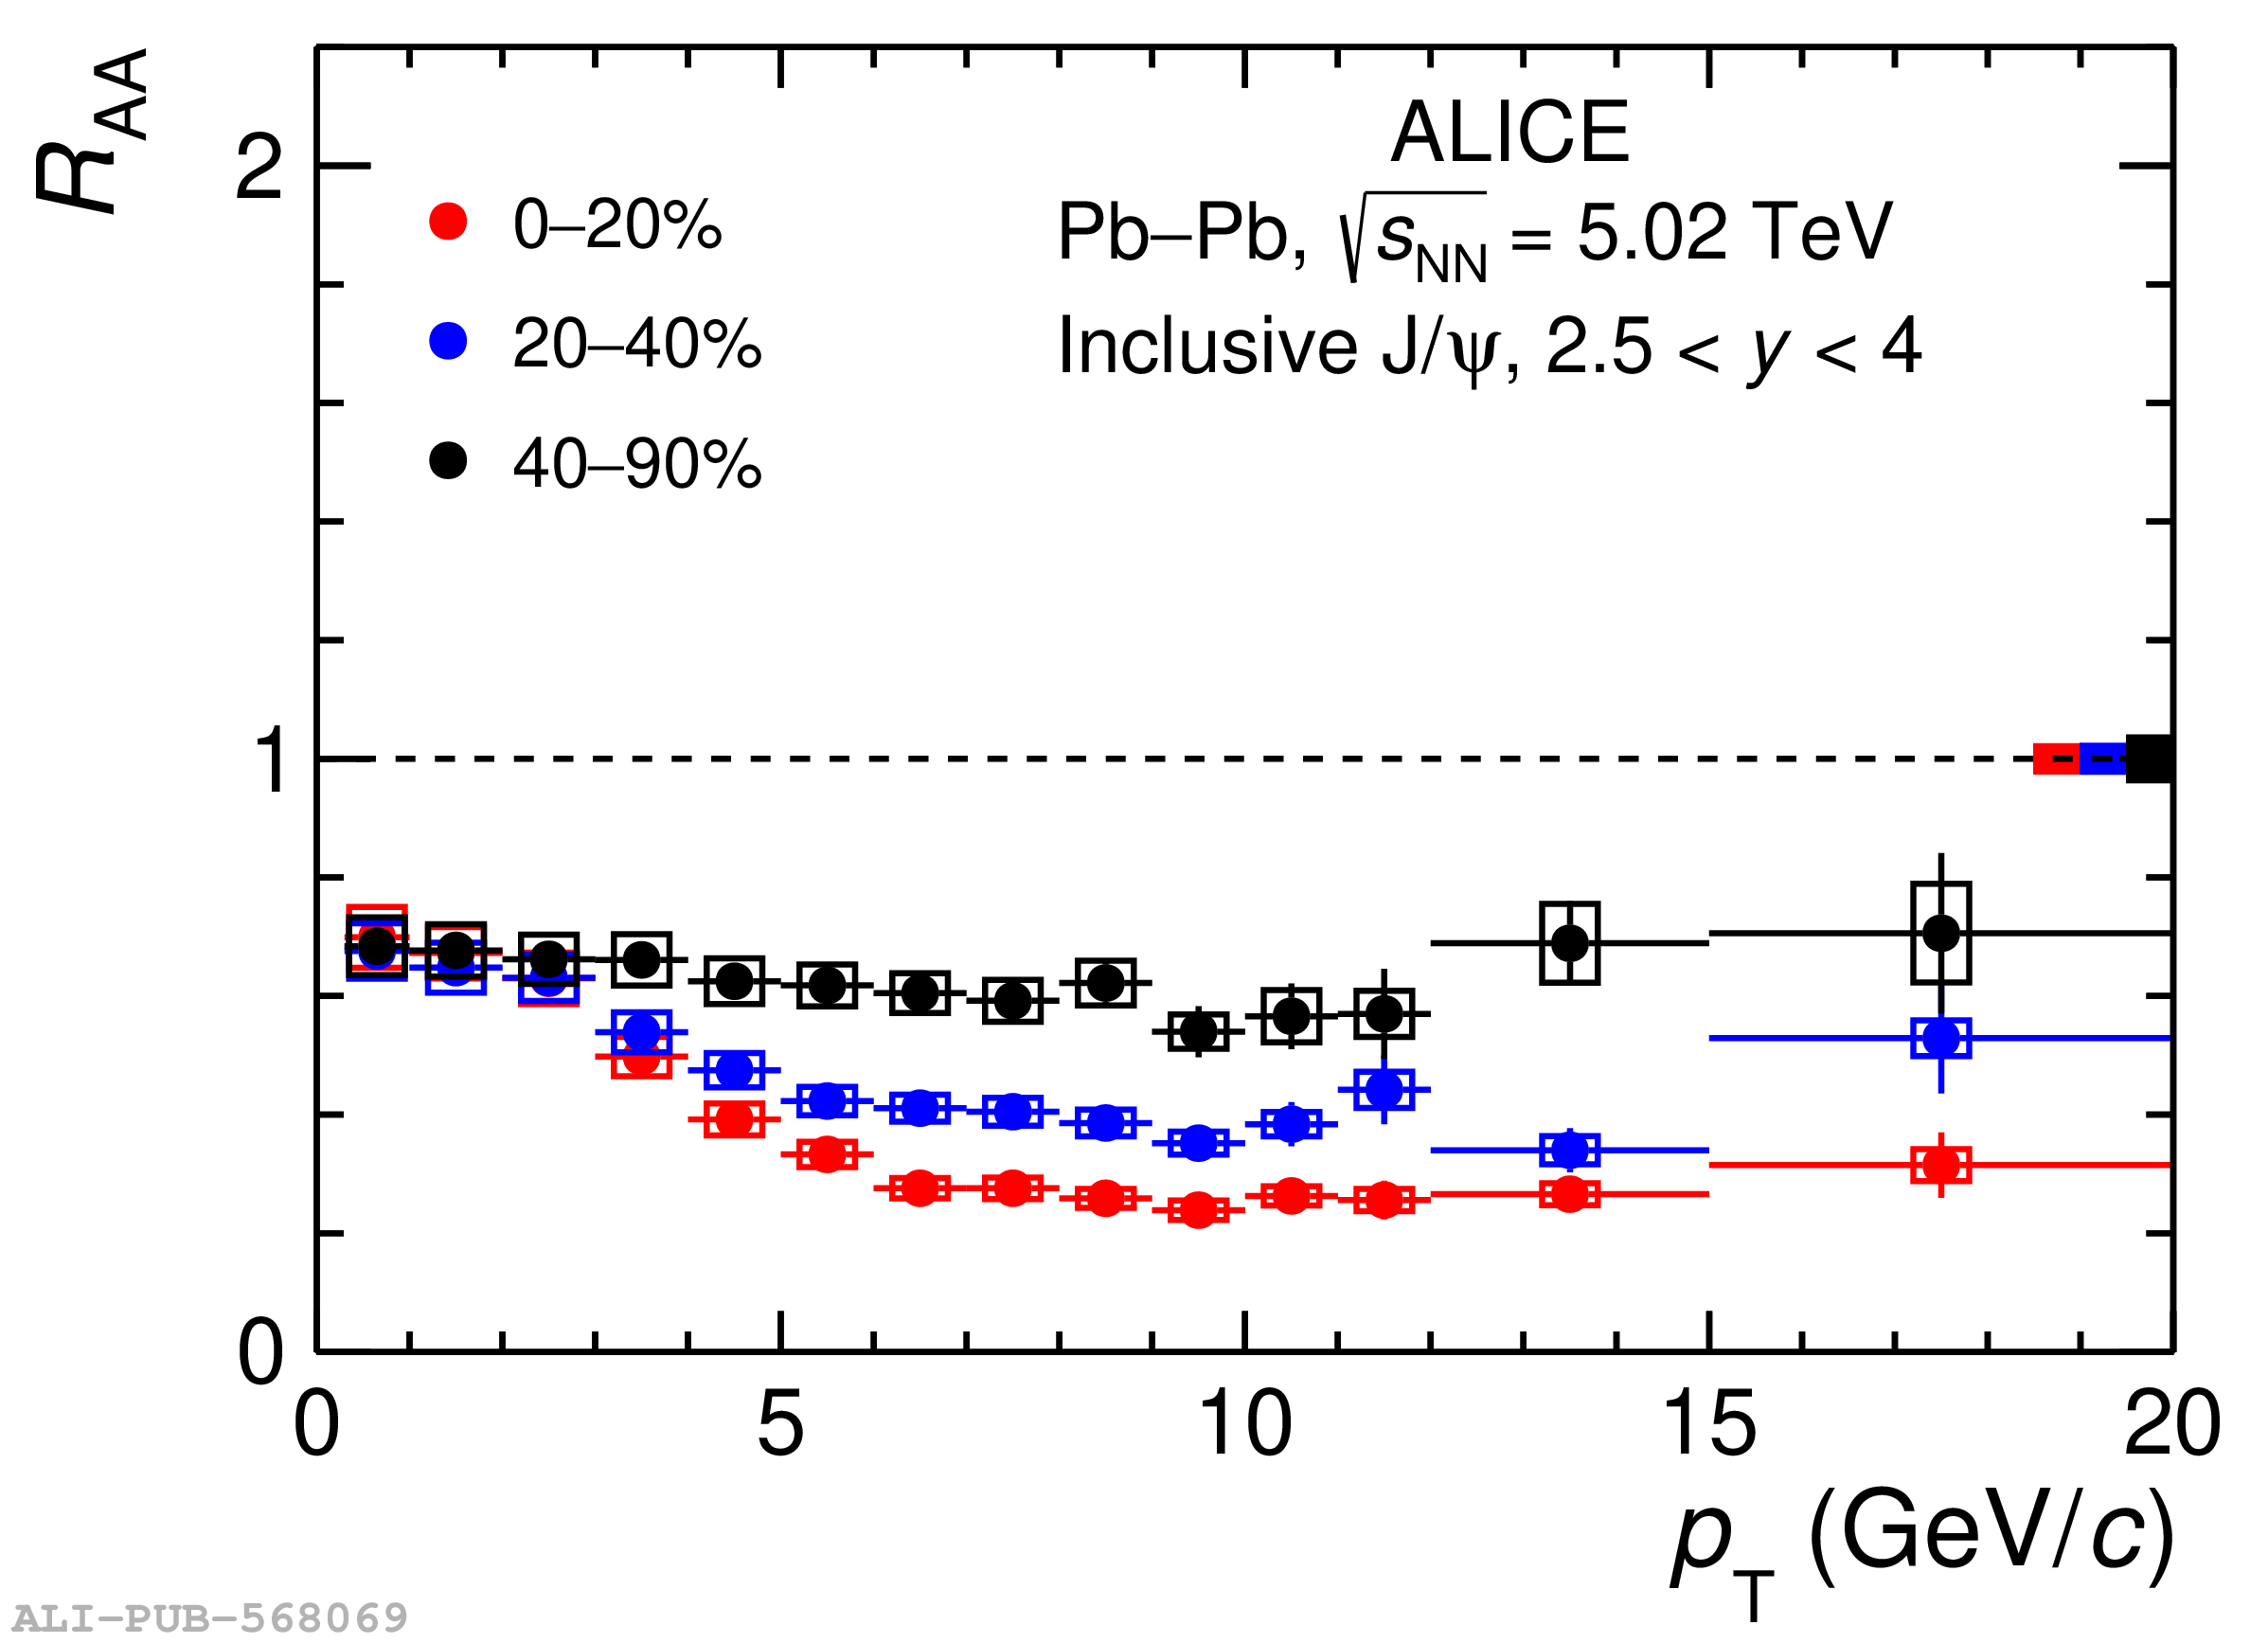 |
Figure 7
Inclusive $\jpsi$ $\RAA$ as a function of $\pt$ in Pb-Pb collisions at $\snn=5.02$ TeV at midrapidity and forward rapidity, in the 0$-$10% centrality class and 0$-$20% centrality class, respectively. For the data point in the $\pt$ bin 10 $< \pt <$ 15 GeV/$c$ an open symbol is used to highlight the usage of pp reference from the extrapolation approach. The statistical and systematic uncertainties are indicated, respectively, by the vertical error bars and the open boxes around the data points. The filled boxes around unity show the global uncertainties. | 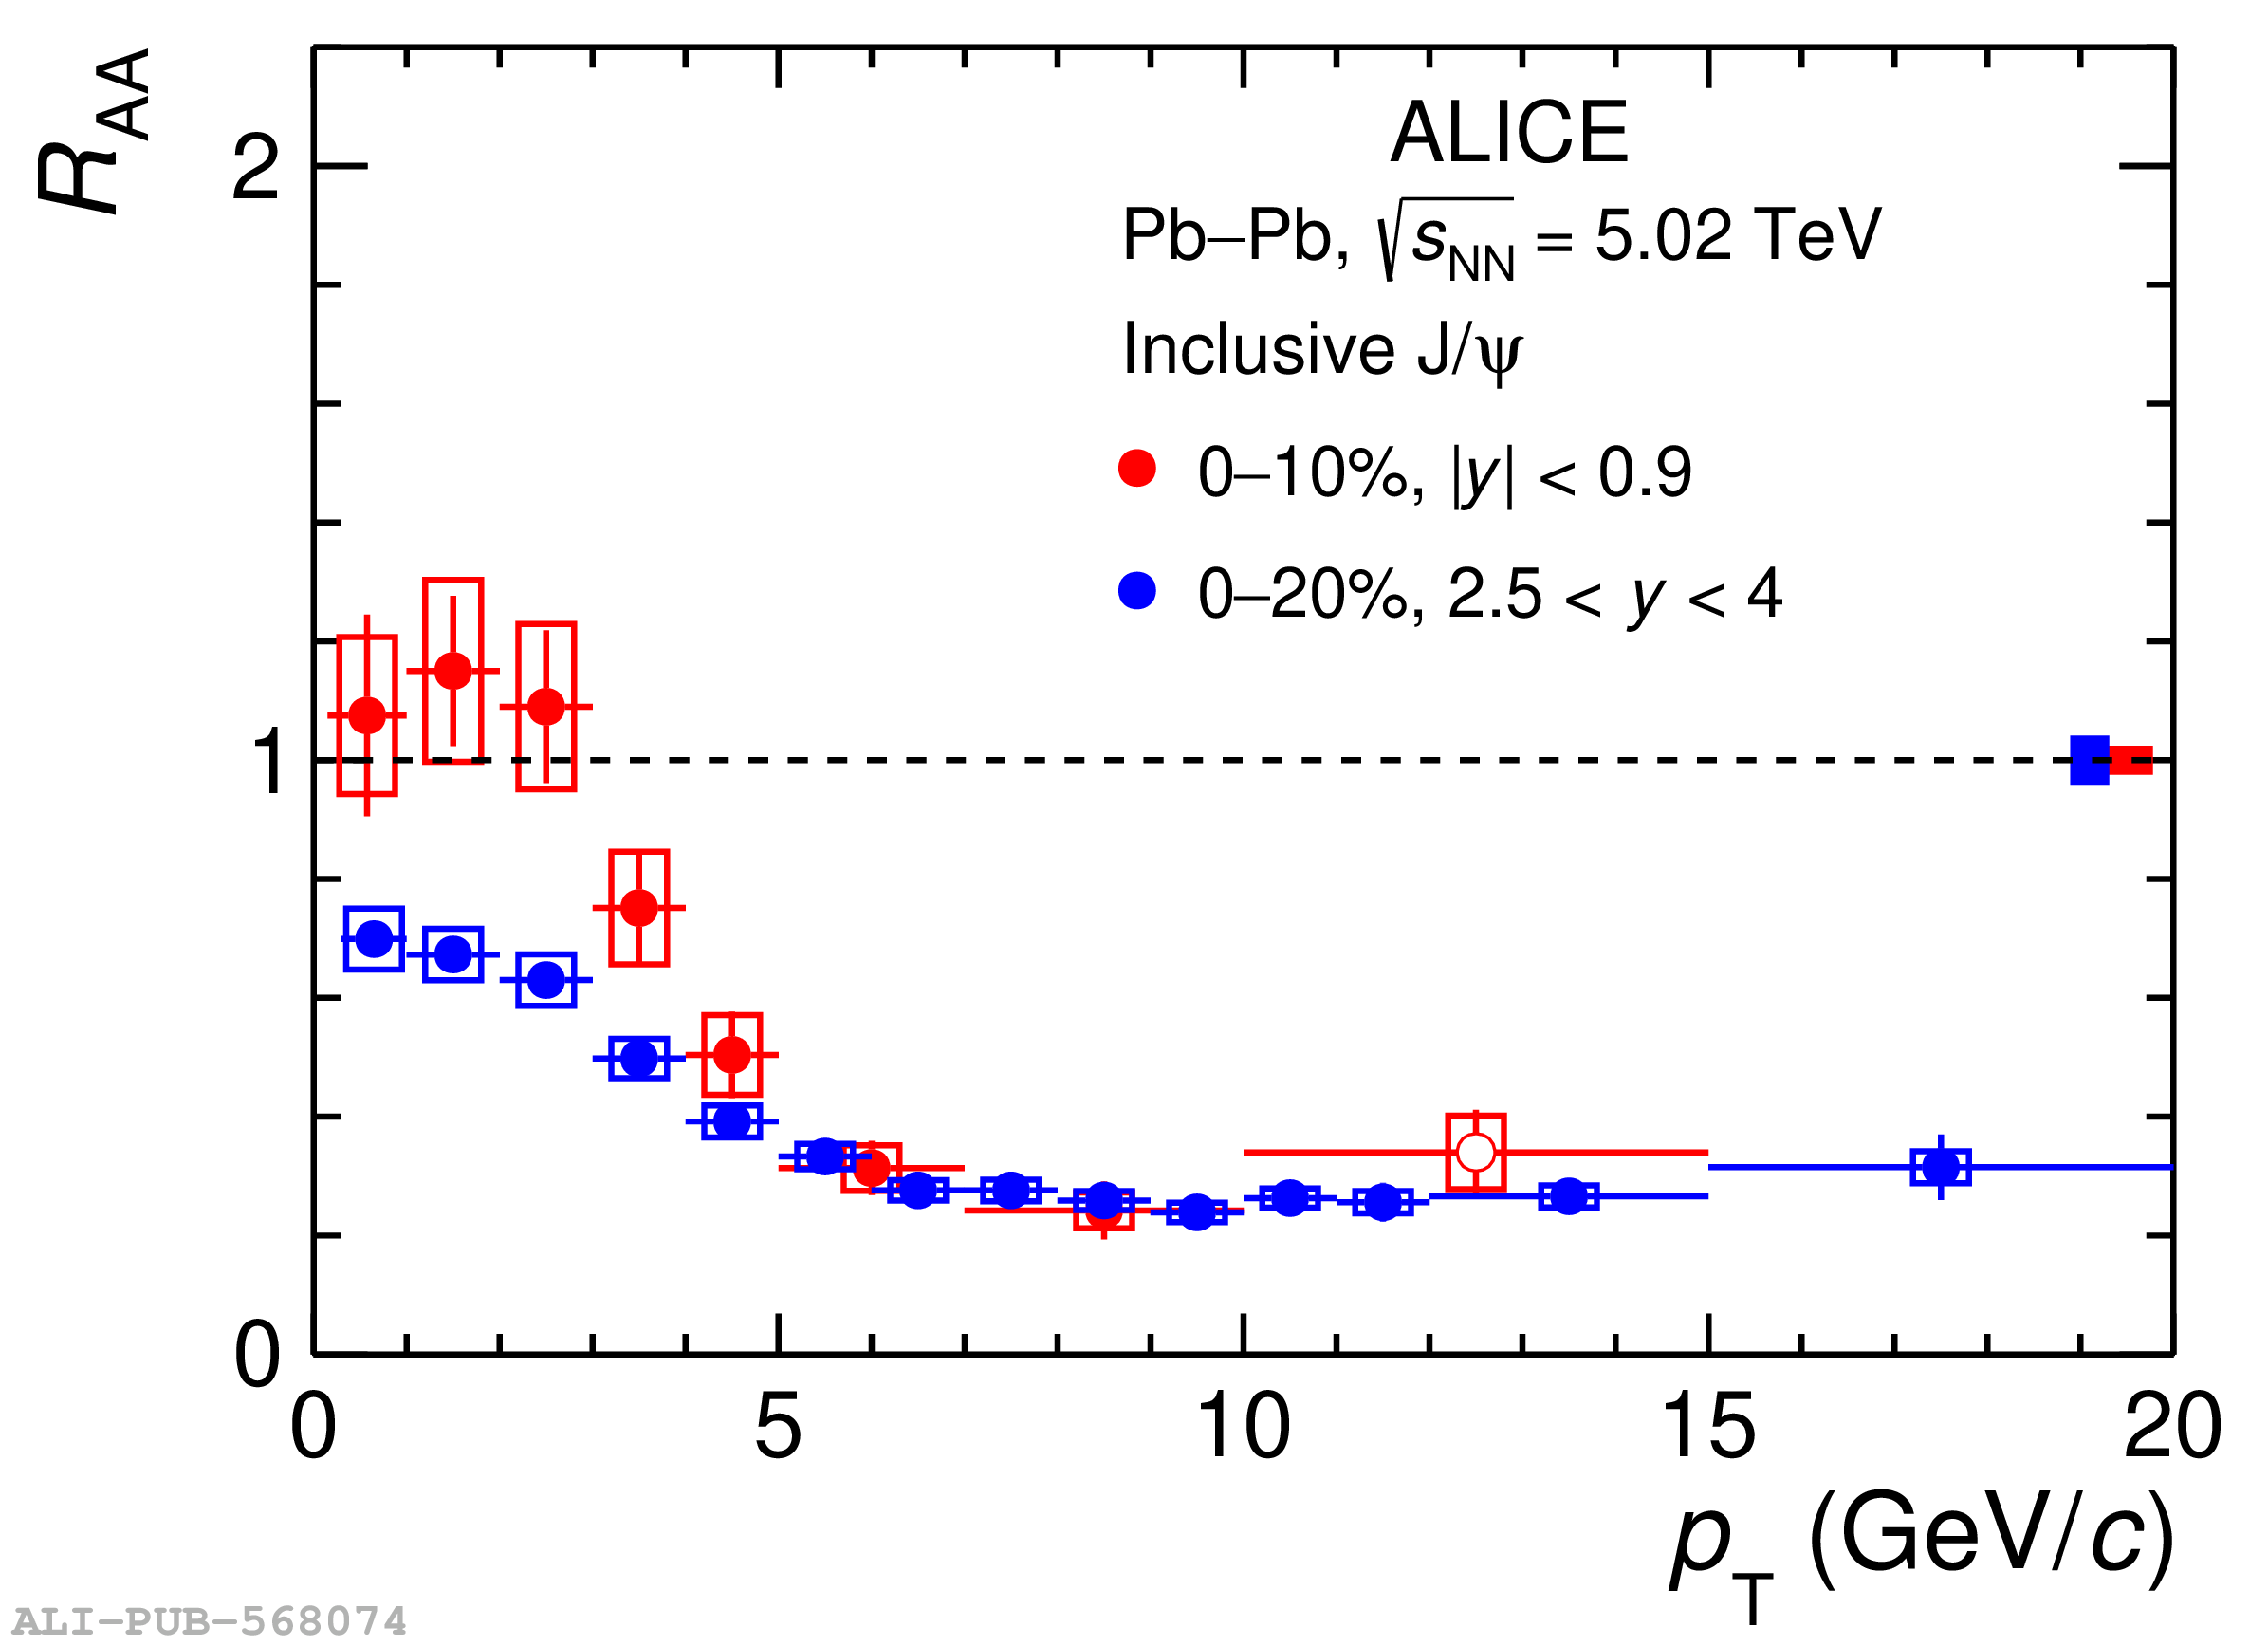 |

Figure 9
Transverse-momentum dependence of the $\jpsi$ $\RAA$ in Pb-Pb collisions at $\snn=5.02$ TeV at midrapidity in the 0$-$10% (left panel) and 30$-$50% (right panel) centrality intervals. For the data point in the $\pt$ bin 10 $< \pt <$ 15 GeV/$c$ an open symbol is used to highlight the usage of pp reference from the extrapolation approach. The data are compared with model calculations from Refs. [32, 33, 35,70]. |   |
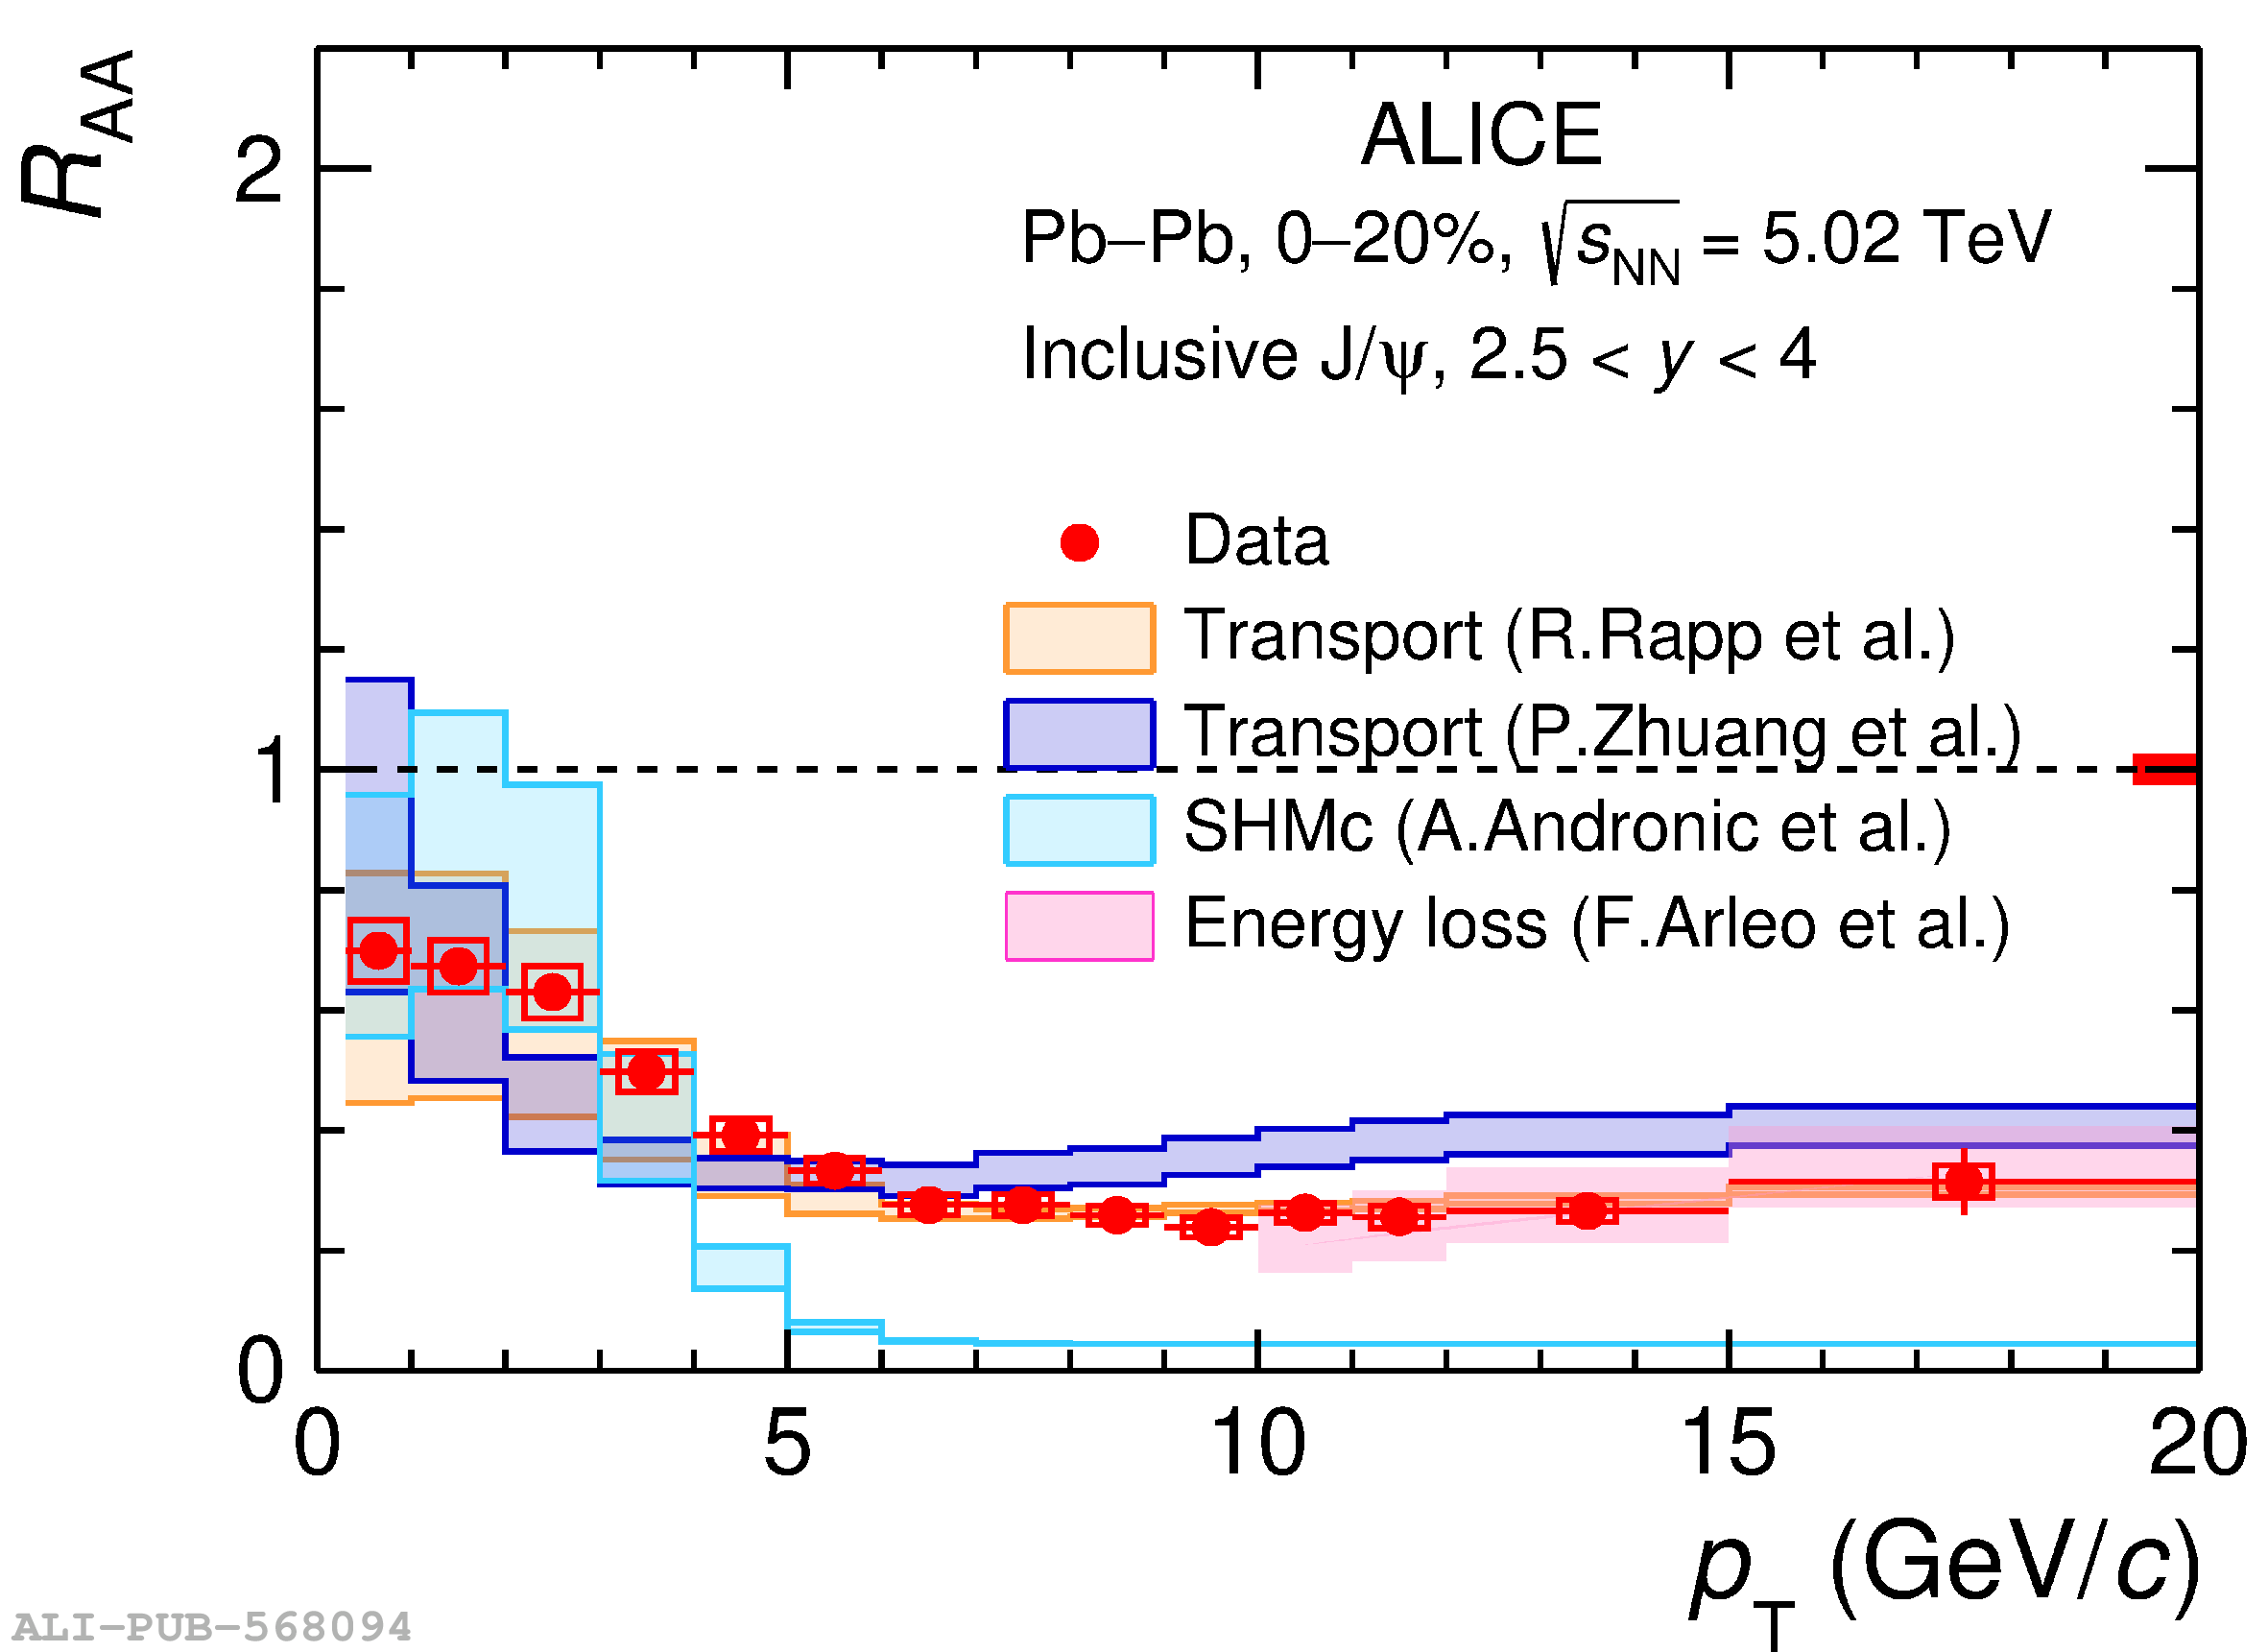
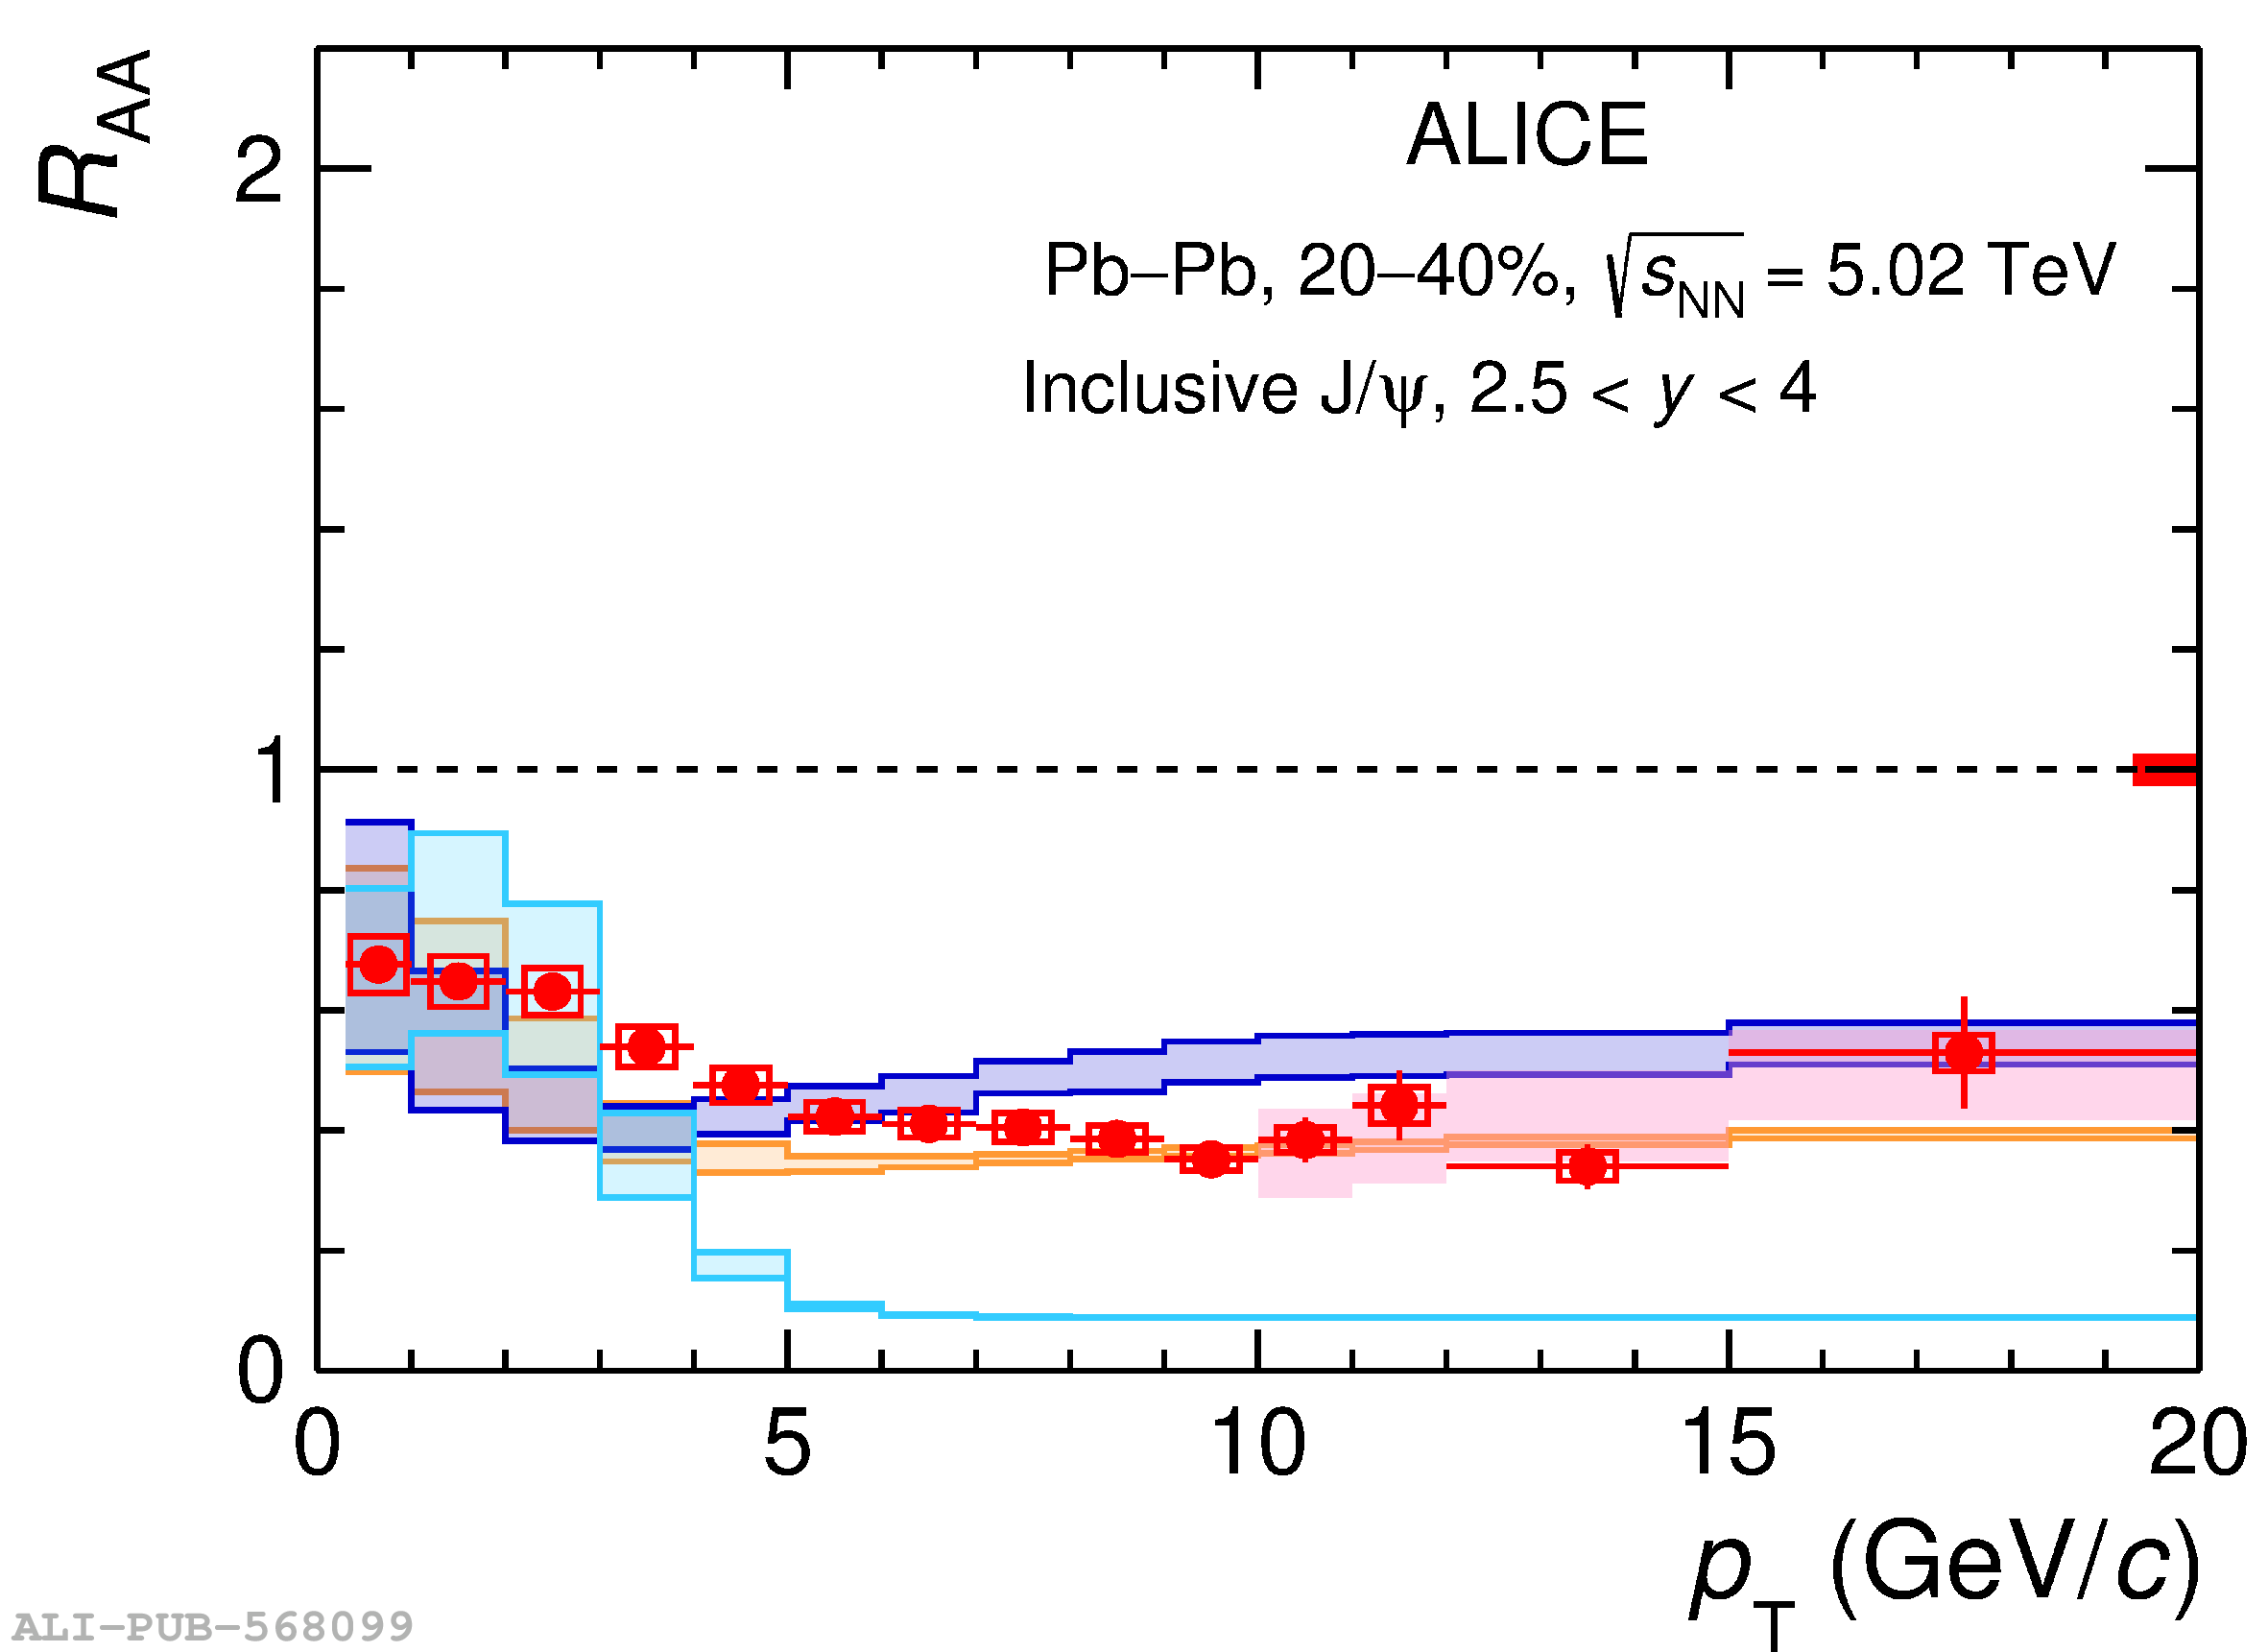
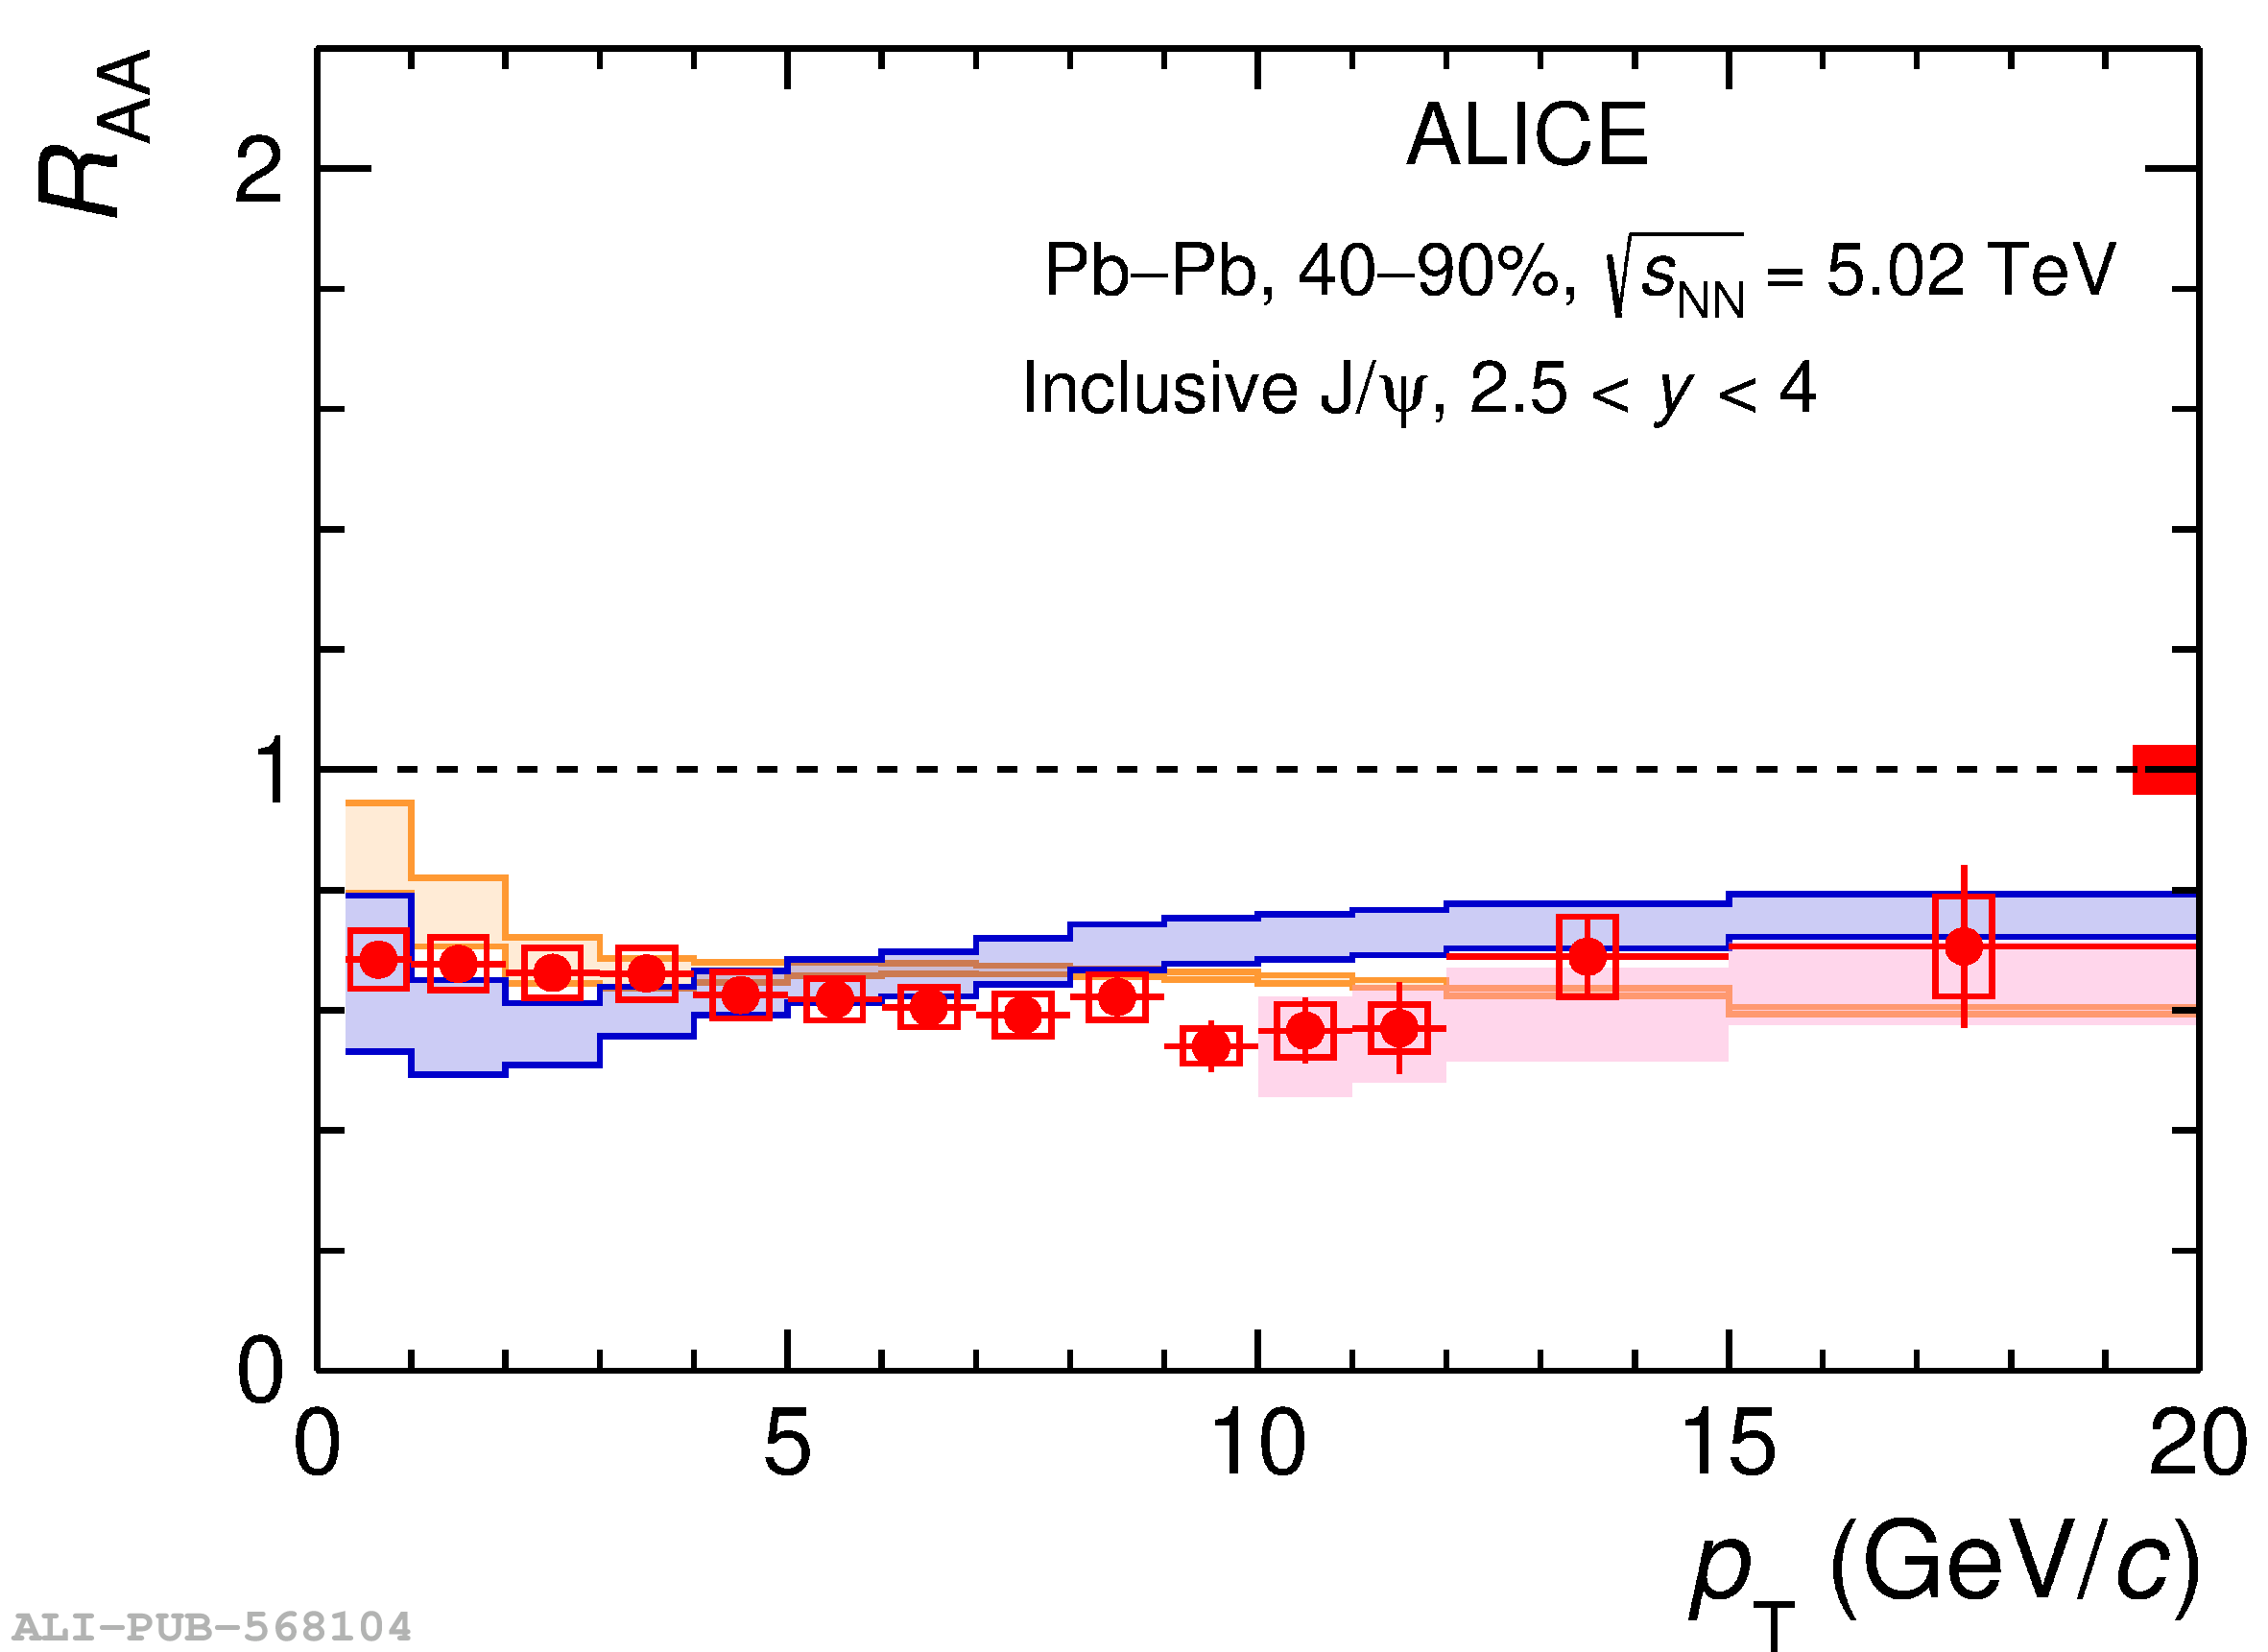
Figure 11
Left panel: Inclusive $\jpsi$ $\langle \pt \rangle$ as a function of the mean number of participants in Pb-Pb collisions at $\snn=5.02$ TeV at midrapidity. Right panel: Inclusive $\jpsi$ $r_{\rm AA}$ as a function of centrality at $\snn=5.02$ TeV and compared with measurements at lower energies from RHIC and the SPS. The statistical and systematic uncertainties are indicated, respectively, by the vertical error bars and the open boxes around the data points. The filled box around unity on the right panel shows the global uncertainty. | 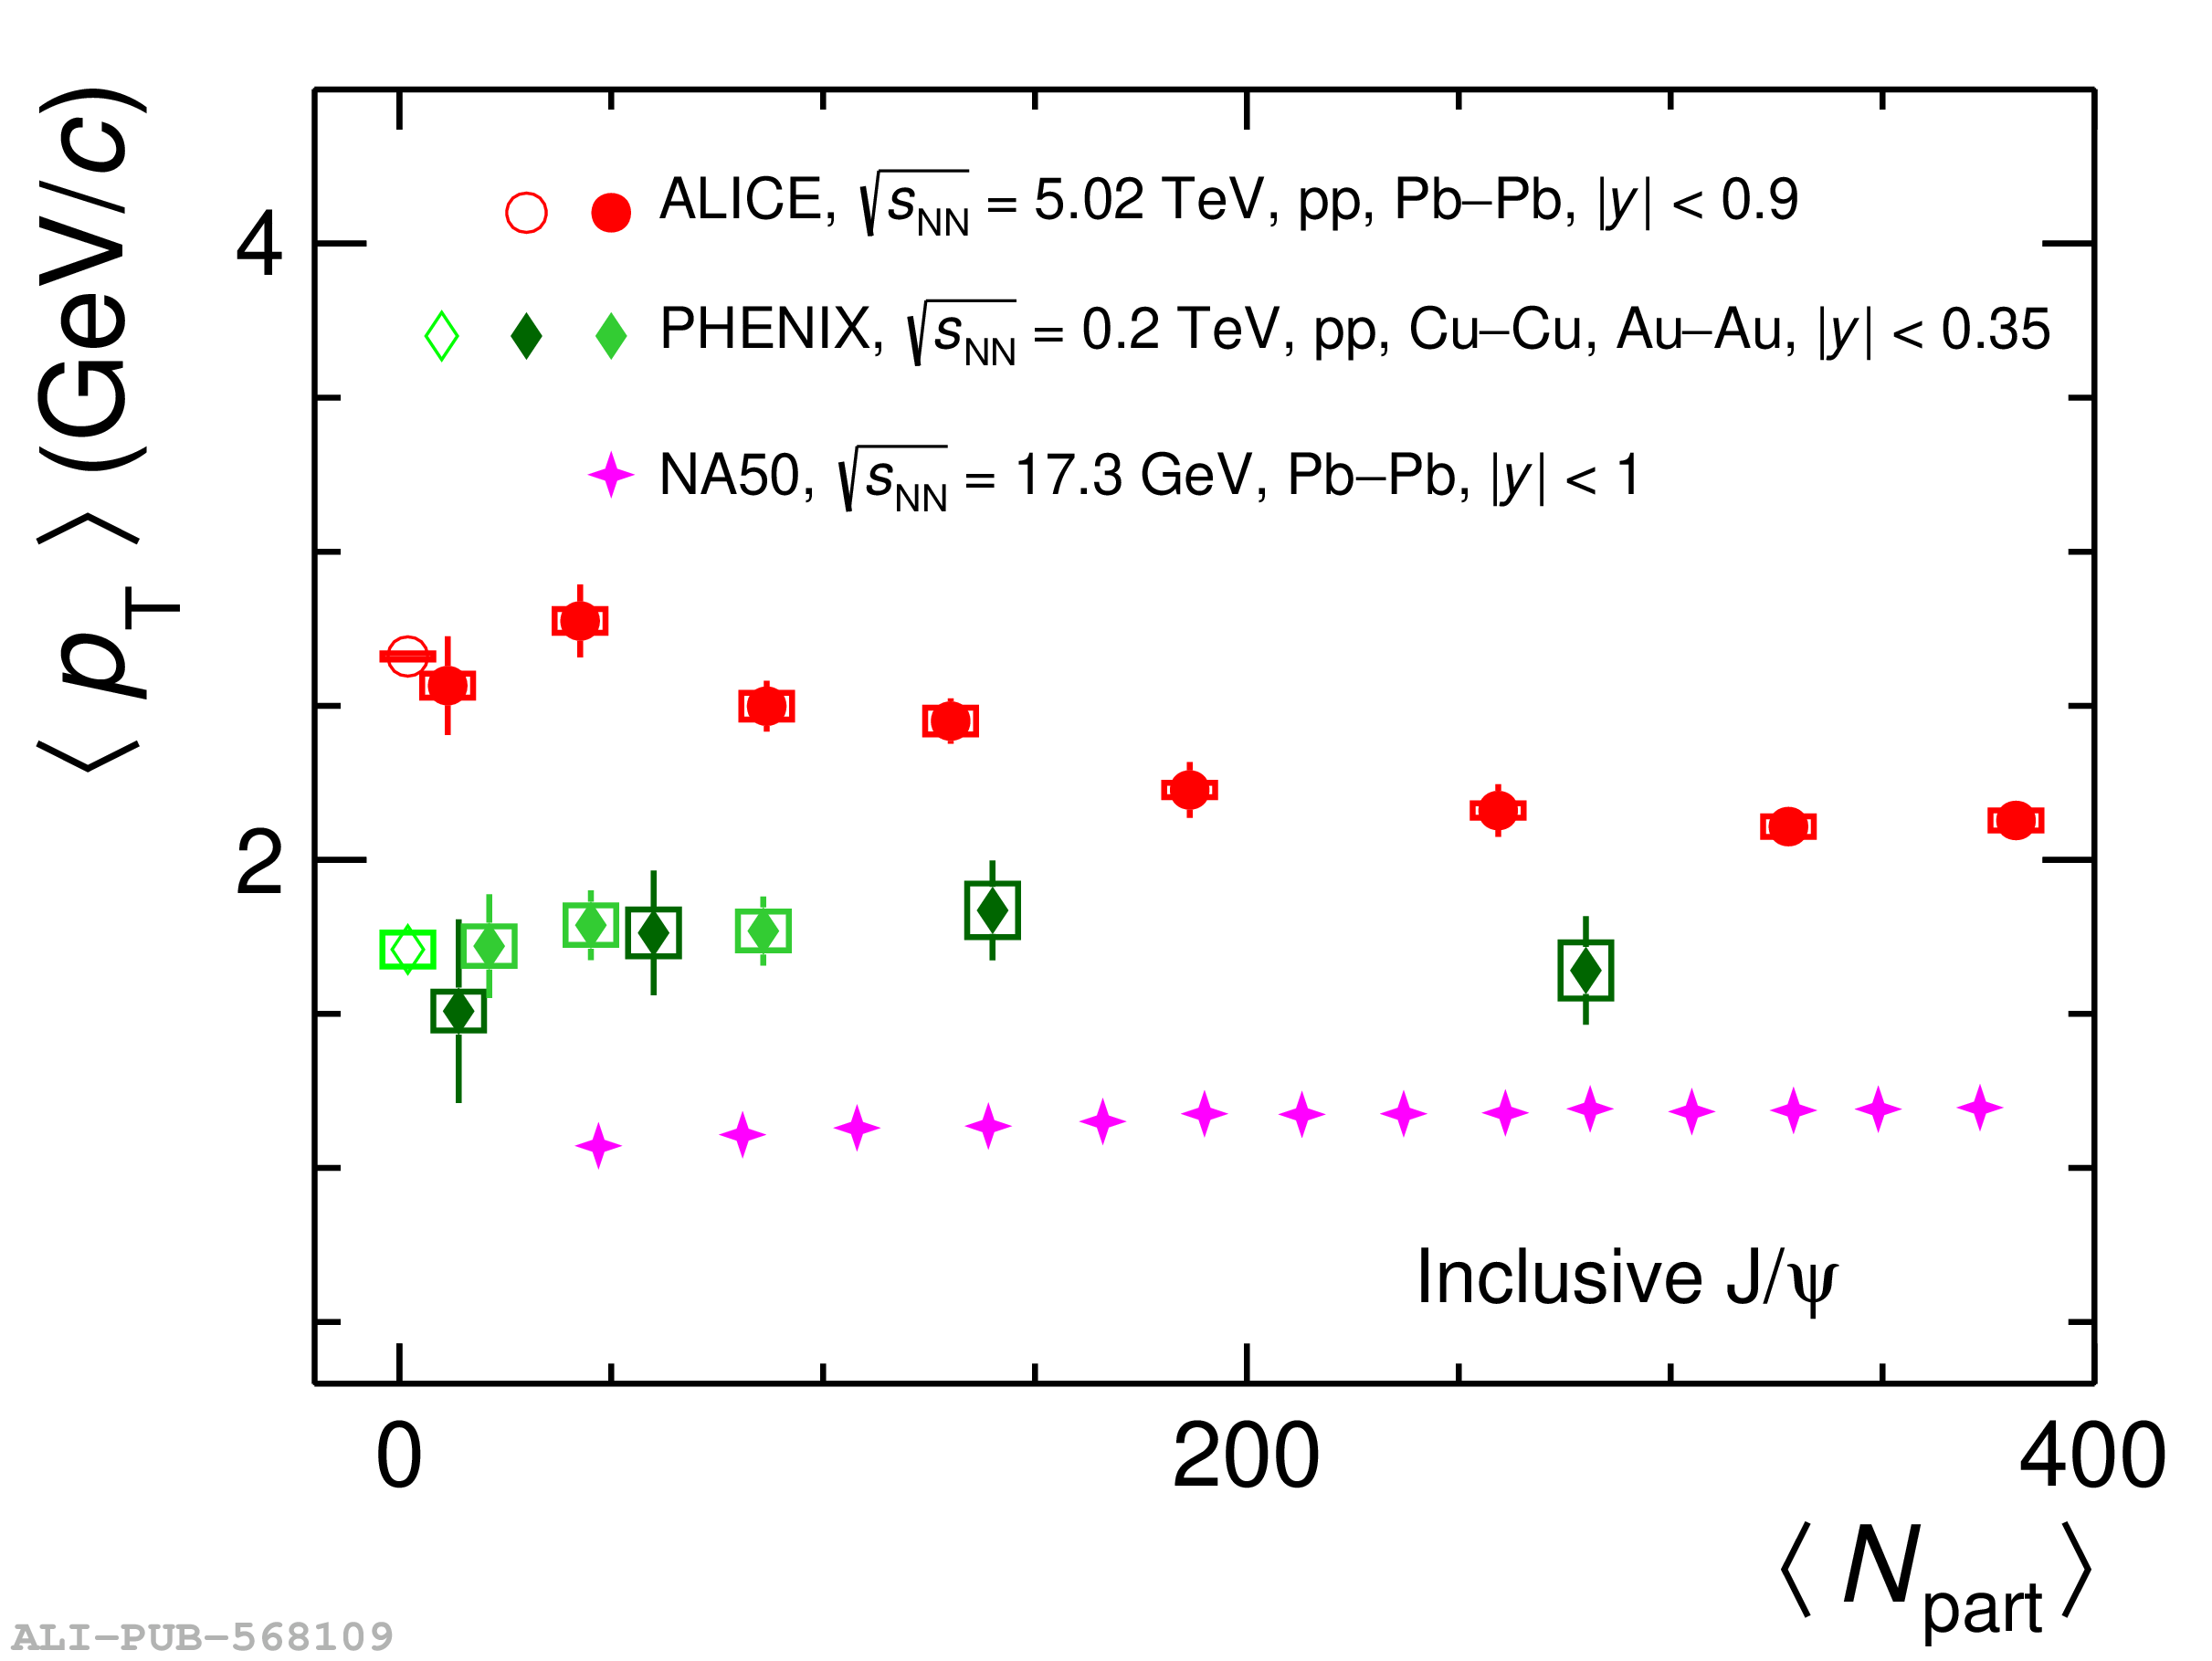 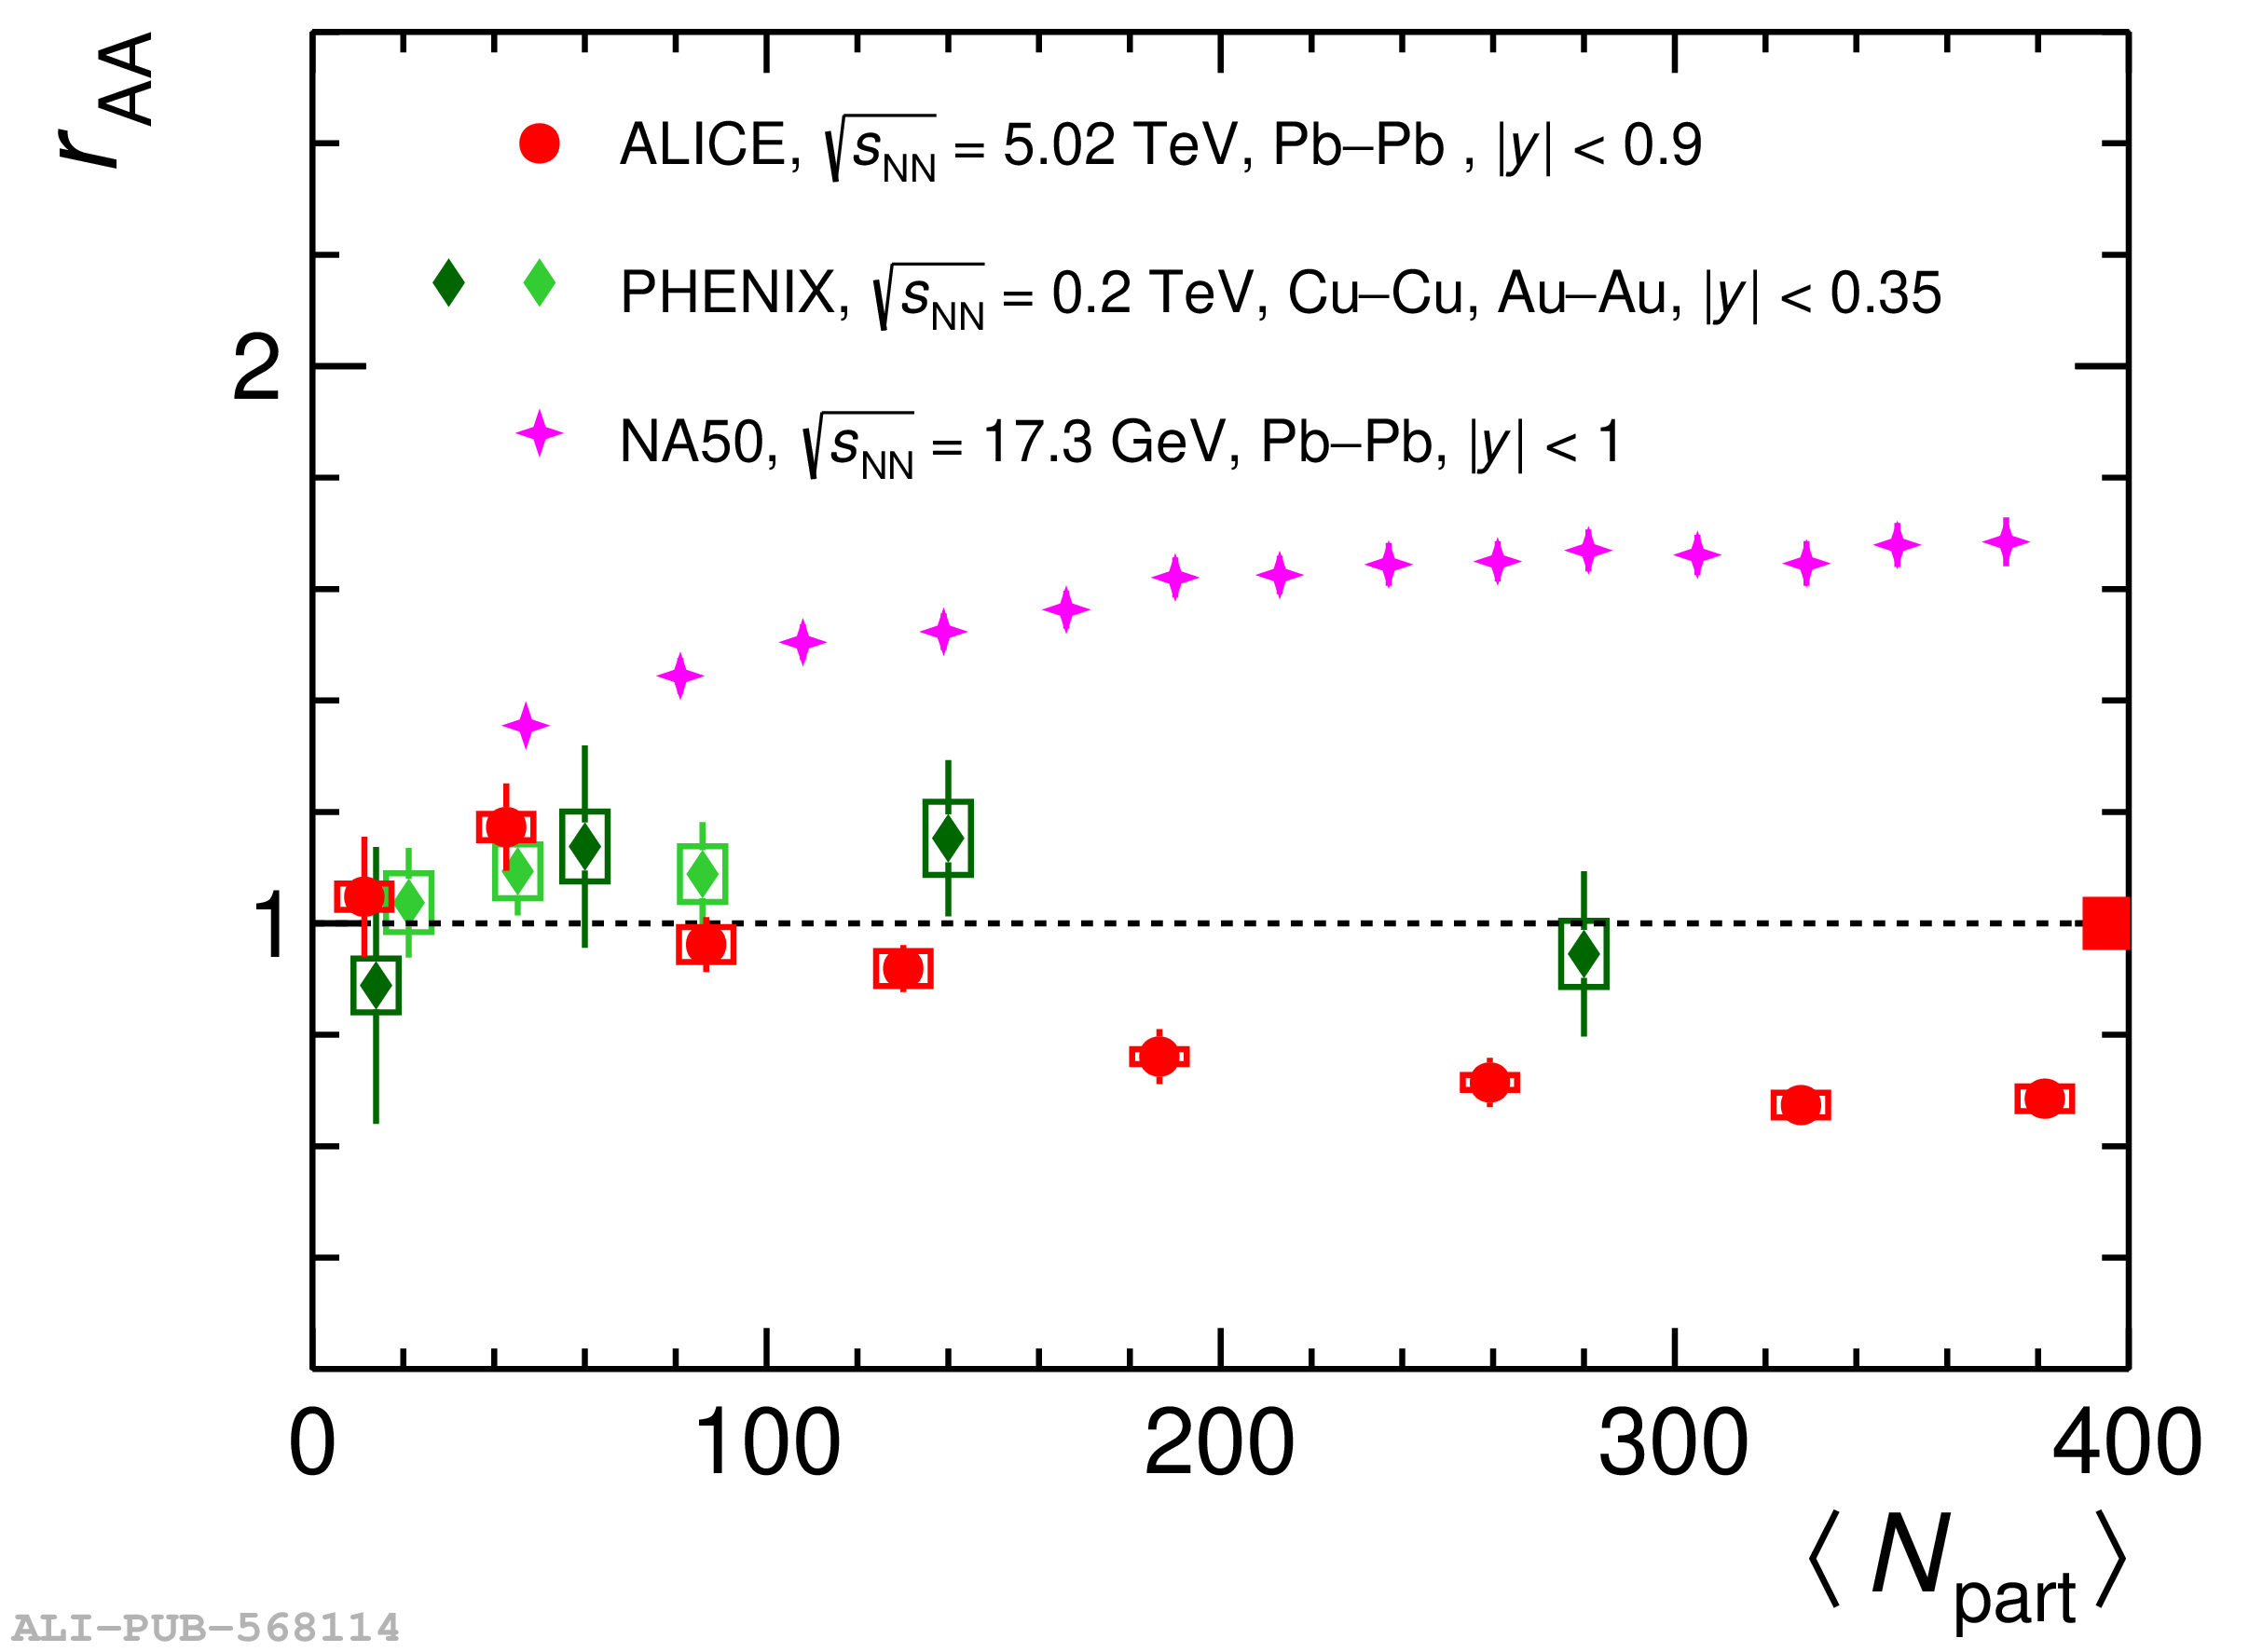 |
Figure 12
Inclusive $\jpsi$ $\langle \pt \rangle$ as a function of the mean number of participants in Pb-Pb collisions at $\snn=5.02$ TeV at midrapidity (left panel), and $\jpsi$ $r_{\rm AA}$ as a function of centrality (right panel) The results are compared with transport model calculations. | 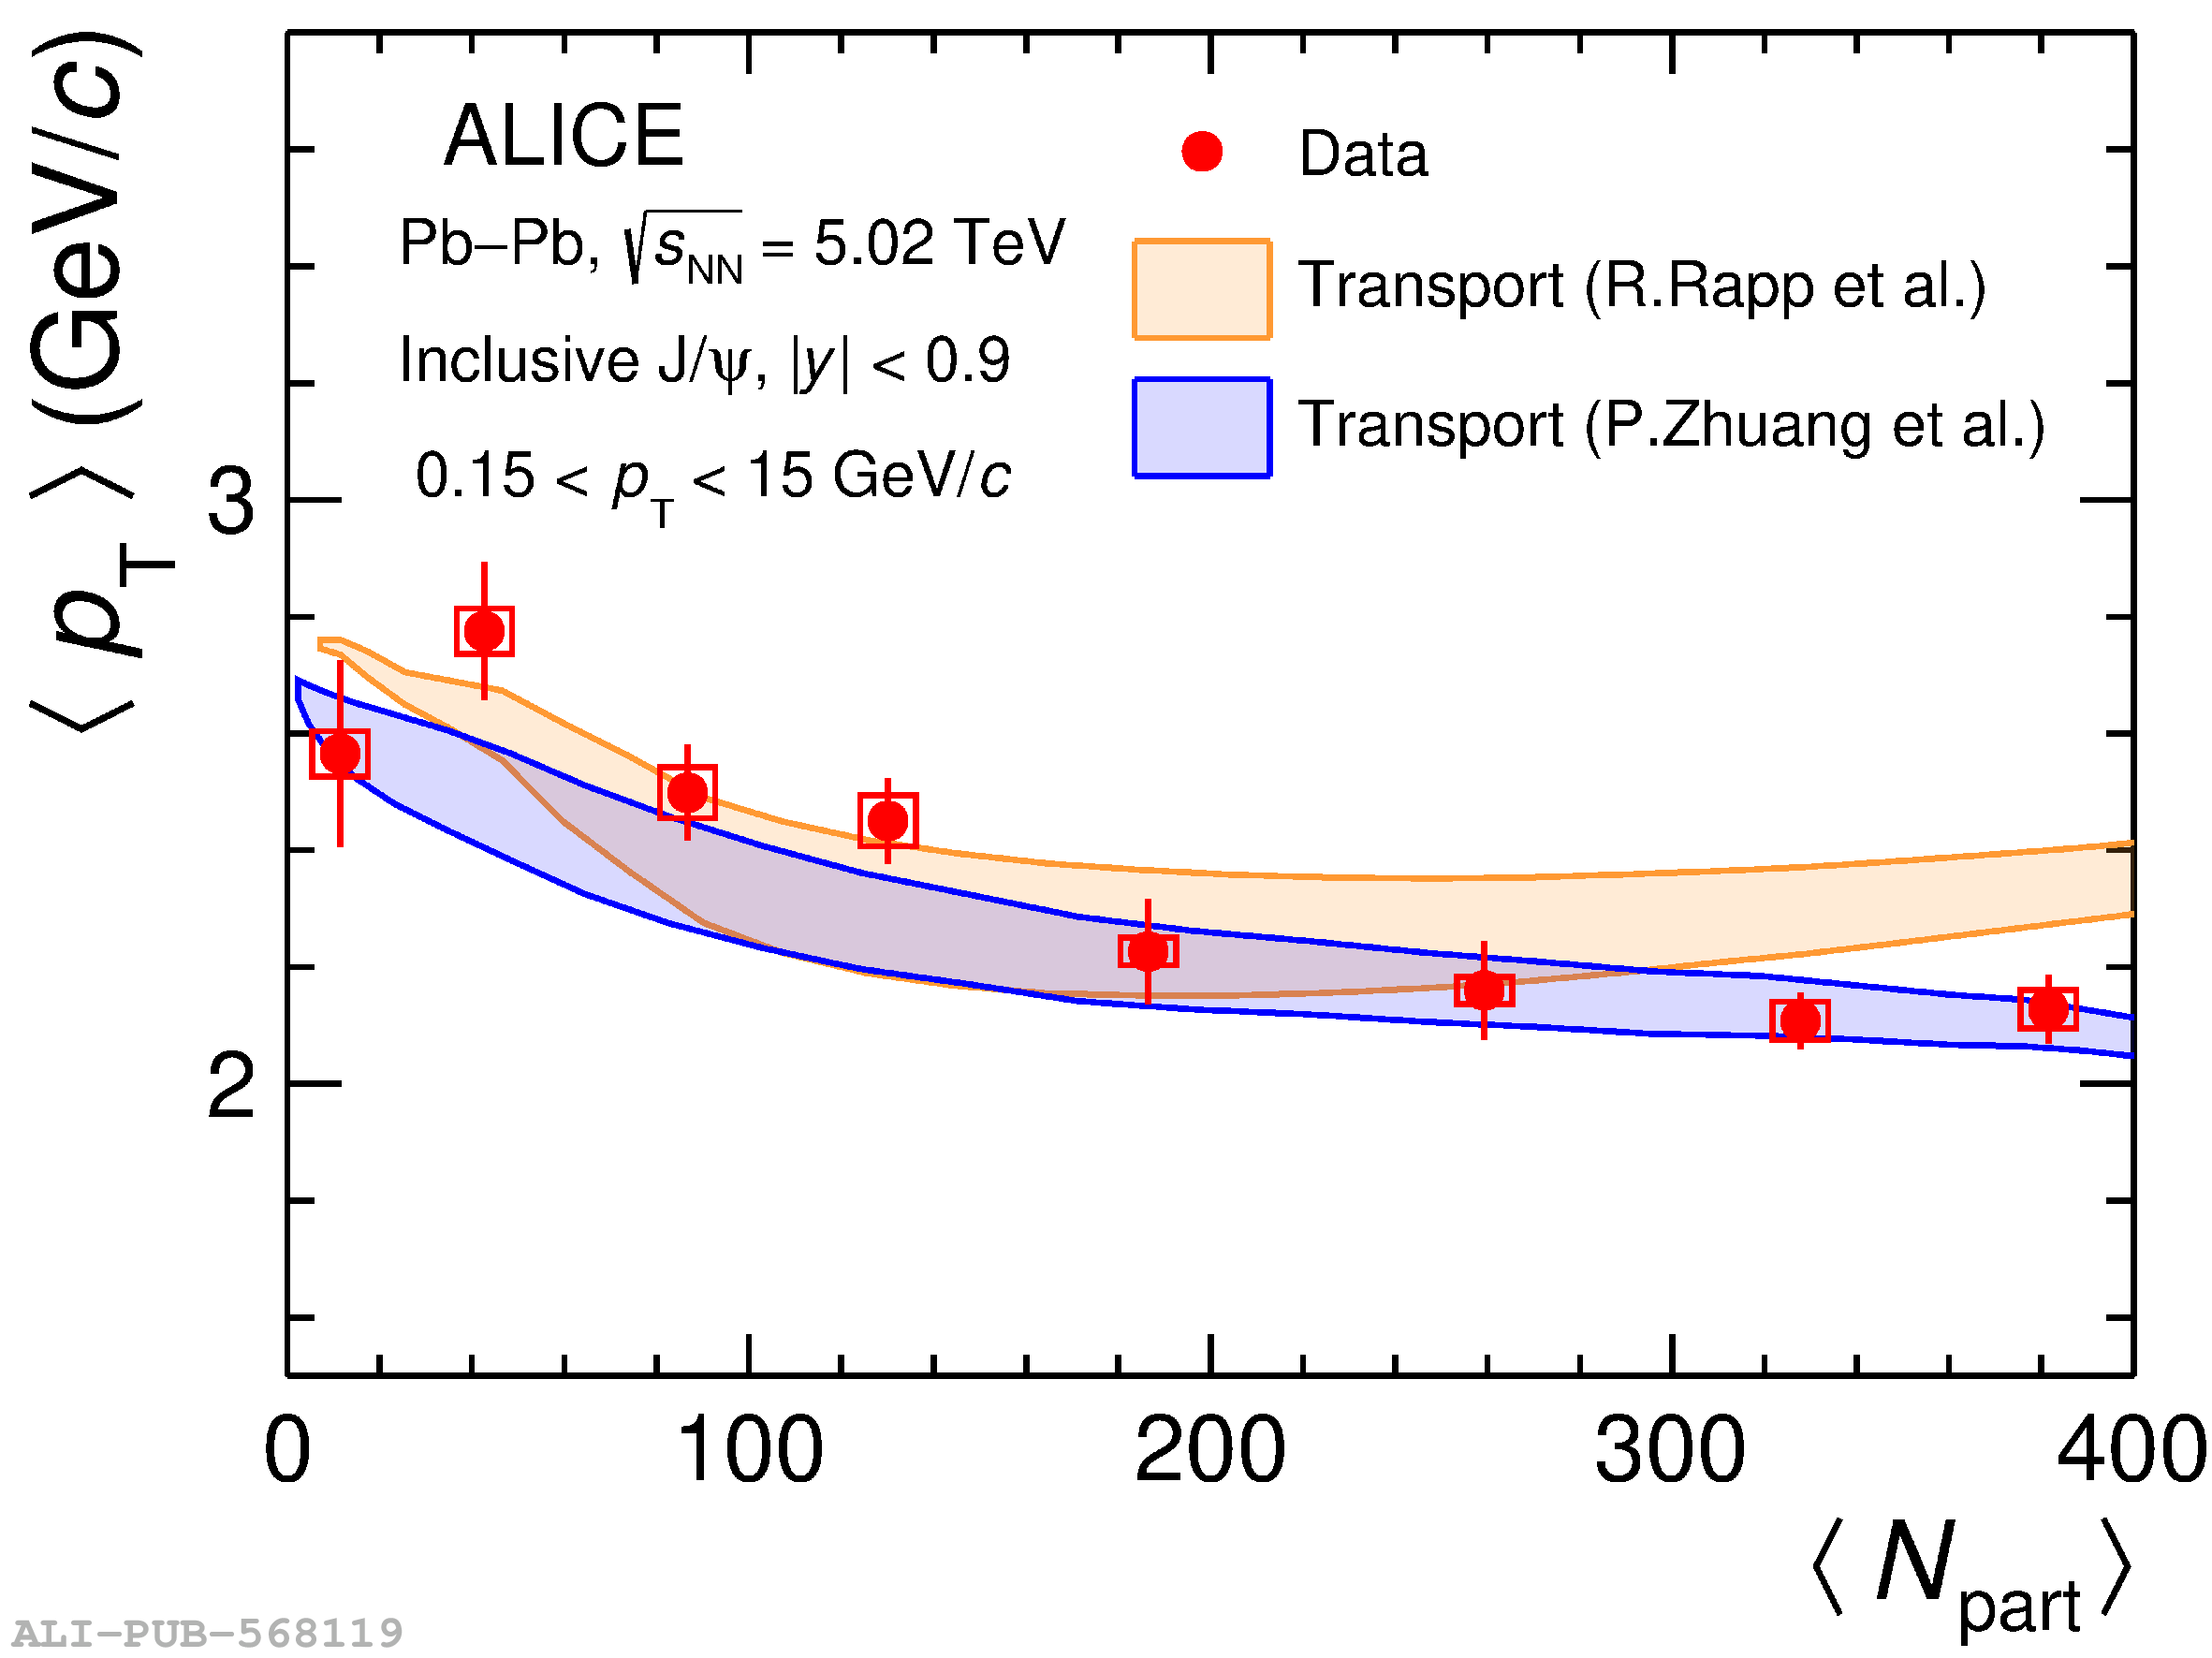 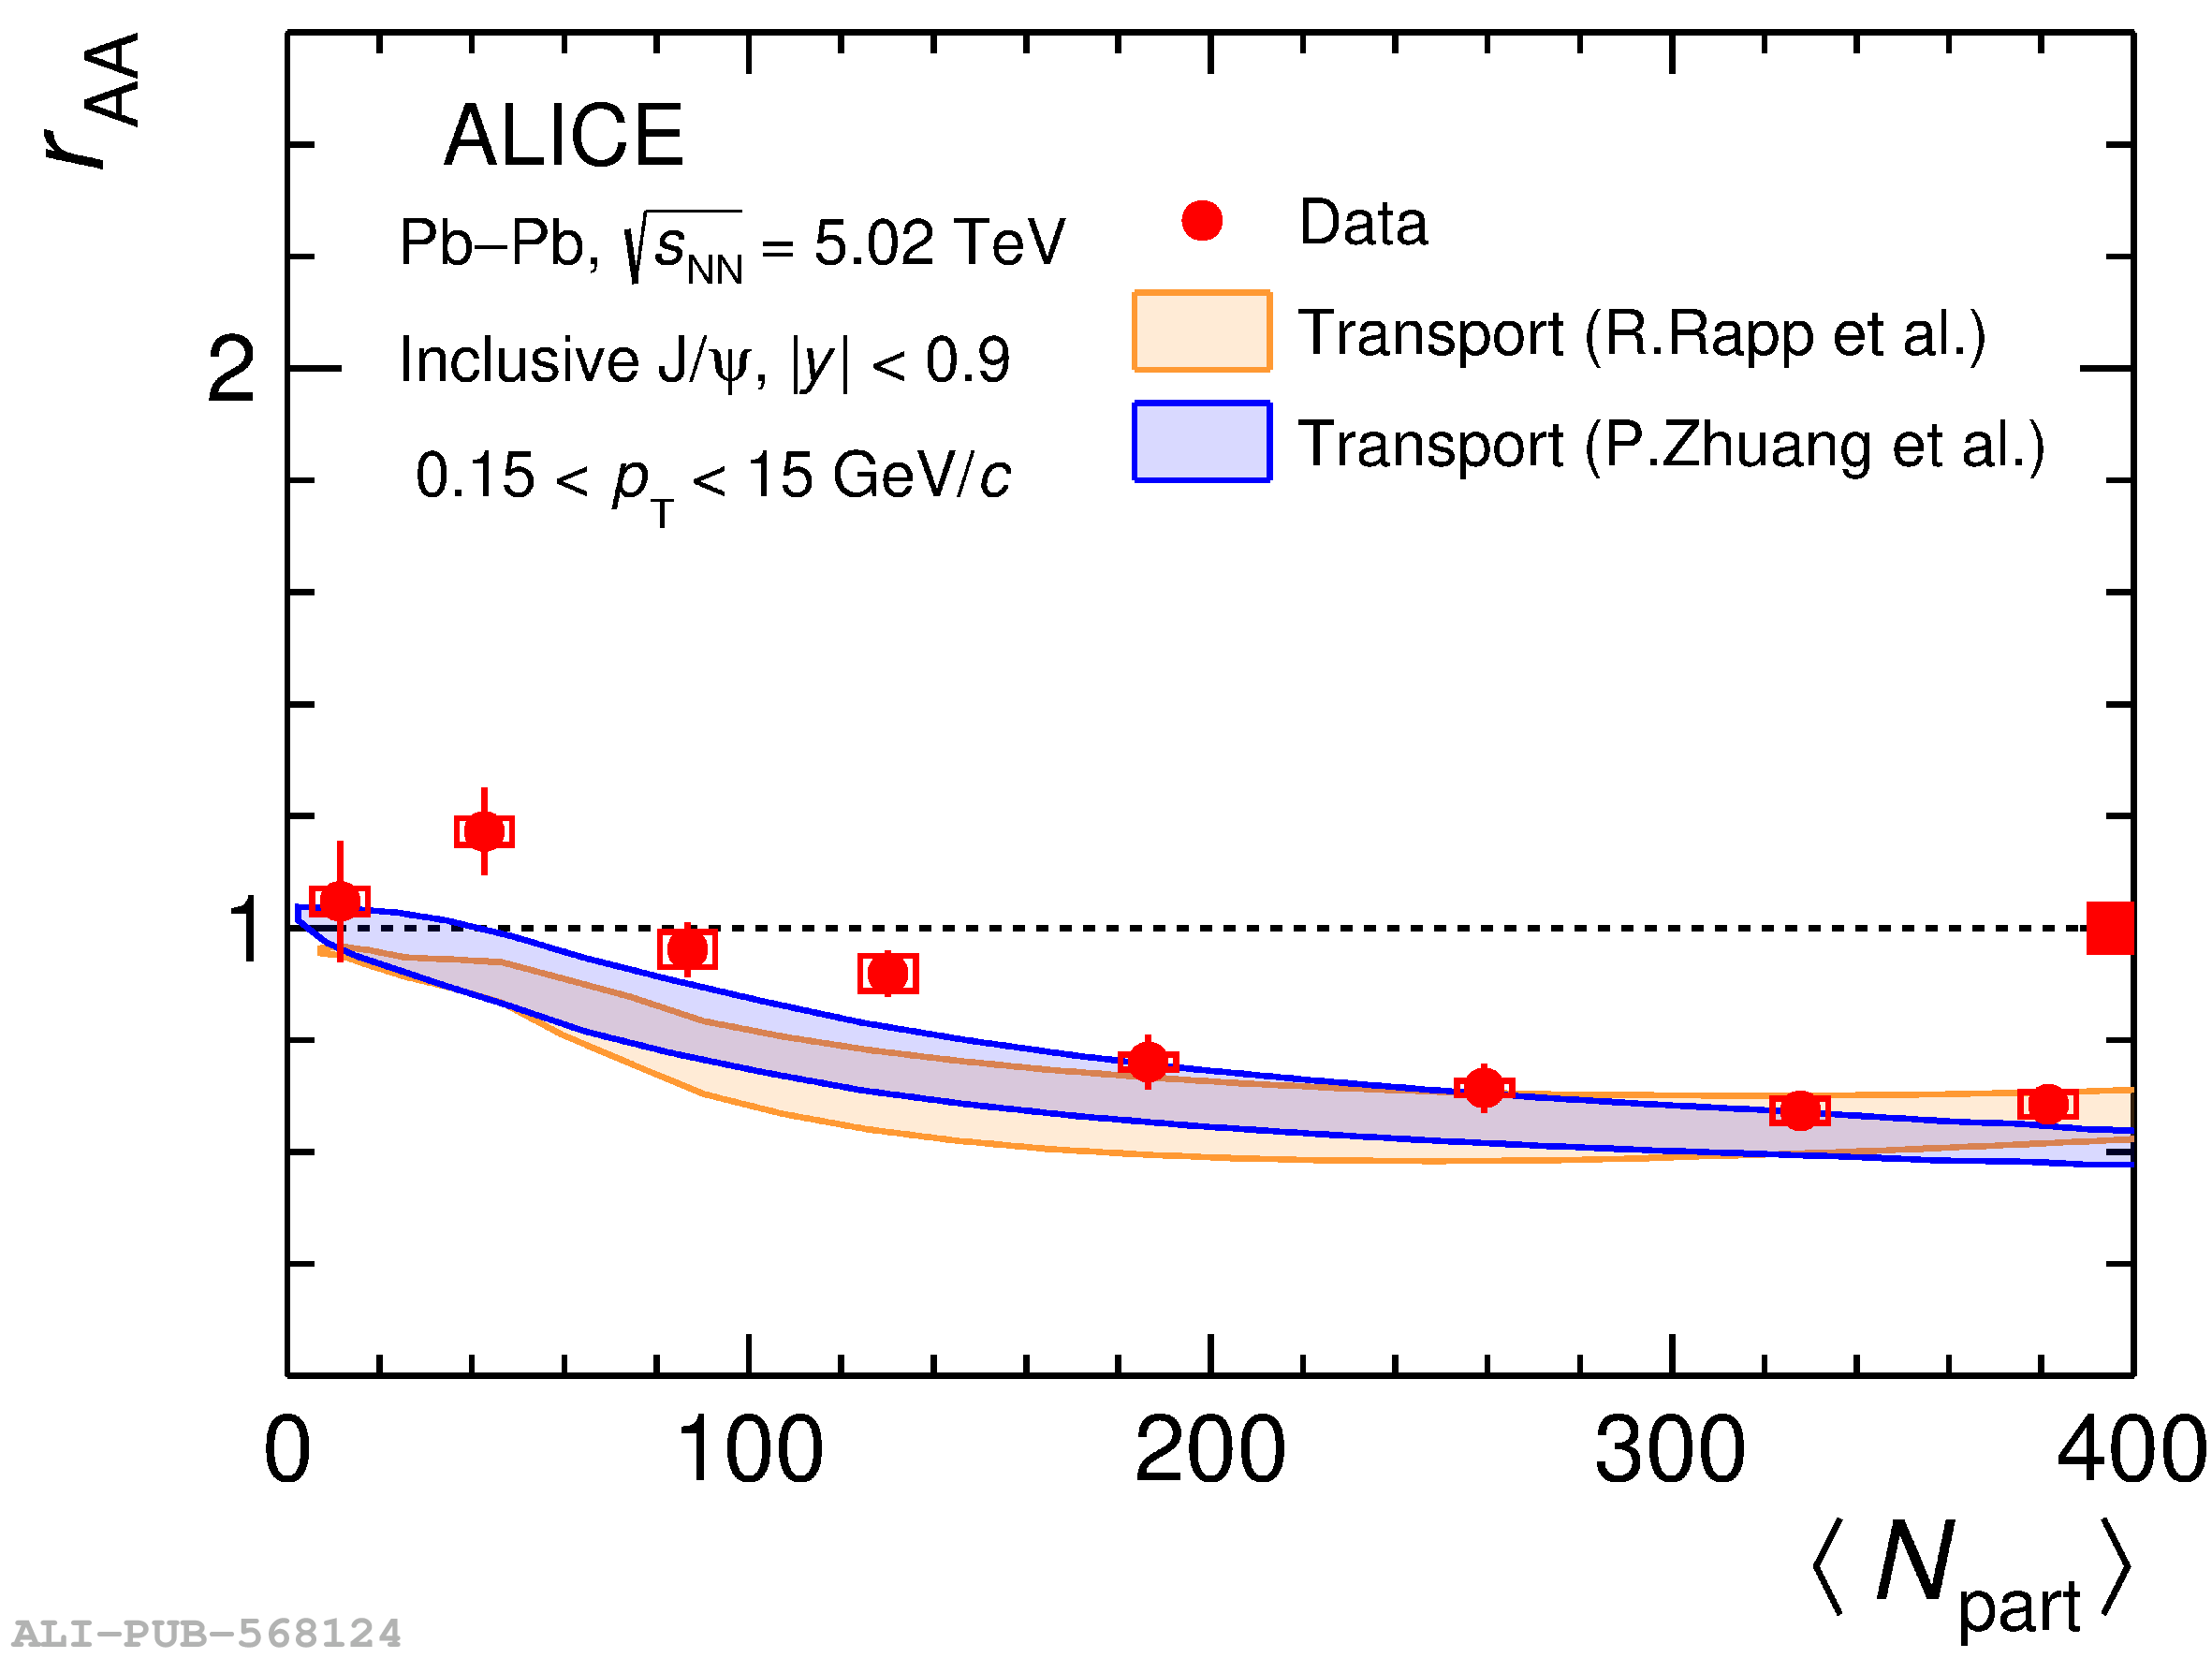 |
Figure 13
Inclusive $\jpsi$ to ${\rm D^{0}}$ yield ratio at $\snn=5.02$ TeV at midrapidity for the 0$-$10% and 30$-$50% centrality intervals. Vertical lines and open boxes represent the statistical and systematical uncertainties, respectively. The measurements are compared with SHMc model predictions. | 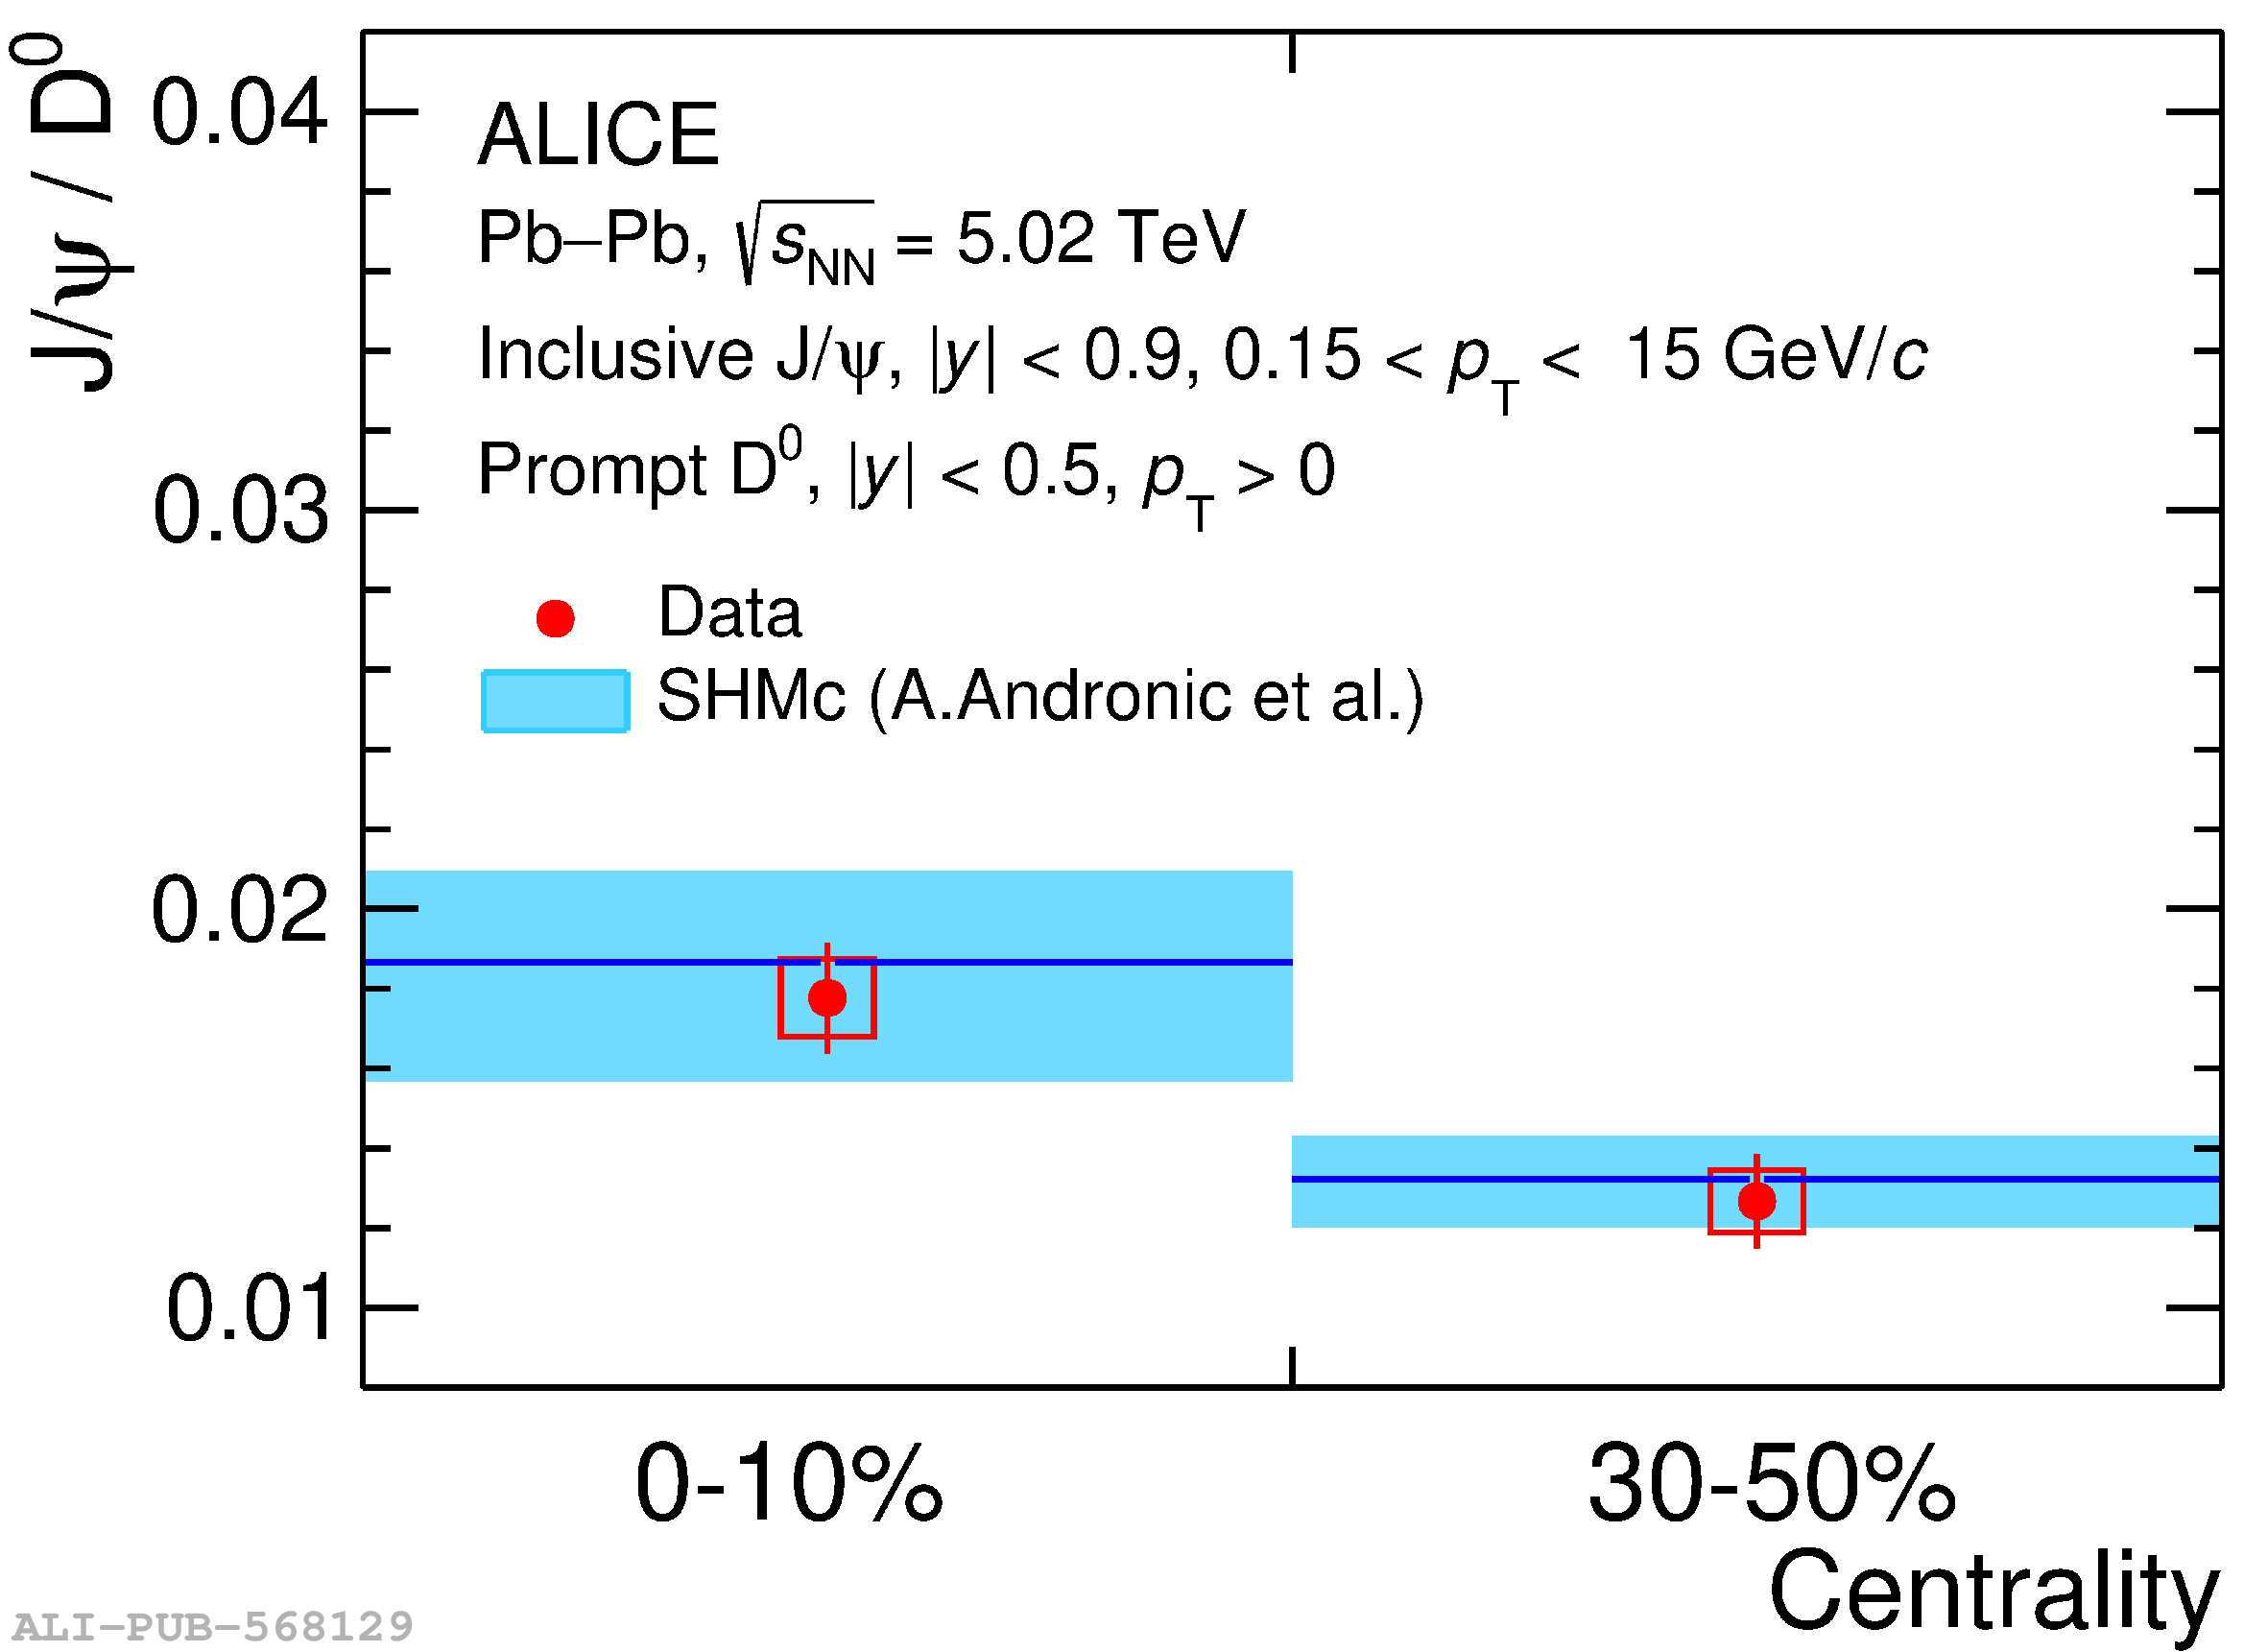 |