The measurement of $\Upsilon$(1S), $\Upsilon$(2S), and $\Upsilon$(3S) yields as a function of the charged-particle multiplicity density, $\textrm{d}N_{\textrm{ch}}/\textrm{d}\eta$, using the ALICE experiment at the LHC, is reported in pp collisions at $\sqrt{s} =$ 13 TeV. The $\Upsilon$ meson yields are measured at forward rapidity ($2.5 <~ y <~ 4$) in the dimuon decay channel, whereas the charged-particle multiplicity is defined at central rapidity ($|\eta| <~ 1$). Both quantities are divided by their average value in minimum bias events to compute the self-normalized quantities. The increase of the self-normalized $\Upsilon$(1S), $\Upsilon$(2S), and $\Upsilon$(3S) yields is found to be compatible with a linear scaling with the self-normalized $\textrm{d}N_{\textrm{ch}}/\textrm{d}\eta$, within the uncertainties. The self-normalized yield ratios of excited-to-ground $\Upsilon$ states are compatible with unity within uncertainties. Similarly, the measured double ratio of the self-normalized $\Upsilon$(1S) to the self-normalized J/$\psi$ yields, both measured at forward rapidity, is compatible with unity for self-normalized charged-particle multiplicities beyond one. The measurements are compared with theoretical predictions incorporating initial or final state effects.
Nucl. Phys. B 1011 (2025) 116786
HEP Data
e-Print: arXiv:2209.04241 | PDF | inSPIRE
CERN-EP-2022-174
Figure group
Figure 1
Dimuon invariant mass distribution for low-multiplicity pp collisions, corresponding to the $N_{\mathrm {trk}}^{\mathrm {corr}}$ interval bin $[1, 8]$ (left) and for high-multiplicity pp collisions, corresponding to the $N_{\mathrm {trk}}^{\mathrm {corr}}$ interval bin $[42, 50]$ (right). The $\Upsilon$(1S) peak position and width are fixed to the values obtained in the multiplicity-integrated sample. Significances ($\mathrm{S/\sqrt{S+B}}$) are evaluated in a 3 standard deviation (3$\sigma$) window around the mean value of the peak. |   |
Figure 2
Self-normalized yield of $\Upsilon$(nS) states as a function of self-normalized charged-particle multiplicity, $p_{\rm{T}}$-integrated. The vertical error bars represent the statistical uncertainty on the $\Upsilon$ yields, while the systematic uncertainties on $\textrm{d}N_{\mathrm{\Upsilon}}/\textrm{d}y/\langle \textrm{d}N_{\mathrm{\Upsilon}}/\textrm{d}y\rangle$ and $\textrm{d}N_{\mathrm{ch}} / \textrm{d}\eta$ / $\langle \textrm{d}N_{\mathrm{ch}}/\textrm{d}\eta \rangle$ are depicted as boxes. The dashed line shown in the top panel represents a linear function with the slope equal to unity. |  |
Figure 3
Self-normalized yield of $\Upsilon$(nS) states as a function of self-normalized charged-particle multiplicity, $p_{\rm{T}}$-integrated, compared to 3-pomeron CGC approach , PYTHIA 8.2 and CPP . The vertical error bars represent the statistical uncertainty, while the systematic uncertainties are depicted as boxes The dashed line represents a linear function with the slope equal to unity. | 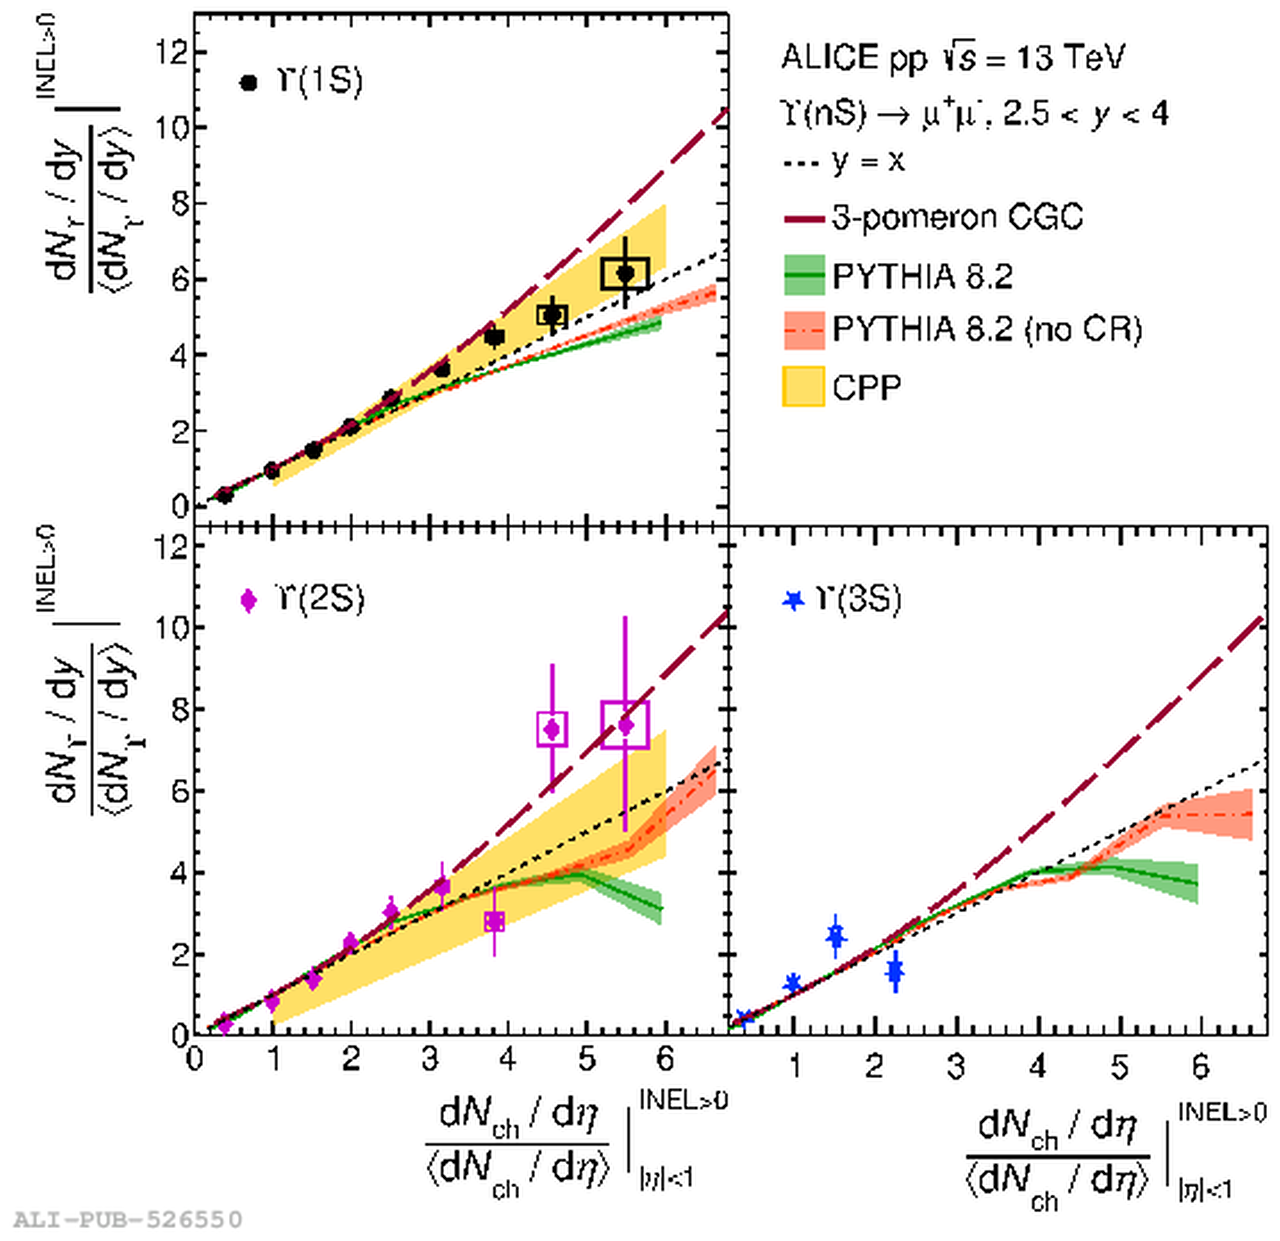 |
Figure 4
Top: Excited-to-ground state self-normalized yield ratio ($\Upsilon$(2S) over $\Upsilon$(1S)) as a function of self-normalized charged-particle multiplicity, compared to model predictions from 3-pomeron CGC approach , PYTHIA 8.2 , comovers , and CPP calculations. Bottom: Excited-to-ground state self-normalized yield ratio ($\Upsilon$(3S) over $\Upsilon$(1S)) as a function of self-normalized charged-particle multiplicity, compared to PYTHIA 8.2 and comovers predictions. The vertical error bars represent the statistical uncertainty, while the systematic uncertainties are depicted as boxes. |   |
Figure 5
Top: Self-normalized yield of $\Upsilon$ as a function of self-normalized charged-particle multiplicity, compared to inclusive J/$\psi$ measured in the forward rapidity region at $\s = 5.02$ TeV , $7$ TeV , and $13$ TeV , and to inclusive J/$\psi$ measured in the central rapidity region at $\s = 13$ TeV . Bottom: Self-normalized yield ratio of $\Upsilon$(1S)-to-J/$\psi$ as a function of self-normalized charged-particle multiplicity, compared to model computations from 3-pomeron CGC approach , PYTHIA 8.2 , comovers , and CPP The vertical error bars represent the statistical uncertainty, while the systematic uncertainties on are depicted as boxes. |   |