Examples of the fit to the D-meson average azimuthal-correlation function, for 5 < pDT < 8 GeV/c, passocT > 0.3 GeV/c in pp collisions (left), and for 8 < pDT < 16 GeV/c, 1 < passocT < 2 GeV/c in p–Pb collisions
(right). The statistical uncertainties are shown as vertical error bars. The fit function described in Eq. 3 is shown as a red solid curve. Its different terms are shown separately: near-side generalised Gaussian function, away-side Gaussian function, and baseline constant term. The scale uncertainty (see Sec. 4) is also reported for completeness. | 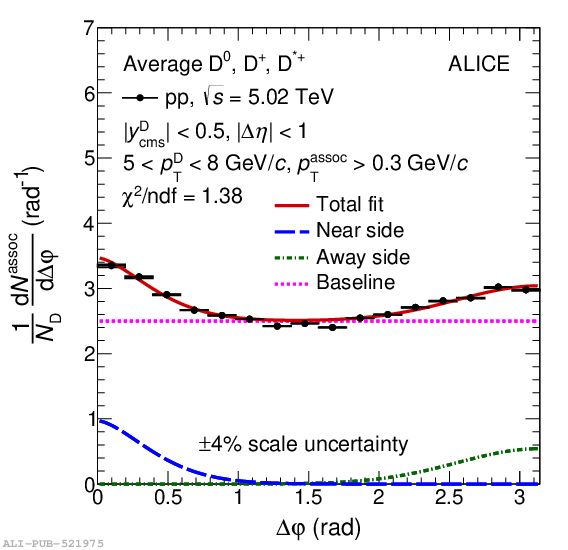  |