This article presents the first measurement of the interaction between charm hadrons and nucleons. The two-particle momentum correlations of $\mathrm{pD^-}$ and $\mathrm{\overline{p}D}^+$ pairs are measured by the ALICE Collaboration in high-multiplicity pp collisions at $\sqrt{s} = 13~\mathrm{TeV}$. The data are compatible with the Coulomb-only interaction hypothesis within (1.1-1.5)$\sigma$. The level of agreement slightly improves if an attractive nucleon(N)$\overline{\mathrm{D}}$ strong interaction is considered, in contrast to most model predictions which suggest an overall repulsive interaction. This measurement allows for the first time an estimation of the 68% confidence level interval for the isospin $\mathrm{I}=0$ inverse scattering length of the $\mathrm{N\overline{D}}$ state ${f_{0,~\mathrm{I}=0}^{-1} \in [-0.4,0.9]~\mathrm{fm^{-1}}}$, assuming negligible interaction for the isospin $\mathrm{I}=1$ channel.
Phys. Rev. D 106 (2022) 052010
HEP Data
e-Print: arXiv:2201.05352 | PDF | inSPIRE
CERN-EP-2022-006
Figure group
Figure 1
Left: invariant mass distributions of \Dplusminus candidates in the $2<\pT<3 \gev/c$ interval. The green solid line shows the total fit function and the gray dotted line the combinatorial background. The contributions of \Dplusminus mesons originating from charm hadronisation and beauty-hadron decays are obtained with the method relying on the definition of different selection criteria, as explained in the text. Right: example of raw-yield distribution as a function of the BDT-based selection employed in the procedure adopted for the determination of the fraction of \Dplusminus originating from beauty-hadron decays for the $2<\pT<3 \gev/c$ interval. | 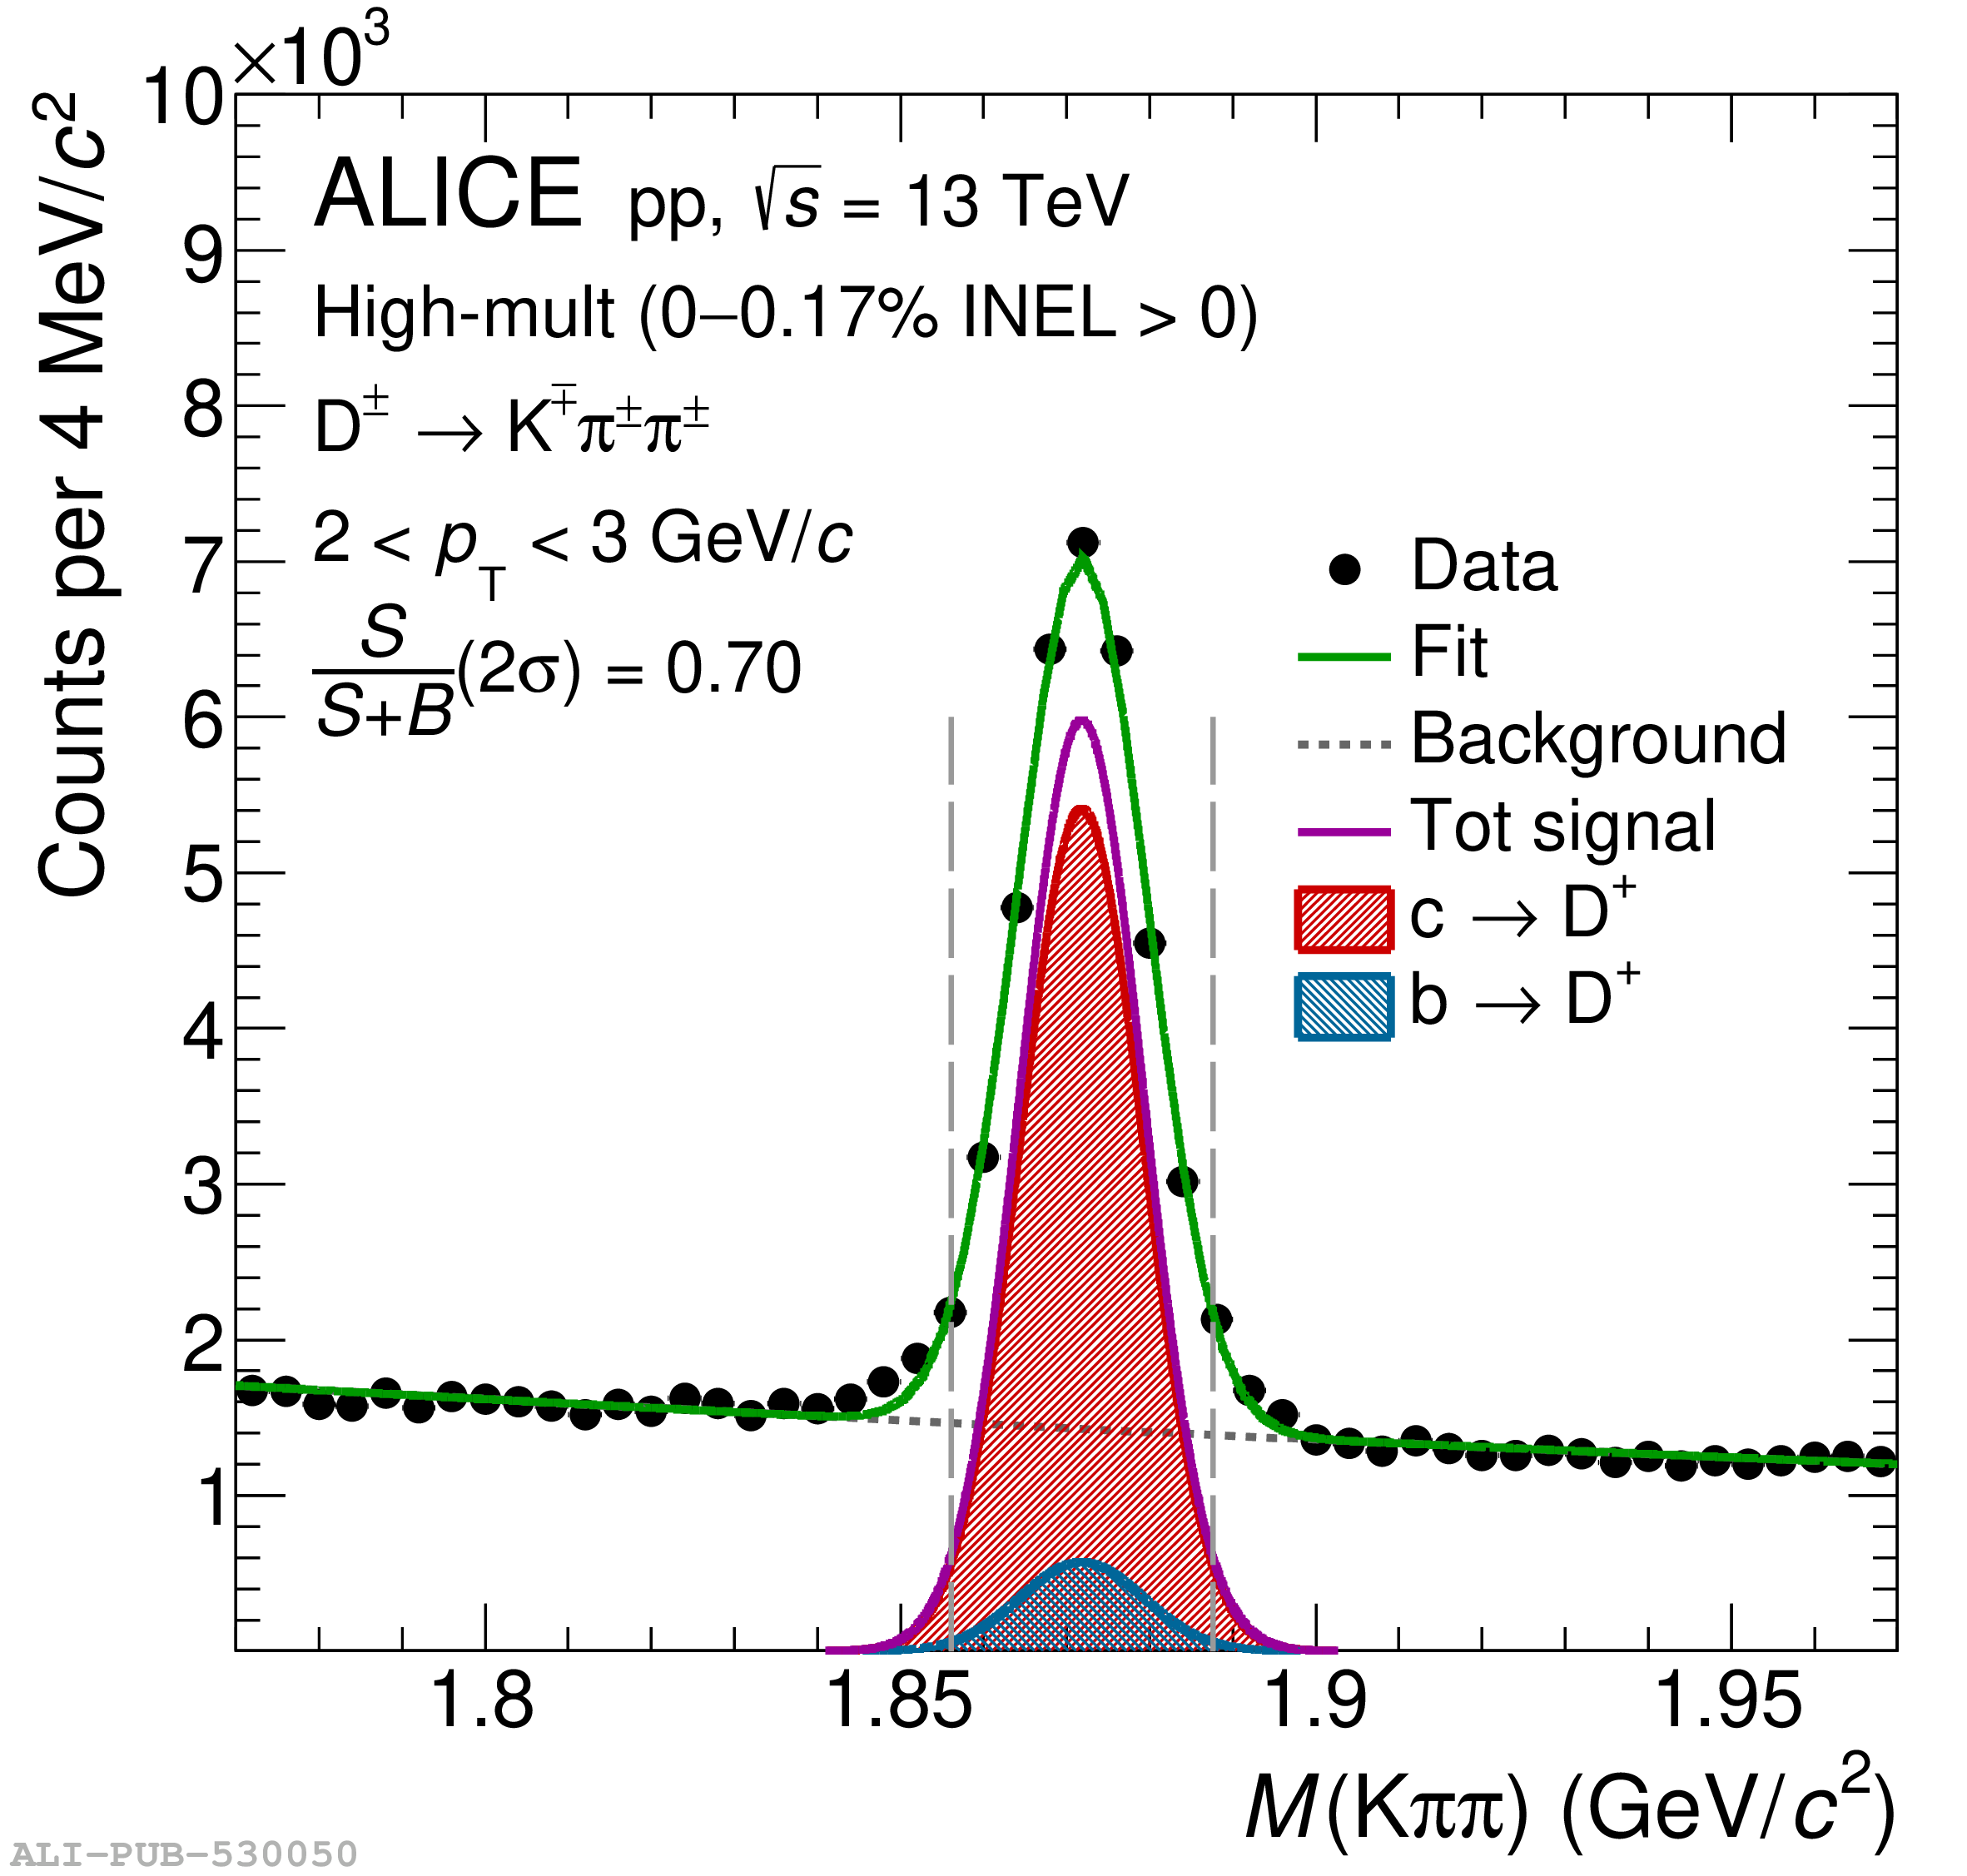 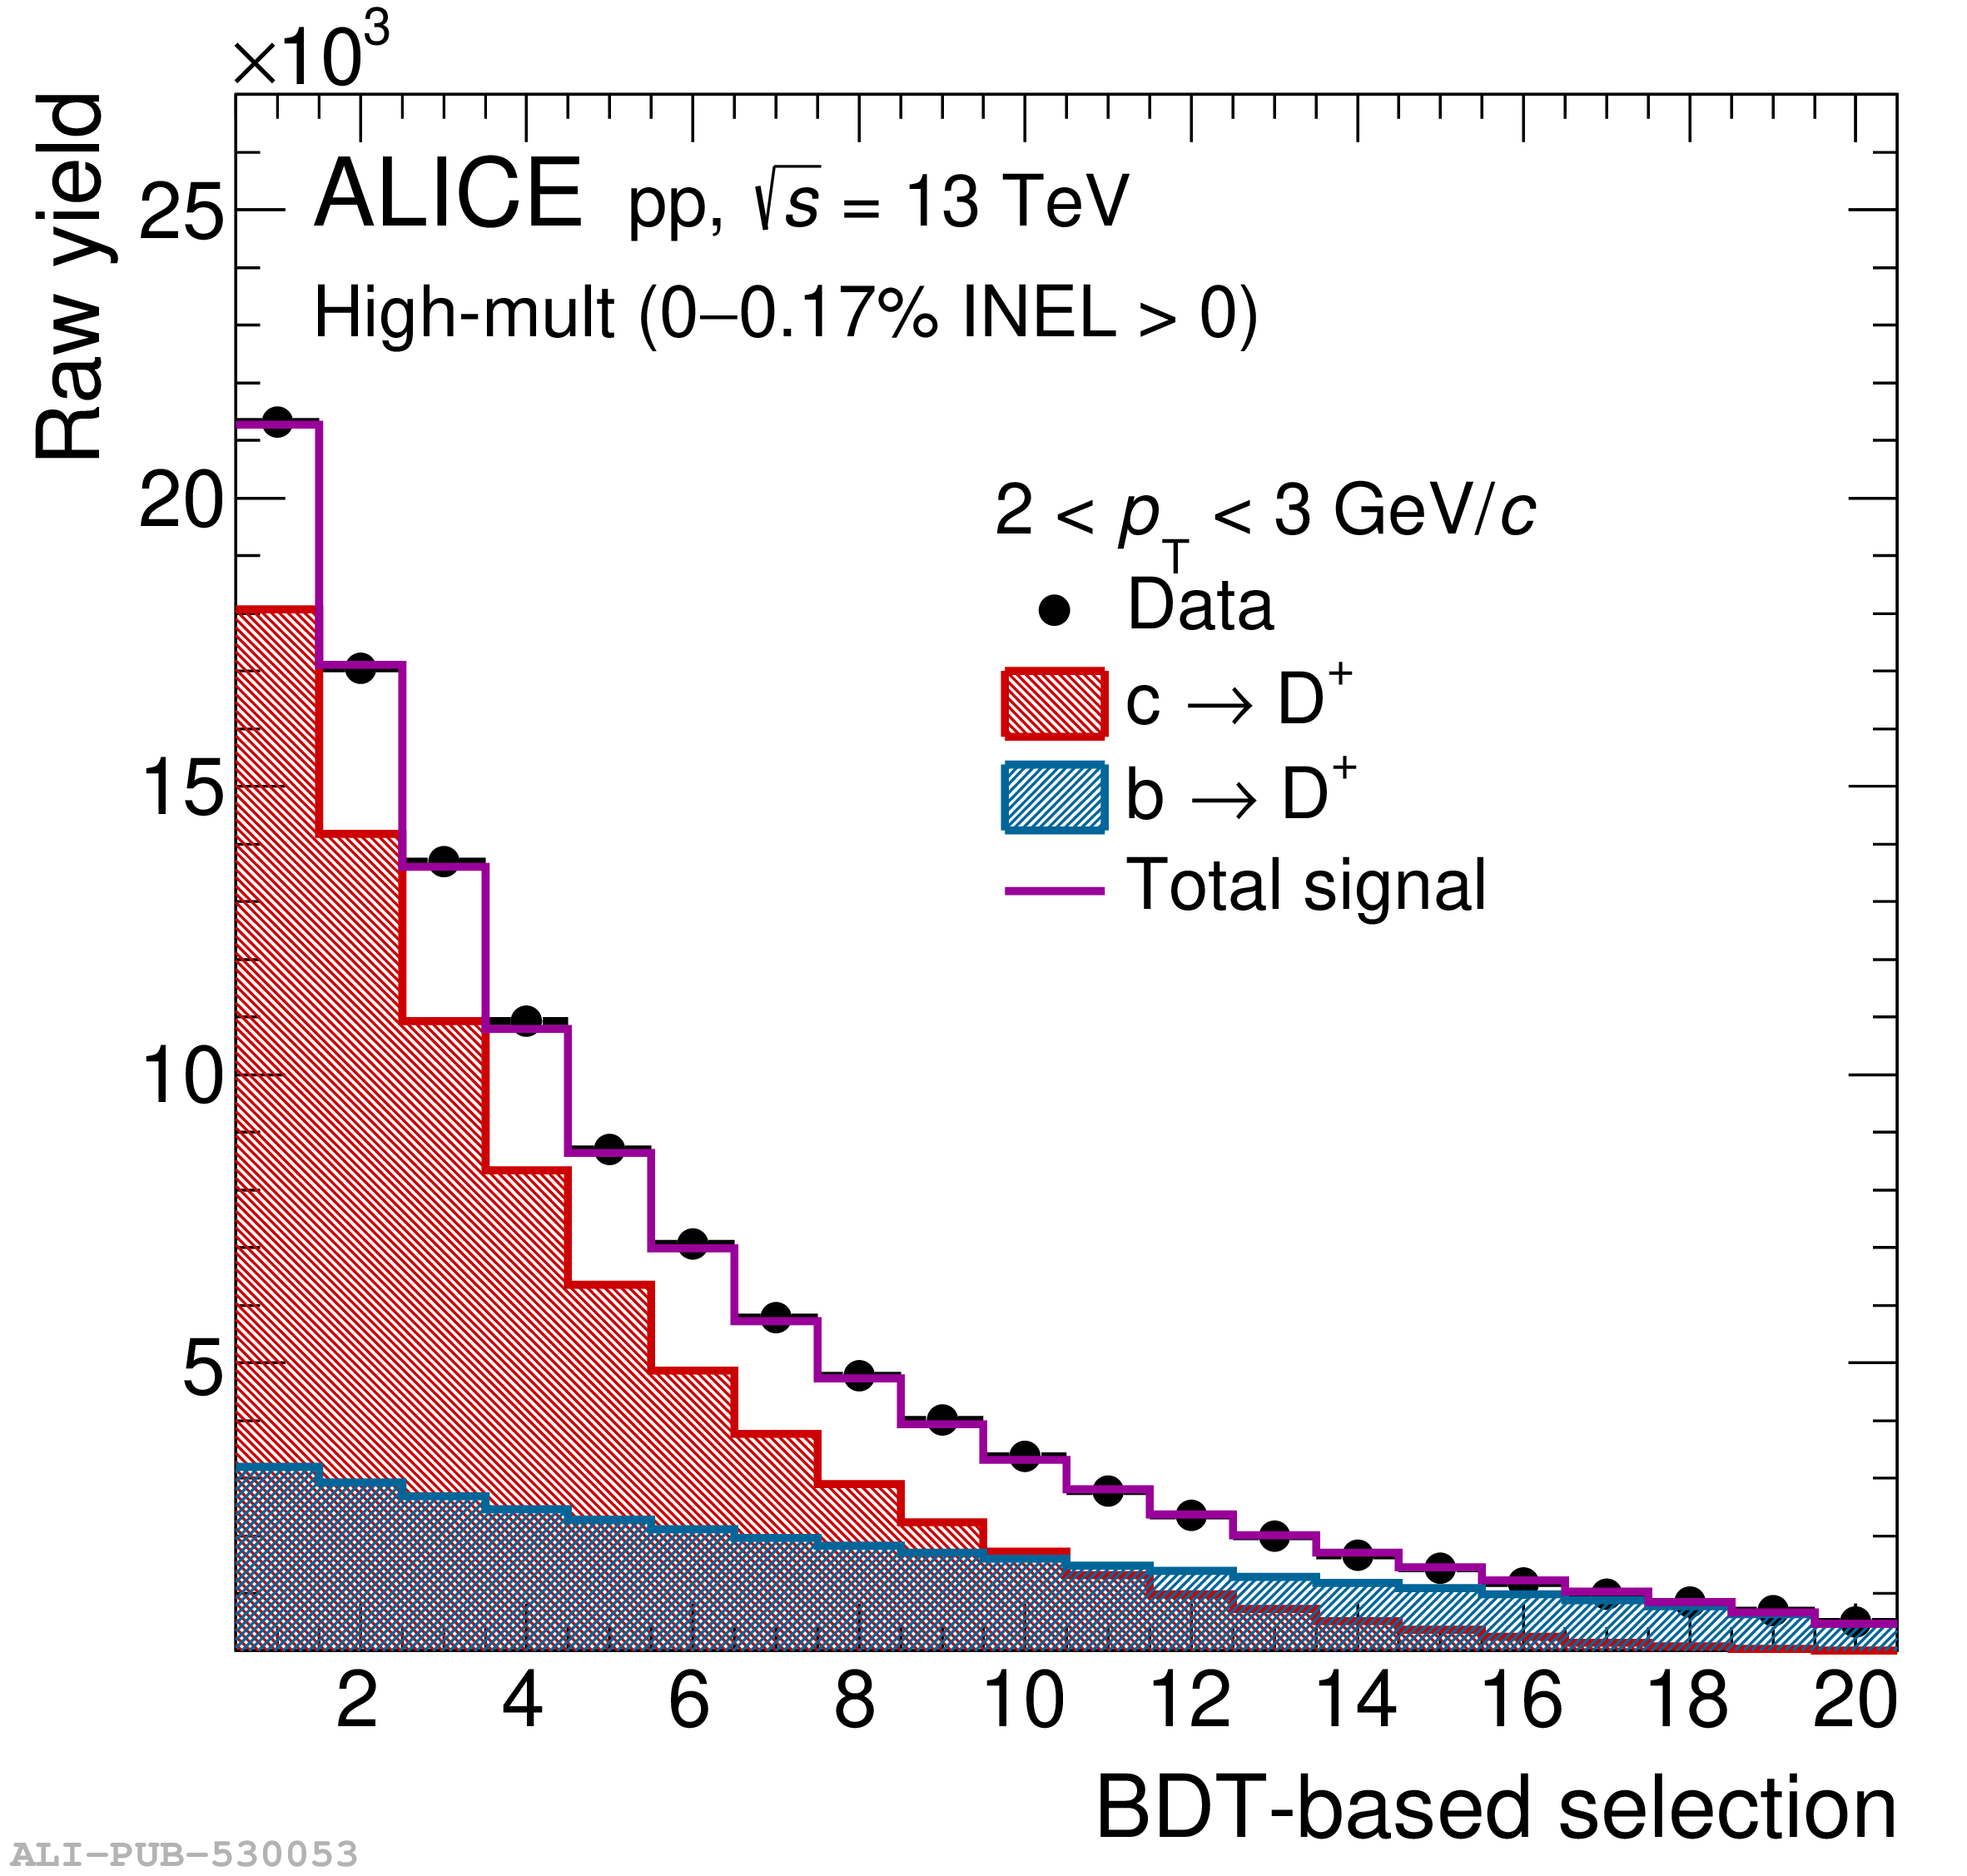 |
Figure 2
Left: experimental \pD correlation function in the range $0<\kstar<2 \gev/c$. Statistical (bars) and systematic uncertainties (shaded boxes) are shown separately. The open boxes represent the bin width. Right: experimental \pD correlation function in a reduced \kstar range together with the contributions from \pKpipi (green band) and \pDstar (red band), and the total background model (purple band). The \pKpipi and \pDstar contributions are not scaled by the respective $\lambda$ parameter. The width of the dark (light) shaded bands depicts the statistical (total) uncertainty of the parametrized background contributions. | 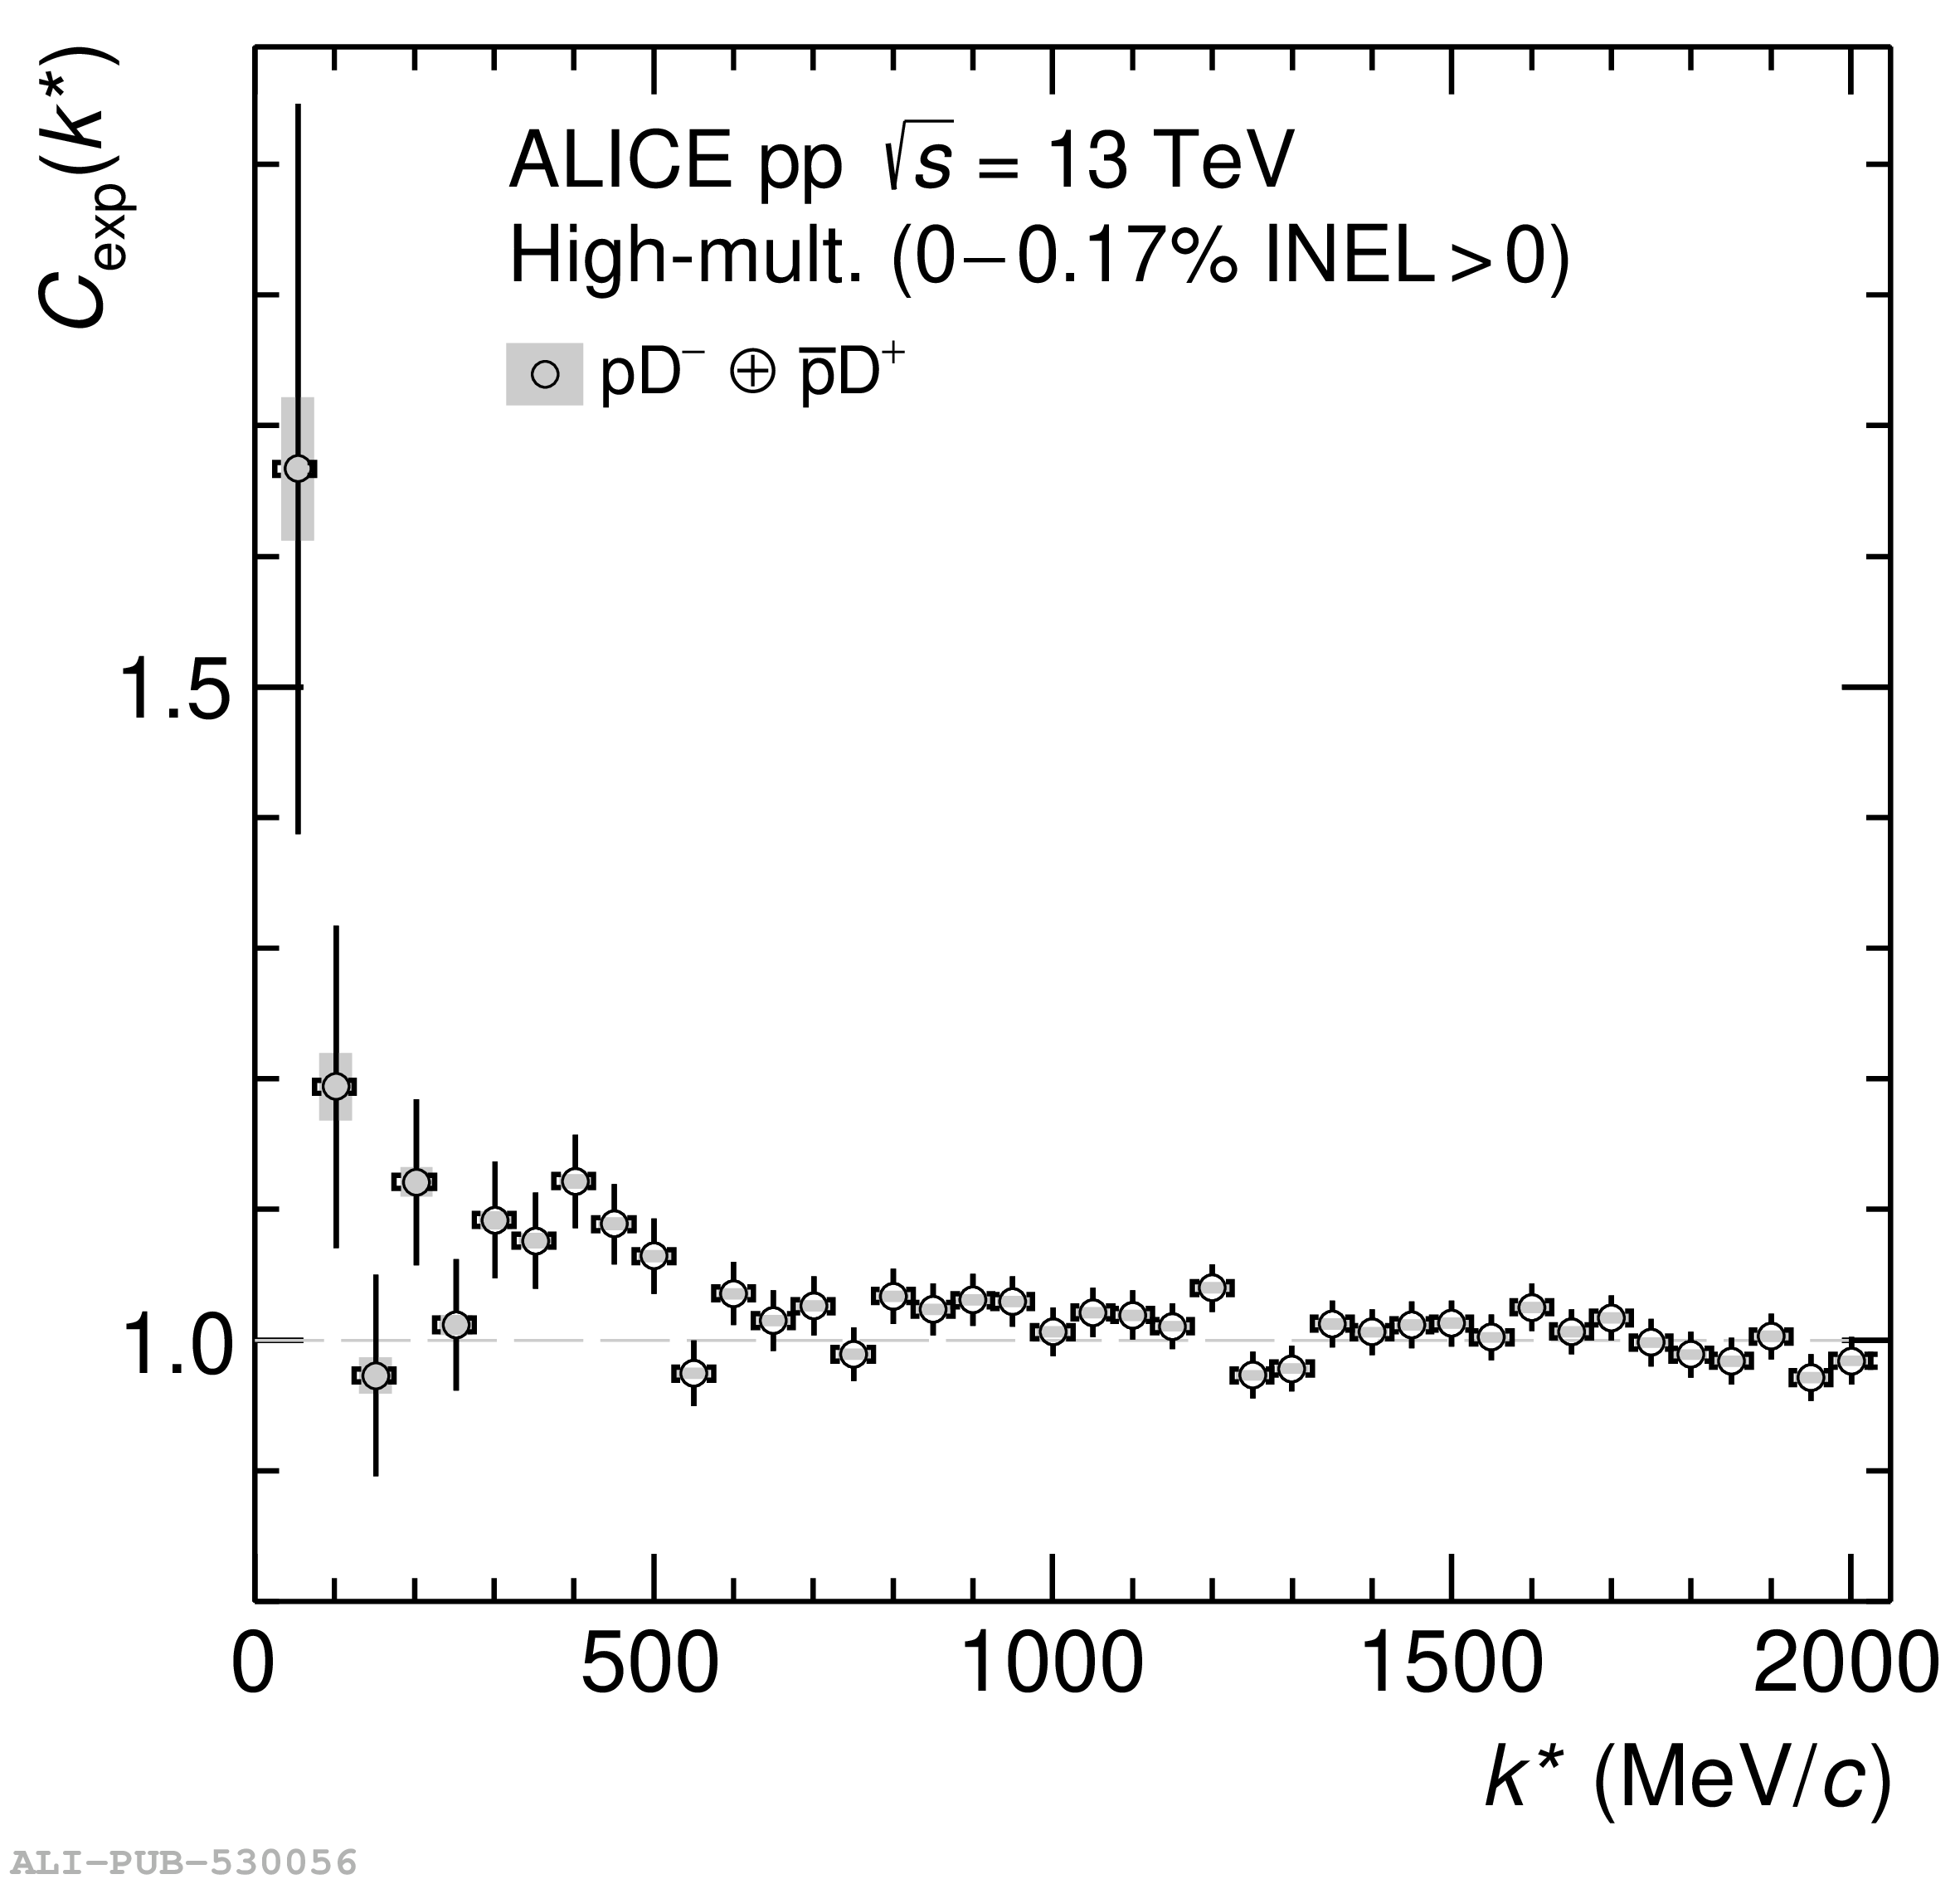 |
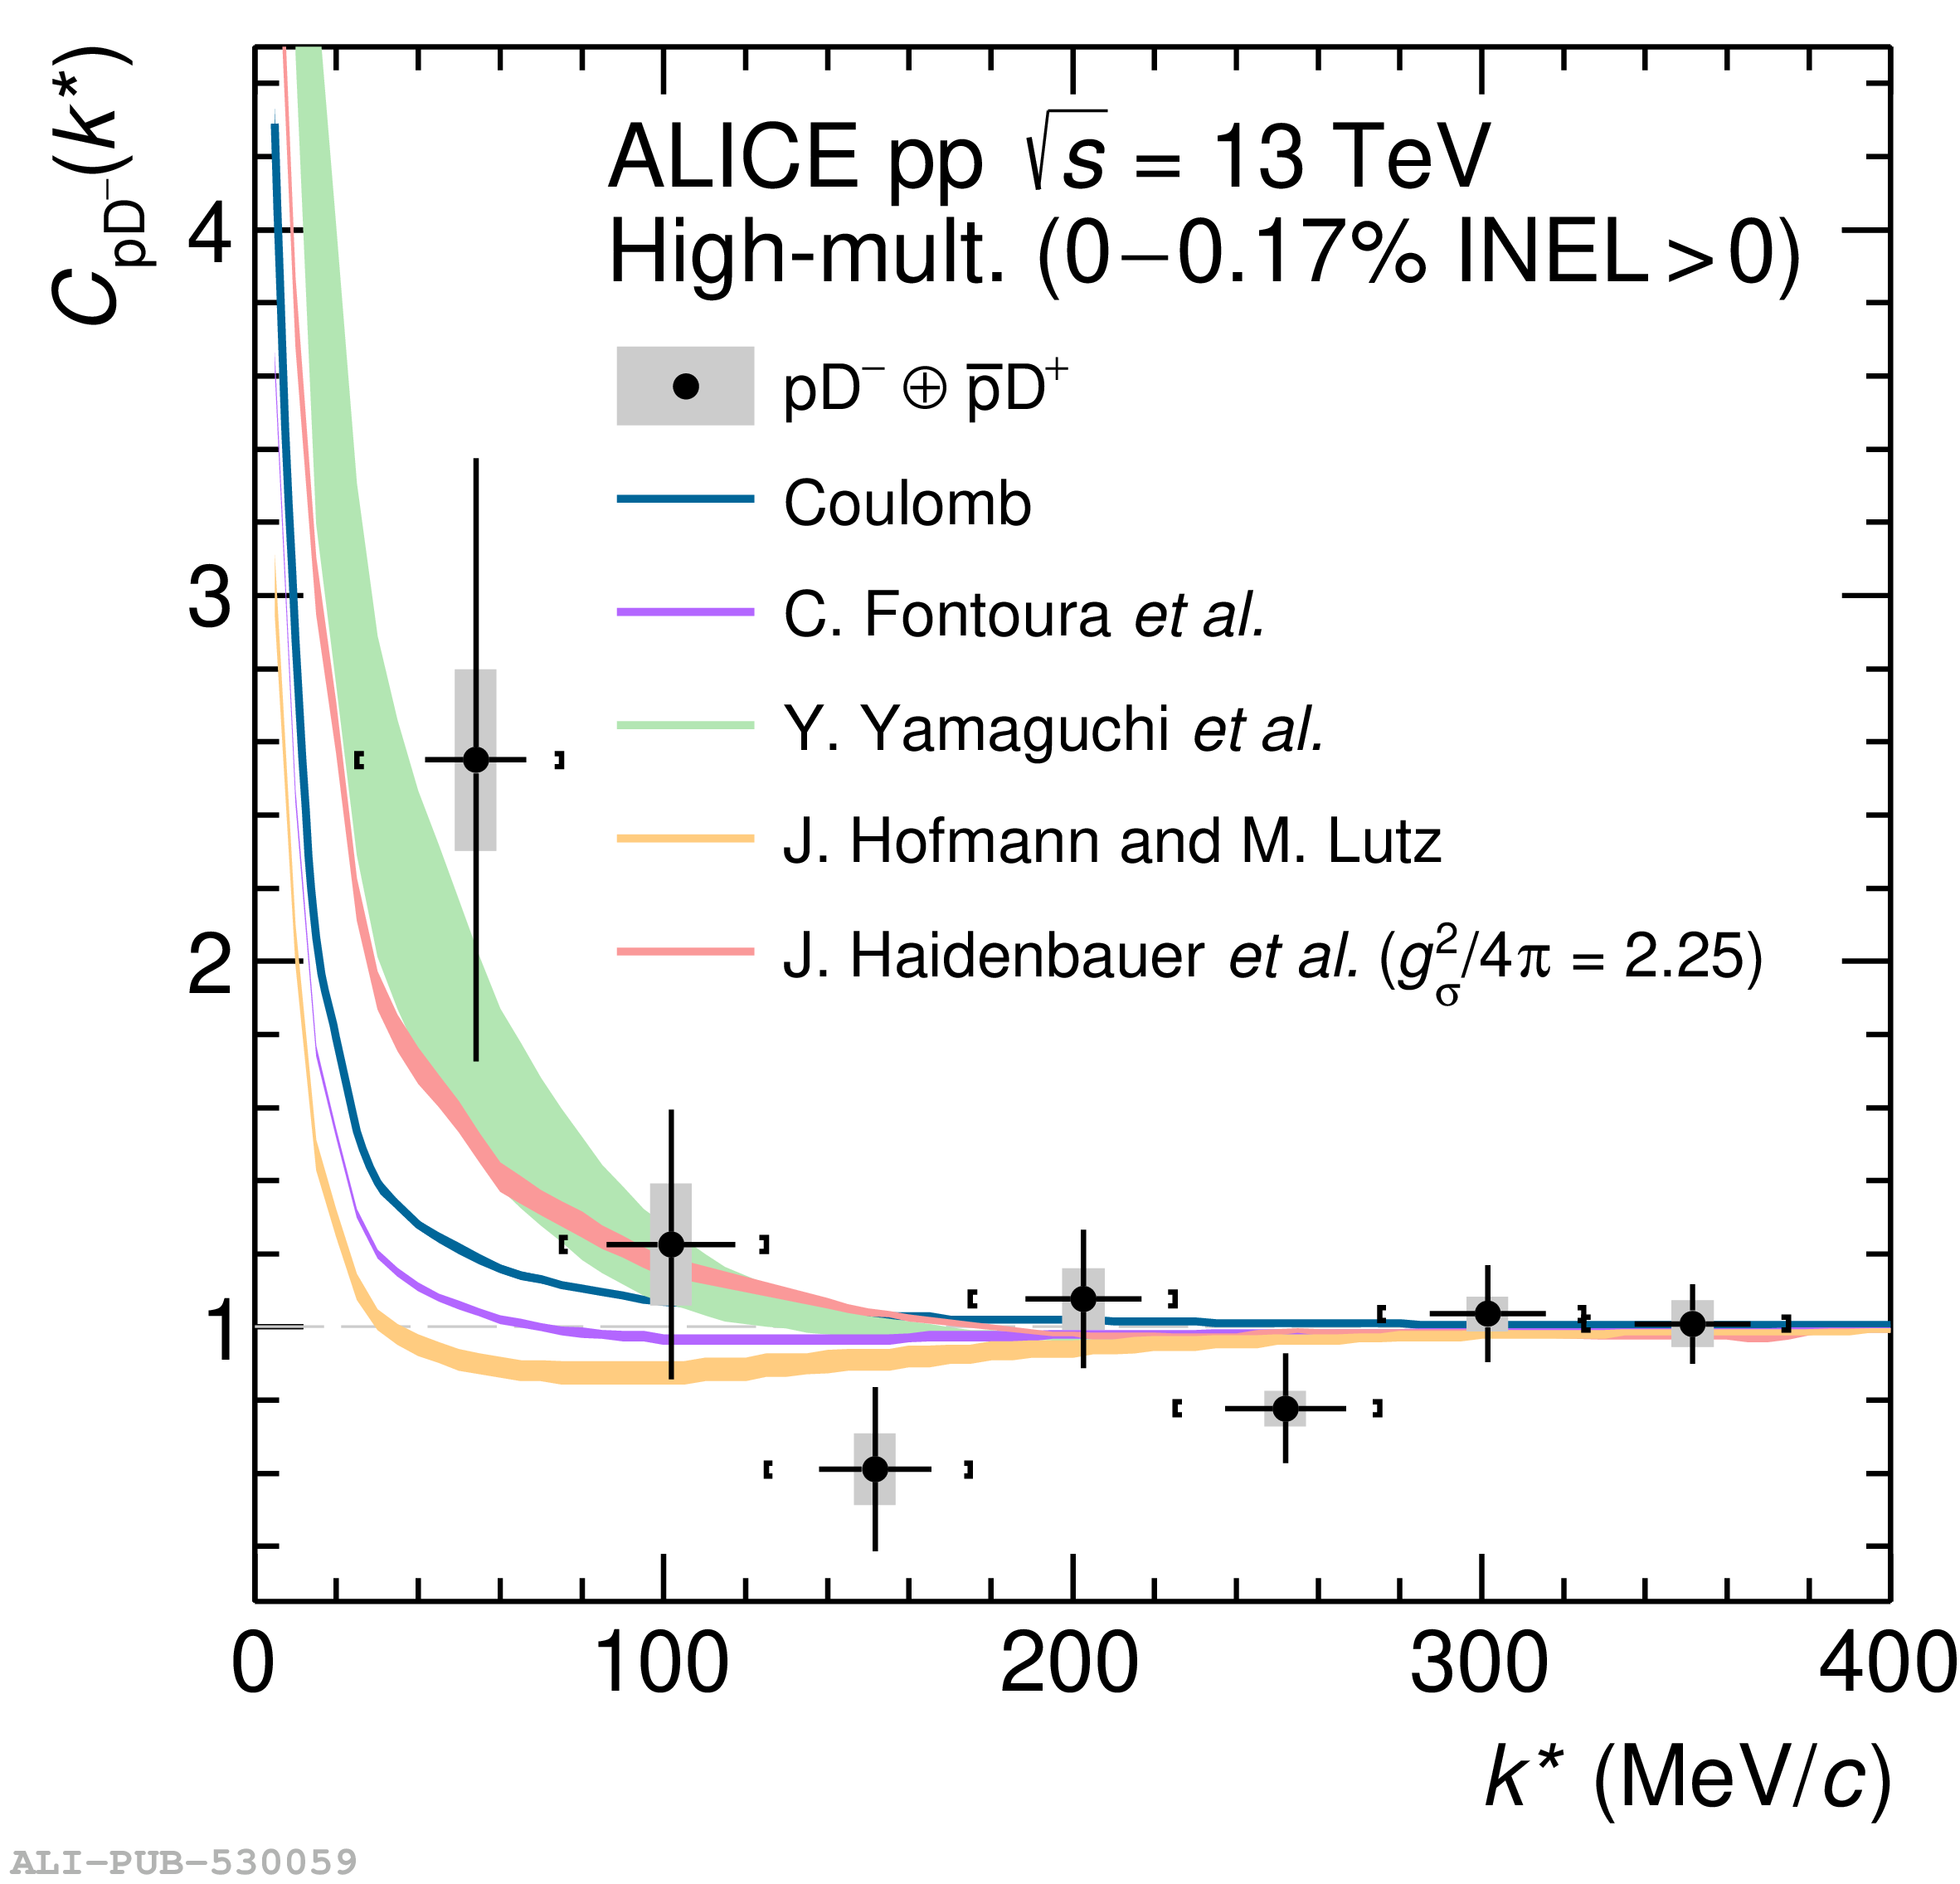
Figure 4
$\chi^2$ distributions obtained by comparing the measured $C_{\pD}(\kstar)$ for $\kstar < \SI{200}{\MeVc}$ with the correlation function calculated with an interaction modeled by a Gaussian potential with an interaction range given by $\uprho$-meson exchanges as a function of the inverse scattering length (left panel) and the interaction potential (right panel) for $\mathrm{I}=0$. The blue dotted lines represent the value of $f_{0, \mathrm{I}=0}^{-1}$ and $V_\mathrm{I}=0$ for which the $\chi^2$ is minimum and for the $1\,\sigma$ confidence interval. | 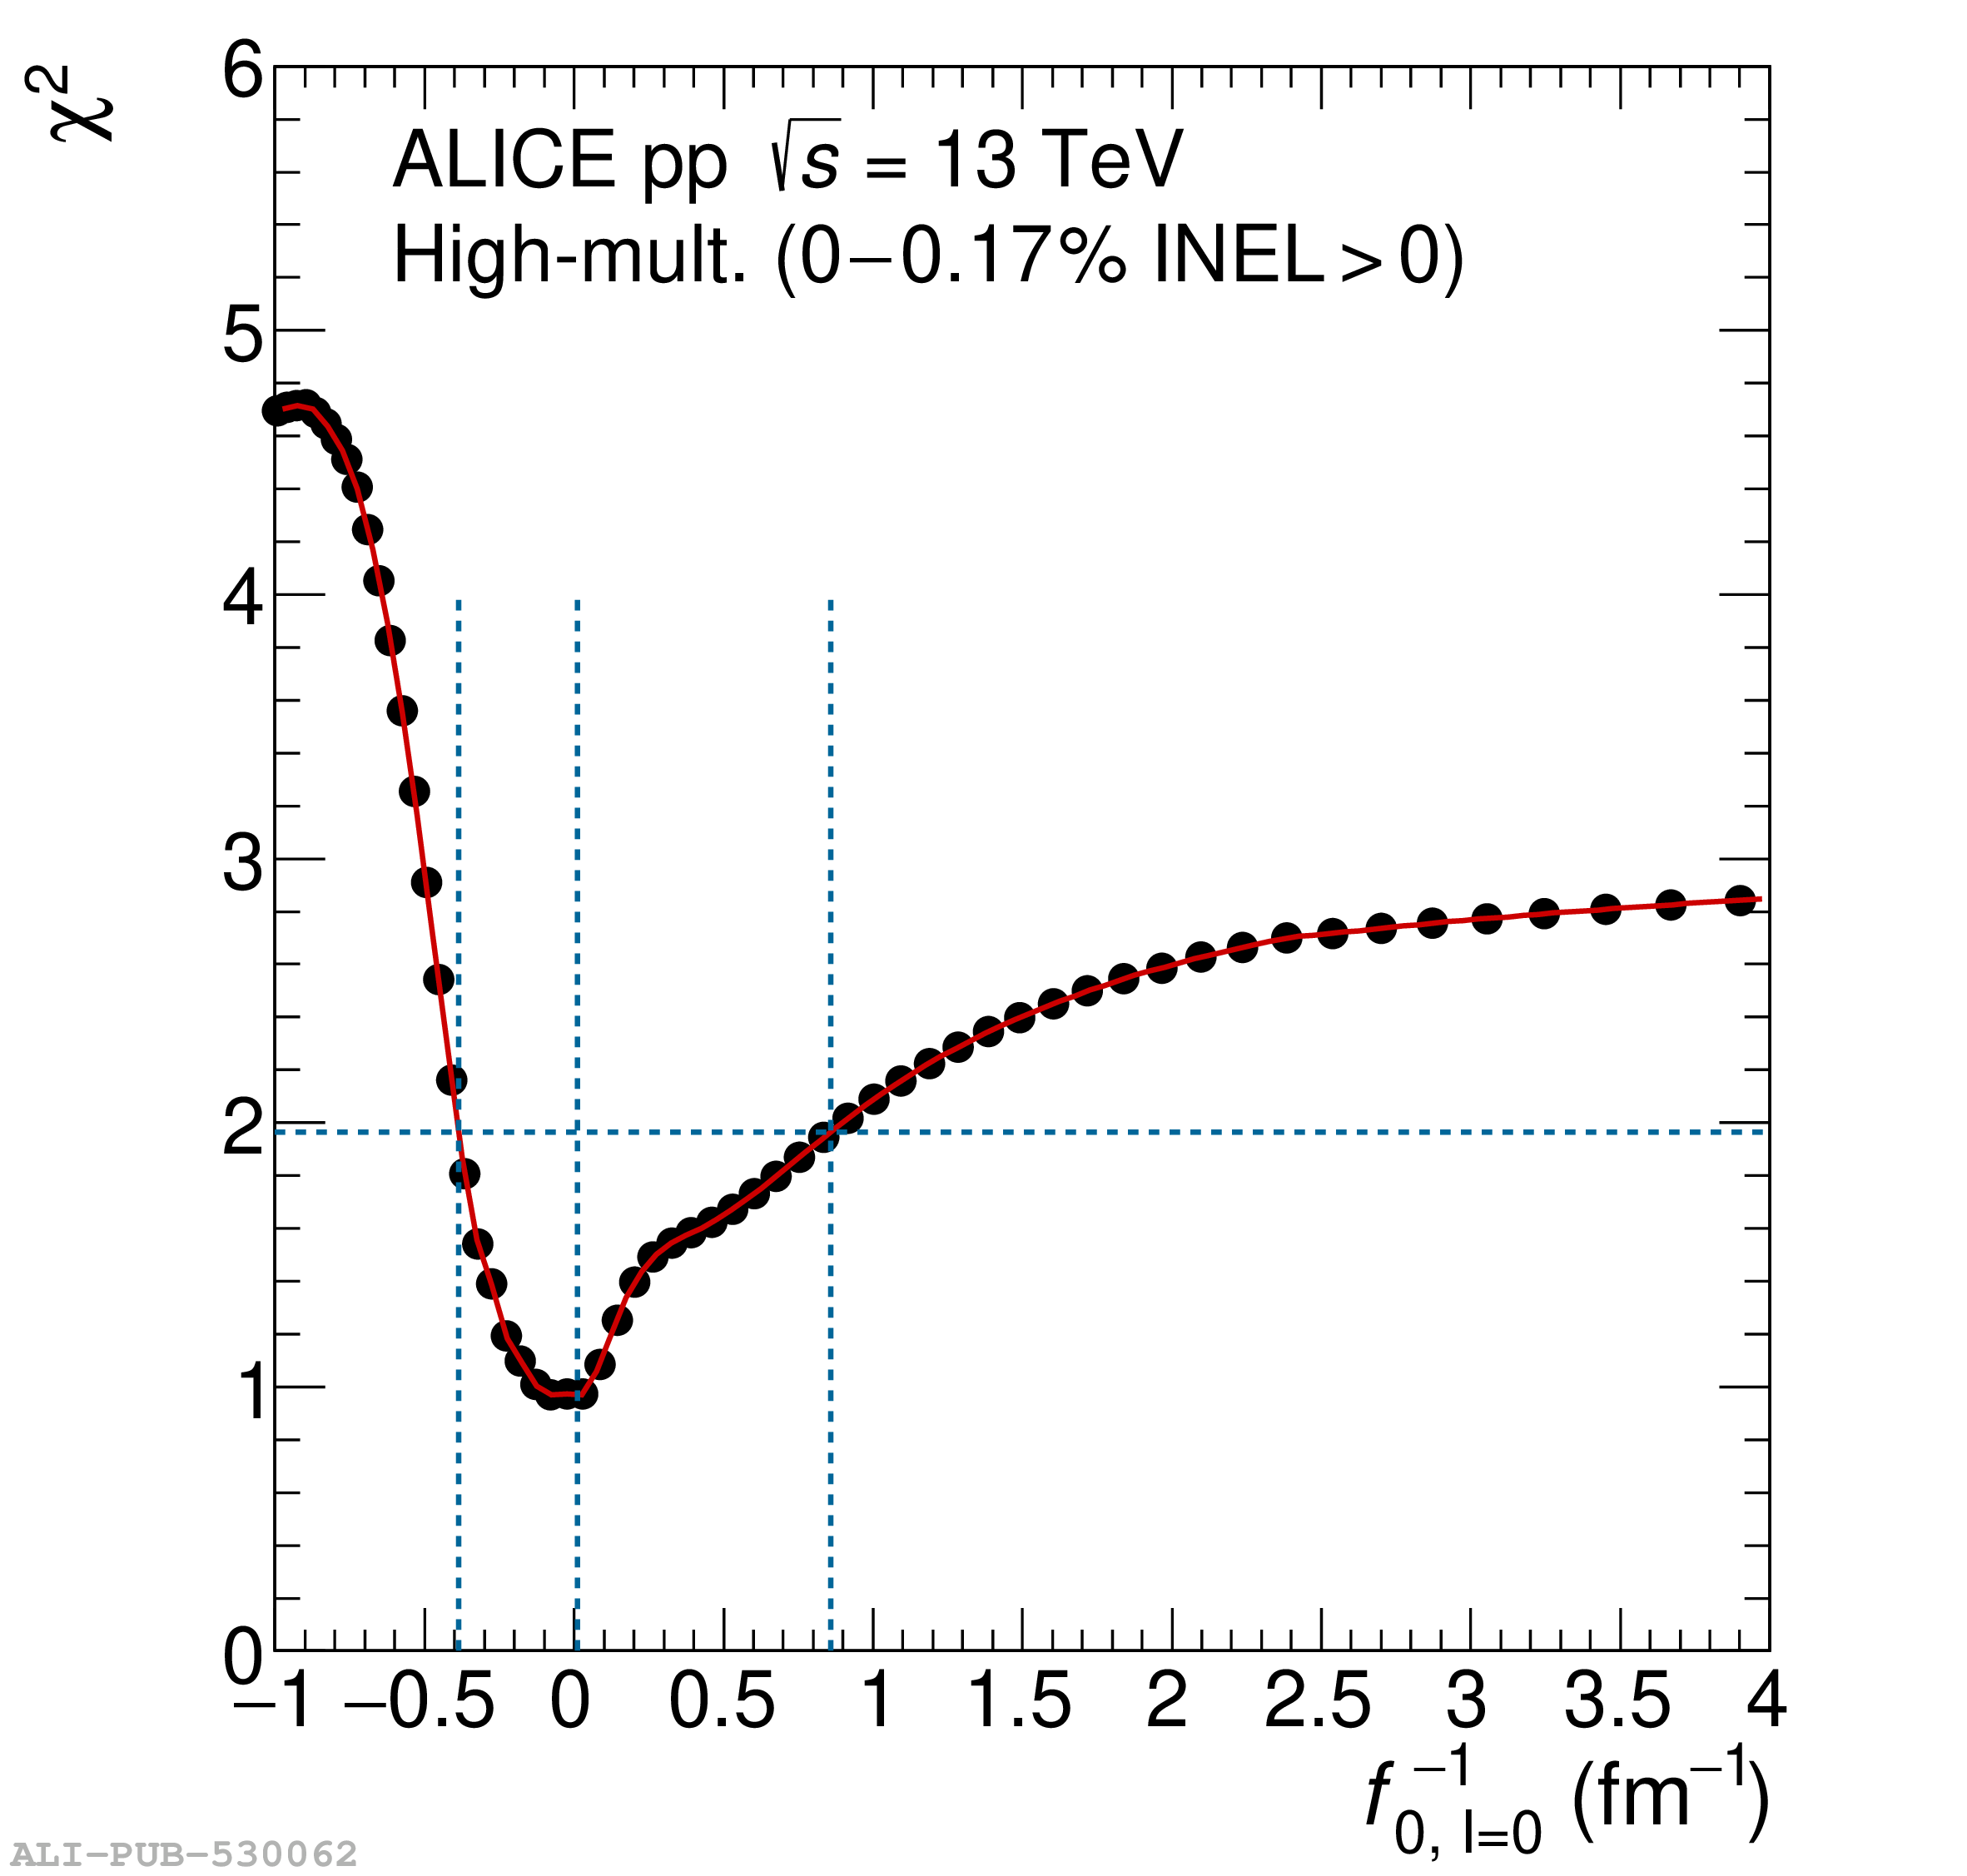 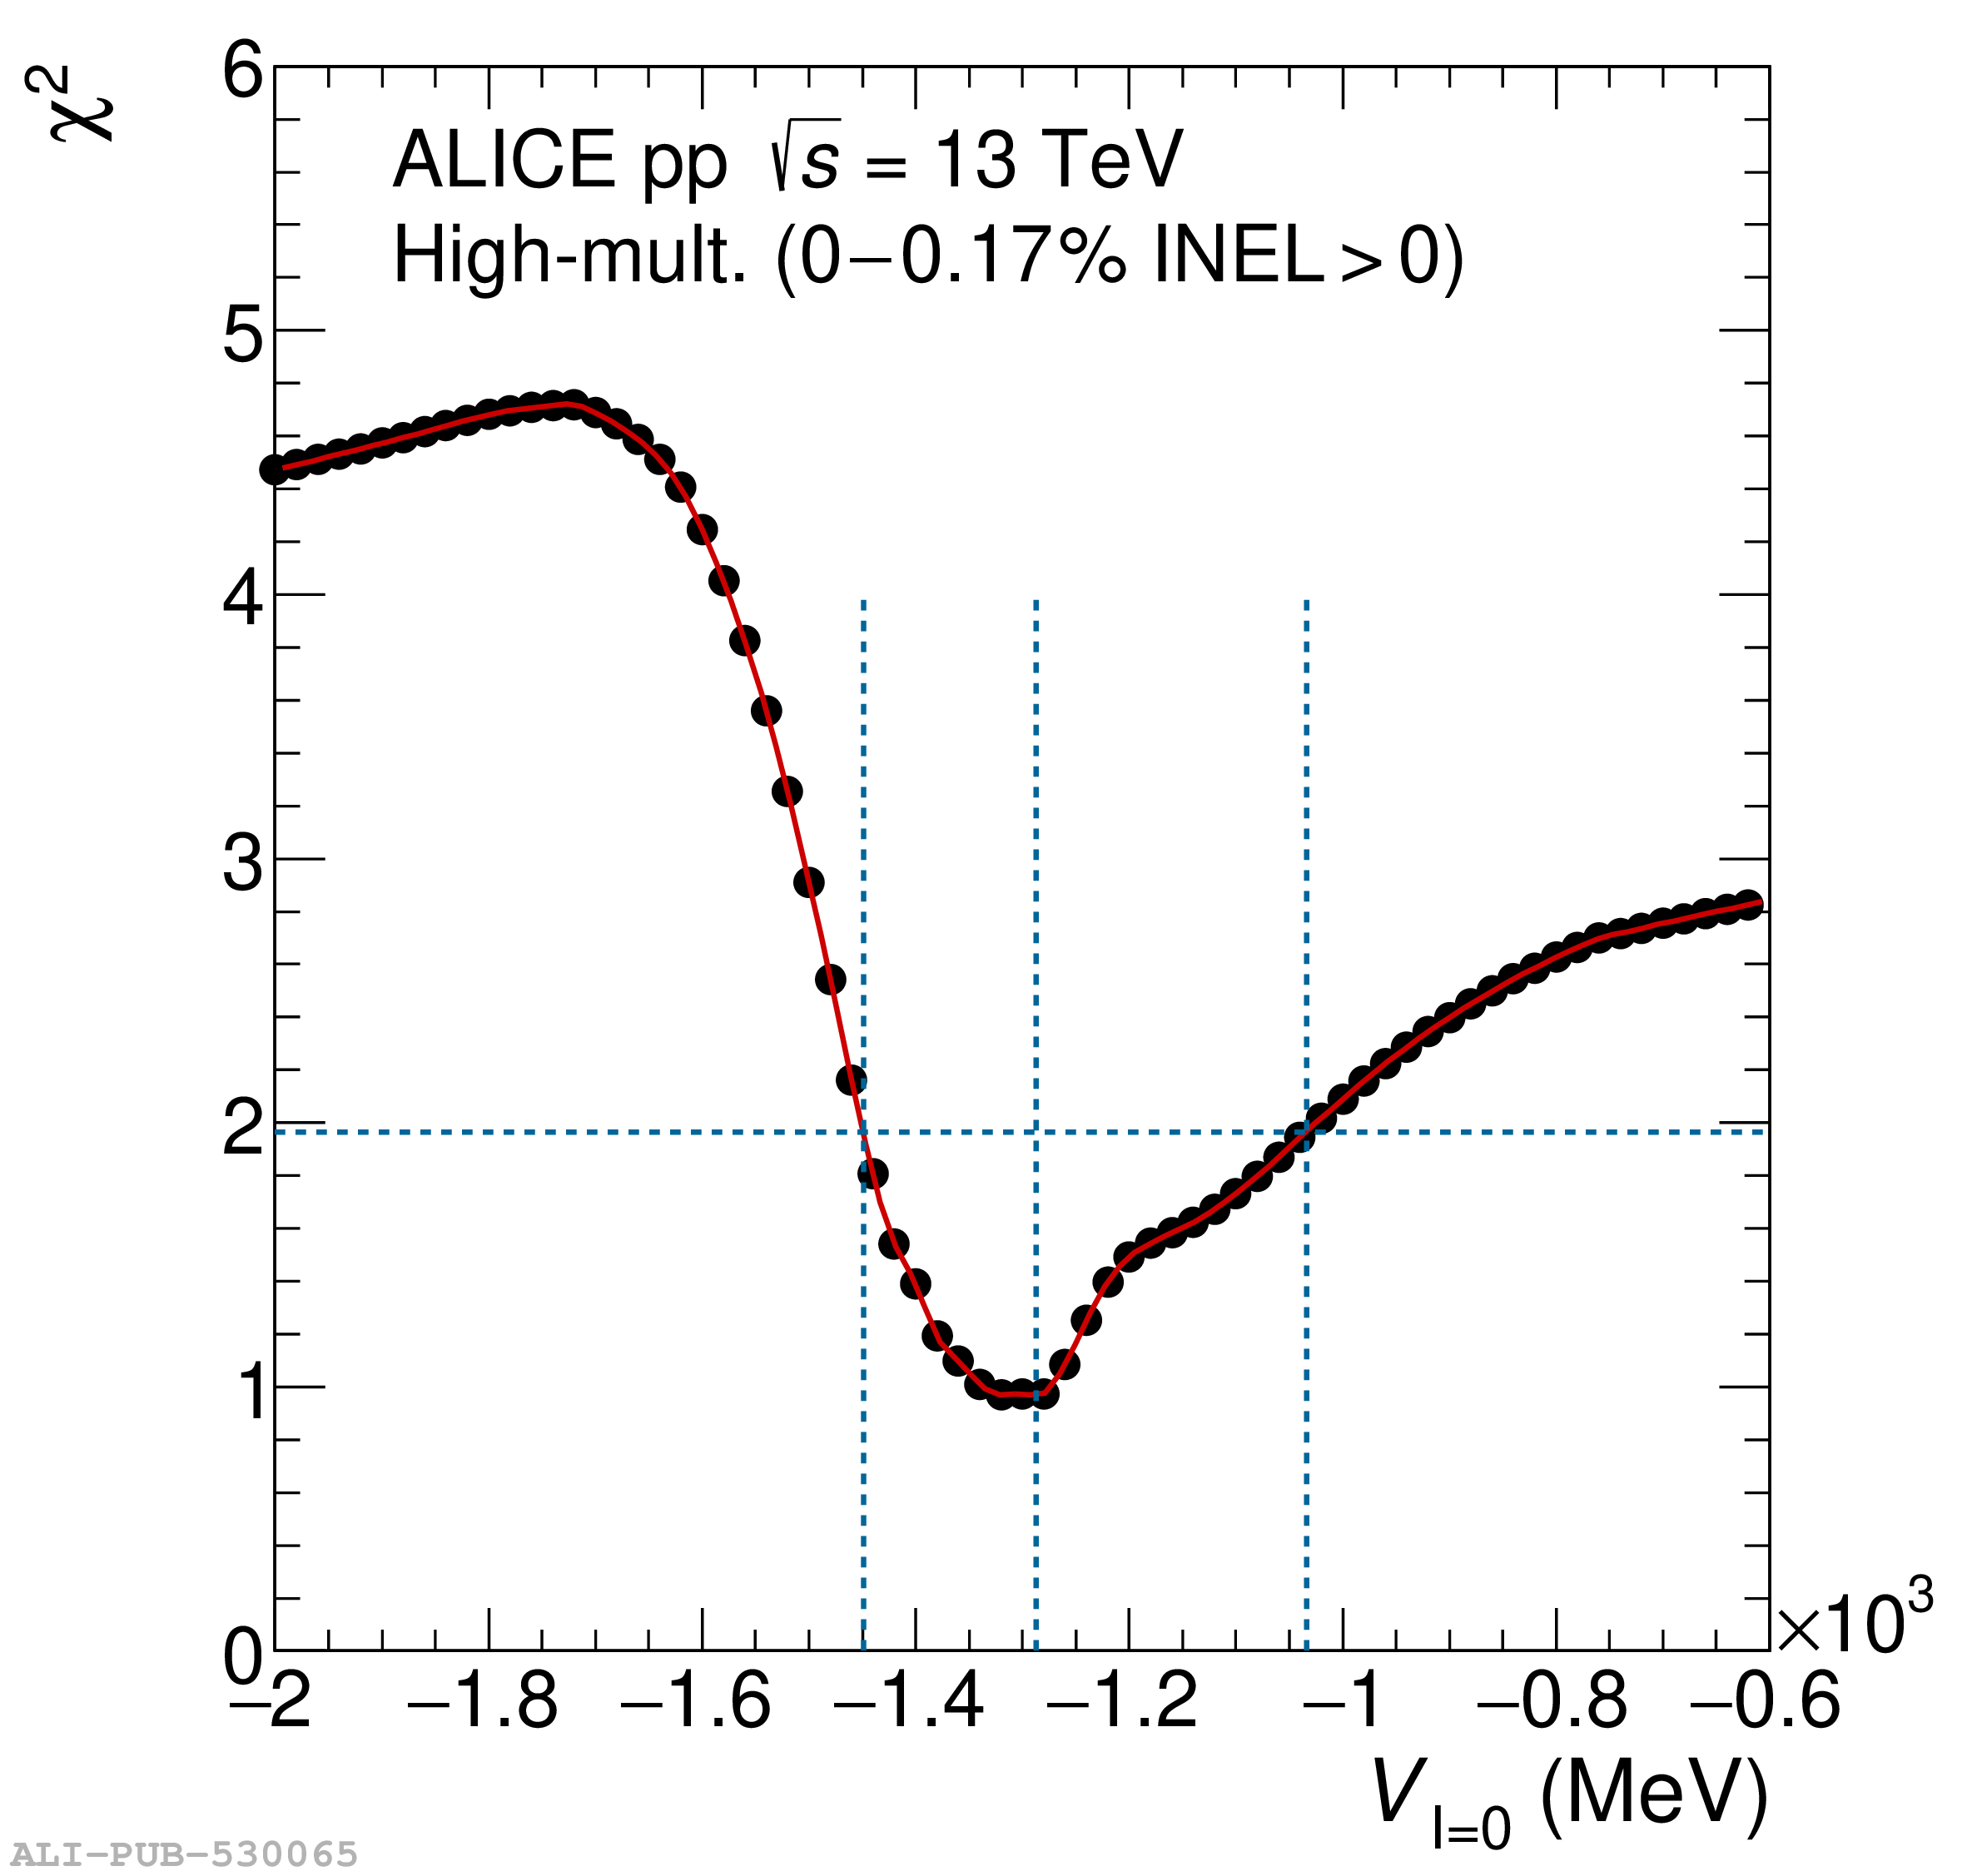 |
Figure 5
Regions of 68\% confidence intervals for the inverse scattering length \scattLen as a function of the source radius varied within one standard deviation considering only the \mt dependence on \reff and the total uncertainty (see text for details) under the assumption of negligible interaction for $\mathrm{I}=1$. The most probable value is reported by the star symbol. | 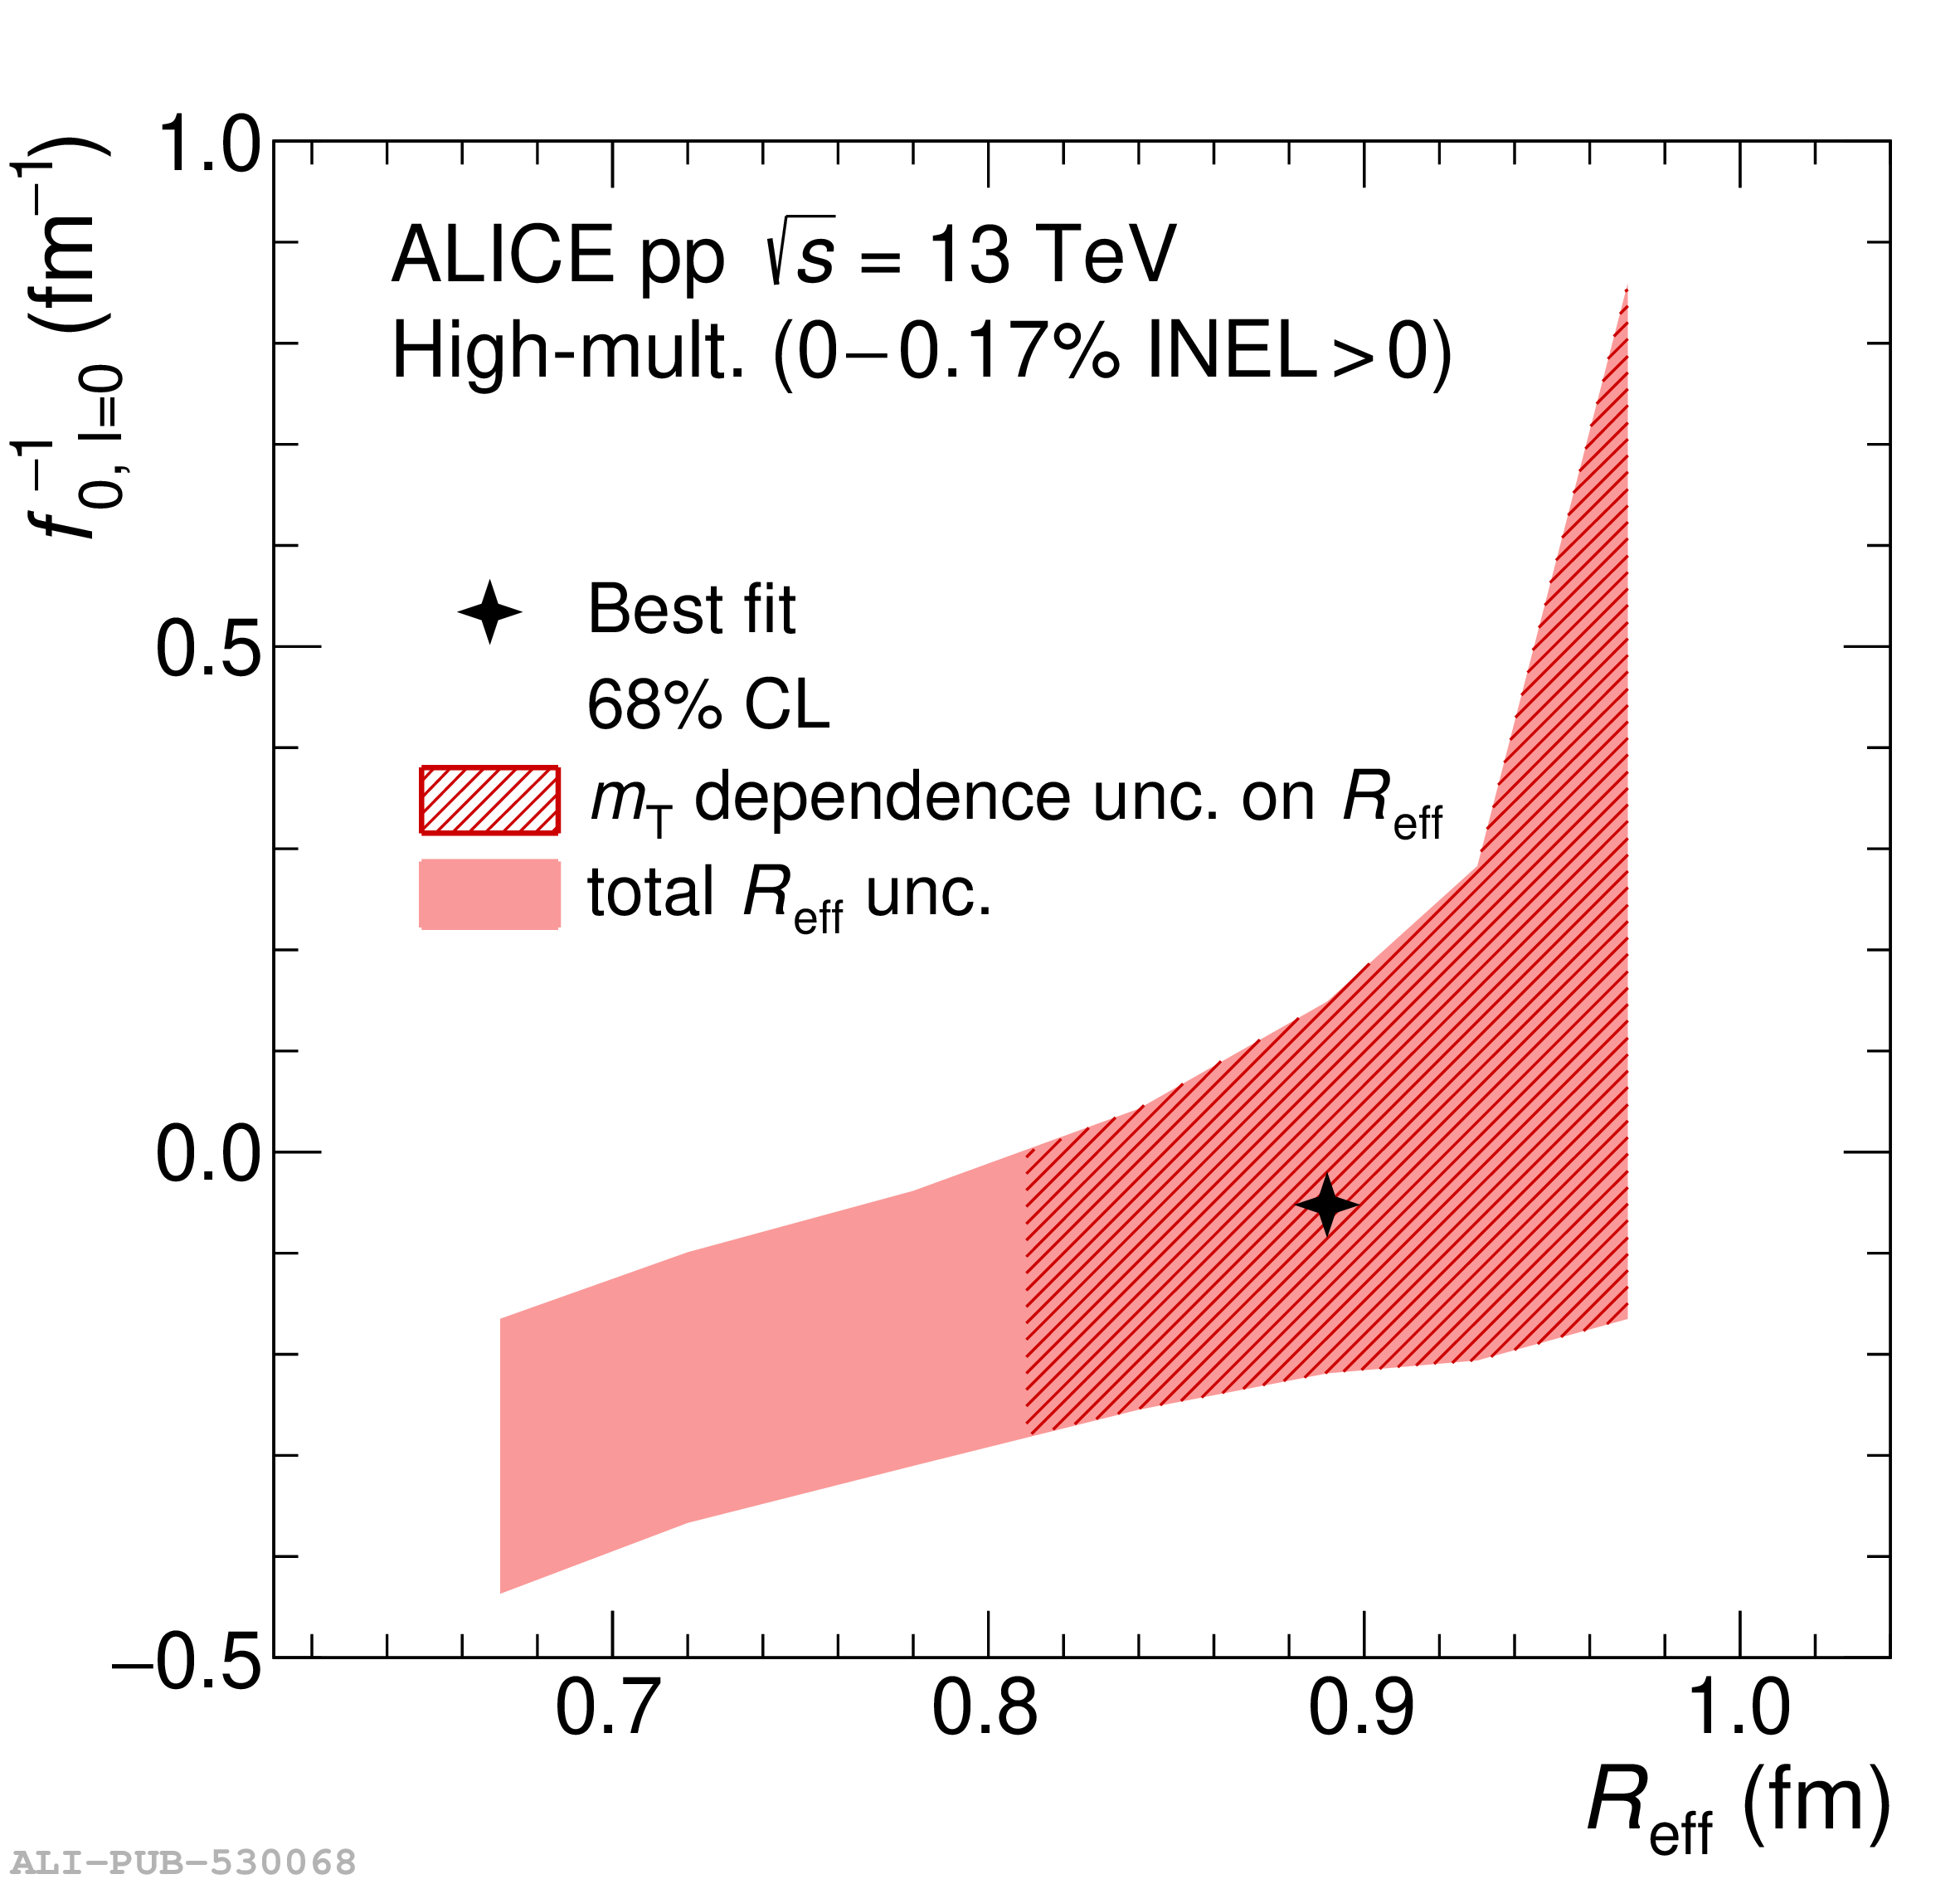 |