Angular correlations of heavy-flavour and charged particles in high-energy proton-proton collisions are sensitive to the production mechanisms of heavy quarks and to their fragmentation as well as hadronisation processes. The measurement of the azimuthal-correlation function of prompt D mesons with charged particles in proton-proton collisions at a centre-of-mass energy of $\sqrt{s} = 13$ TeV with the ALICE detector is reported, considering D$^{0}$, D$^{+}$, and D$^{*+}$ mesons in the transverse-momentum interval $3 <~ p_{\rm T} <~ 36$ GeV/$c$ at midrapidity ($|y| <~ 0.5$), and charged particles with $p_{\rm T} > 0.3$ GeV/$c$ and pseudorapidity $|\eta| <~ 0.8$. This measurement has an improved precision and provides an extended transverse-momentum coverage compared to previous ALICE measurements at lower energies. The study is also performed as a function of the charged-particle multiplicity, showing no modifications of the correlation function with multiplicity within uncertainties. The properties and the transverse-momentum evolution of the near- and away-side correlation peaks are studied and compared with predictions from various Monte Carlo event generators. Among those considered, PYTHIA8 and POWHEG+PYTHIA8 provide the best description of the measured observables. The obtained results can provide guidance on tuning the generators.
Eur. Phys. J. C 82 (2022) 335
HEP Data
e-Print: arXiv:2110.10043 | PDF | inSPIRE
CERN-EP-2021-184
Figure group
Figure 1
Average of the azimuthal-correlation functions of $\Dzero$, $\Dplus$, and $\Dstar$ mesons with associated particles, after the baseline subtraction, in pp collisions at $\sqrt{s}$ = 5.02 , 7 , and 13 TeV, for 3 $< \ptD <$ 5 \GeVc, 8 $< \ptD <$ 16 \GeVc, and 16 $<\ptD<$ 24 \GeVc (from left to right) and 0.3 $<\ptass<$ 1 \GeVc, 1 $<\ptass<$ 2 \GeVc (top and bottom panels, respectively). Data at $\sqrt{s}$ = 7 TeV are not available for all the $p_{\mathrm{T}}$ regions. Statistical and $\Delta \varphi$-dependent systematic uncertainties are shown as vertical error bars and boxes, respectively, and $\Delta \varphi$-independent uncertainties are written as text. The uncertainties from the subtraction of the baseline are displayed as boxes at $\Delta \varphi>\pi$. | 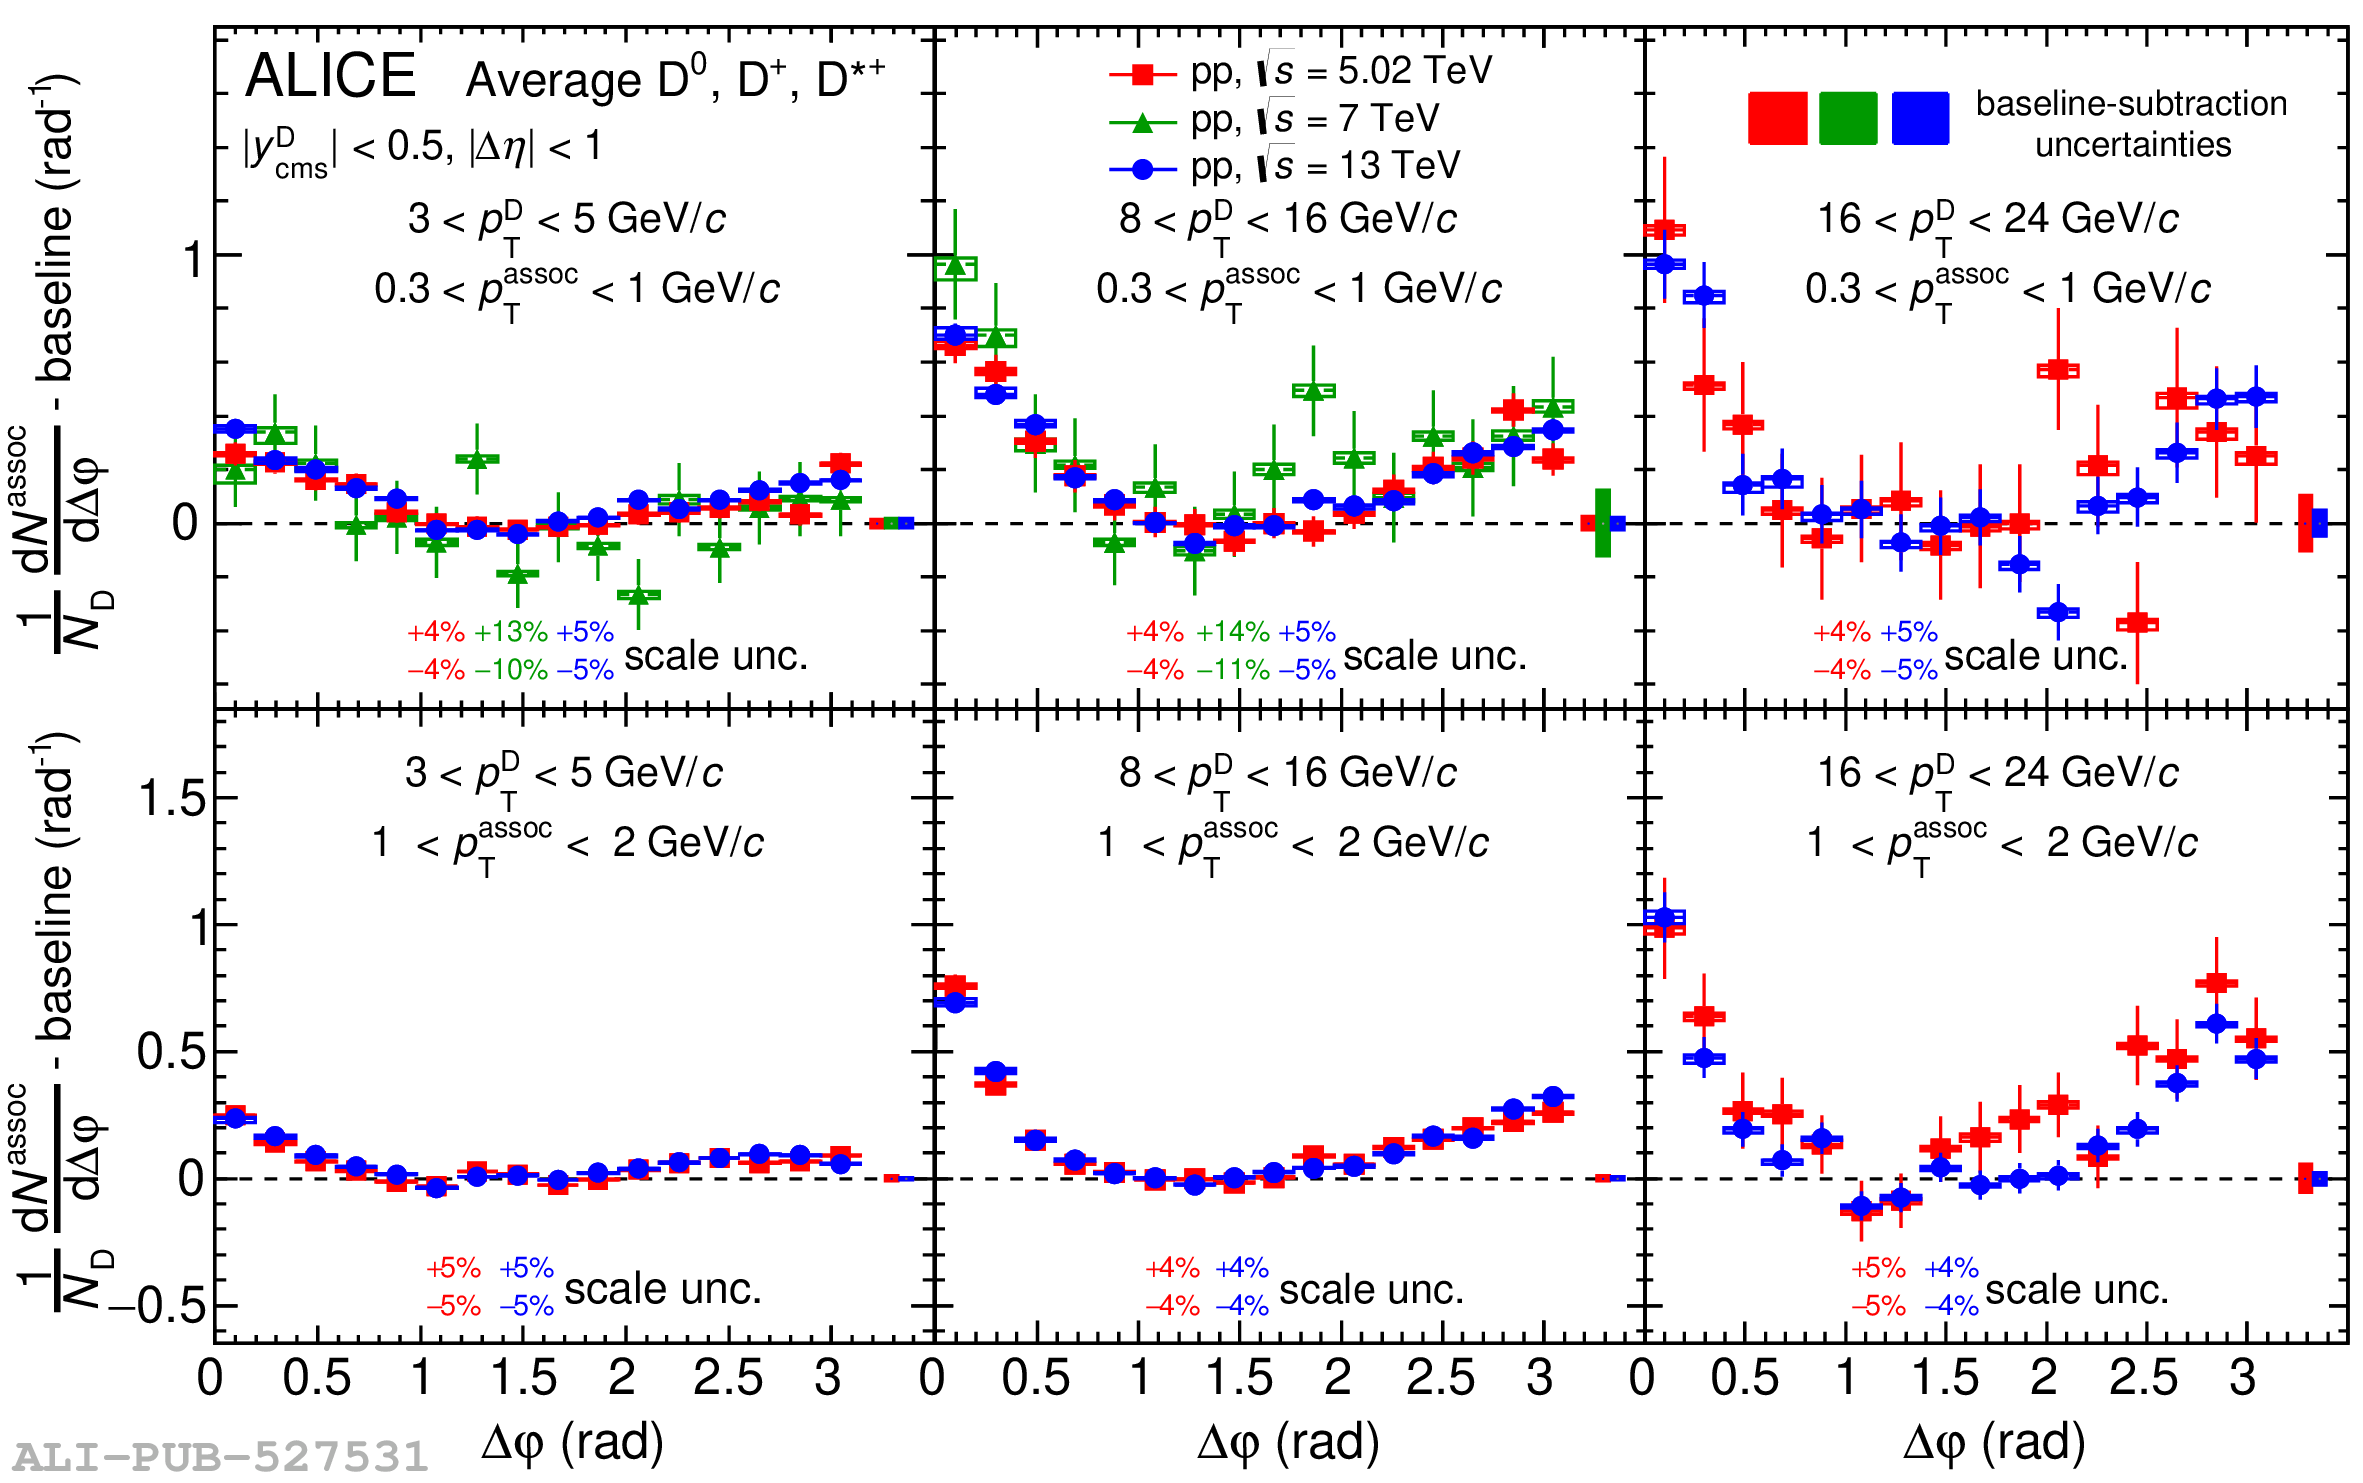 |
Figure 2
Near-side (left panel) and away-side (right panel) peak yields (first row) and widths (third row) obtained from a fit to the azimuthal correlation function after the baseline subtraction. The measurements are compared with ALICE results obtained in pp collisions at $\sqrt{s}$ = 5.02 TeV and 7 TeV , for 0.3 $<\ptass<$ 1 GeV/$c$, 1 $<\ptass<$ 2 GeV/$c$. Only near-side observables were computed in the $\sqrt{s}$ = 7 TeV analysis. The ratios to the $\sqrt{s} = 5.02$ TeV results are shown in the second and fourth rows for yields and widths, respectively. | 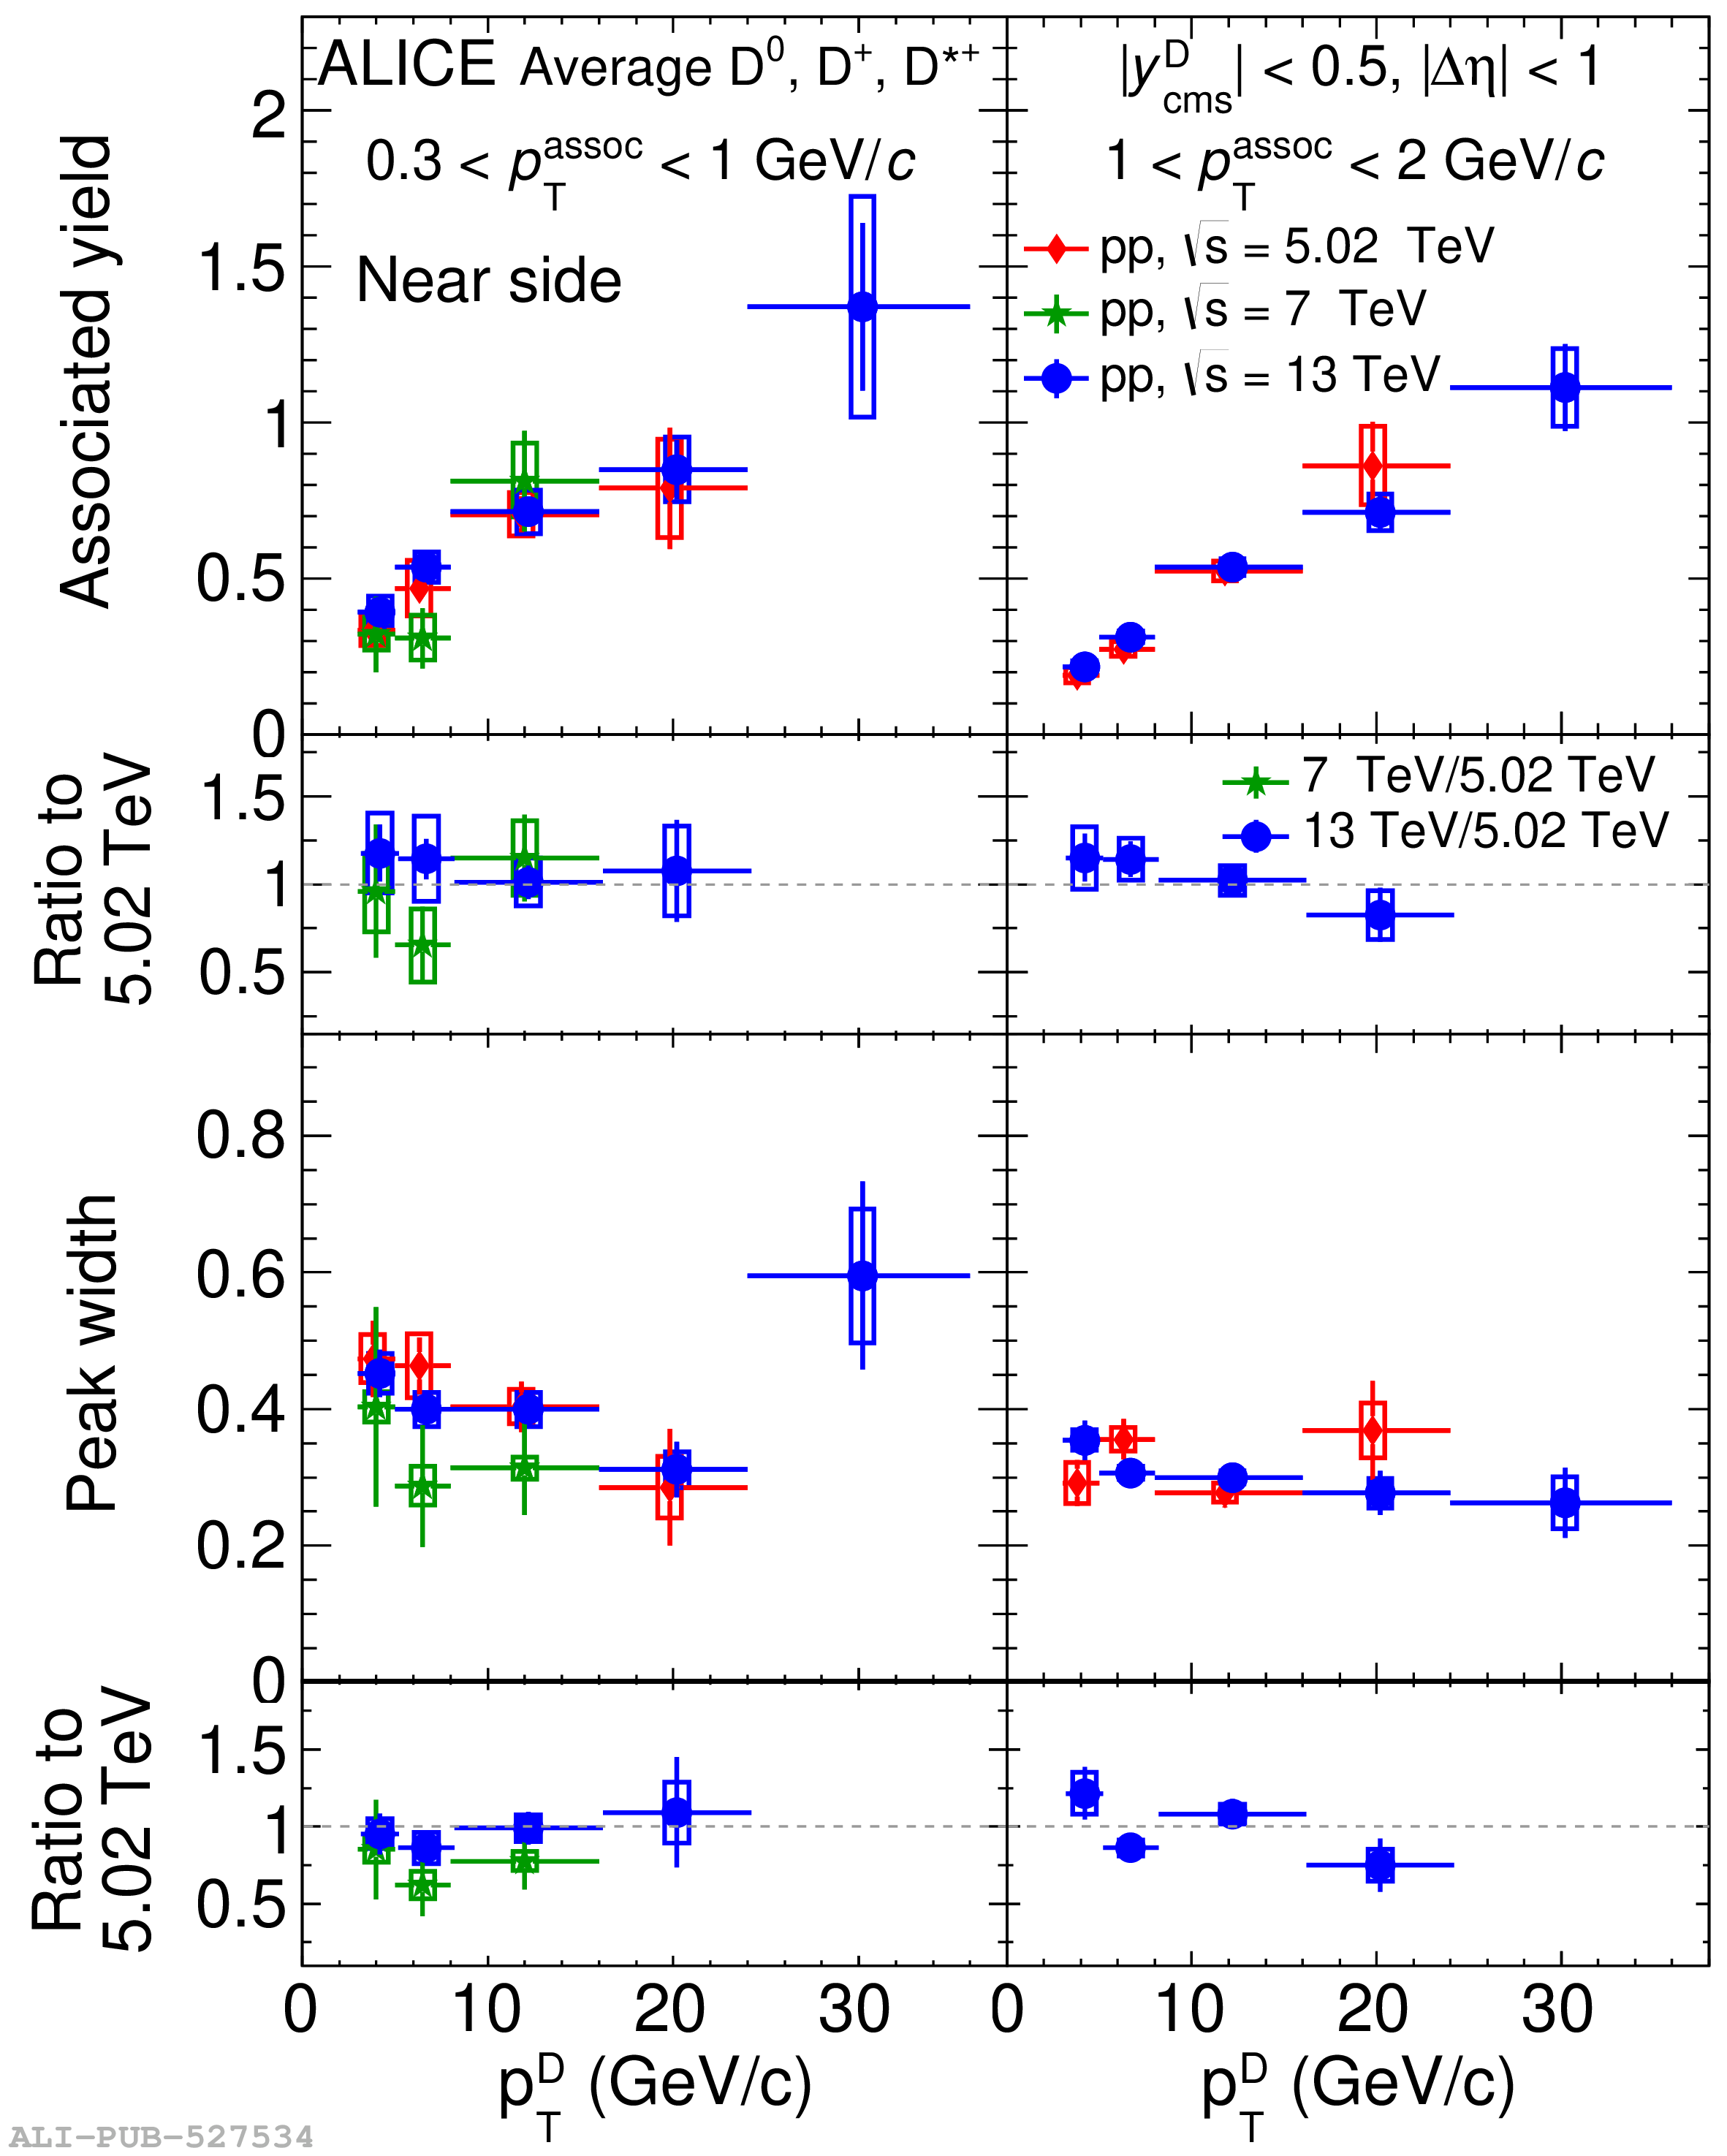 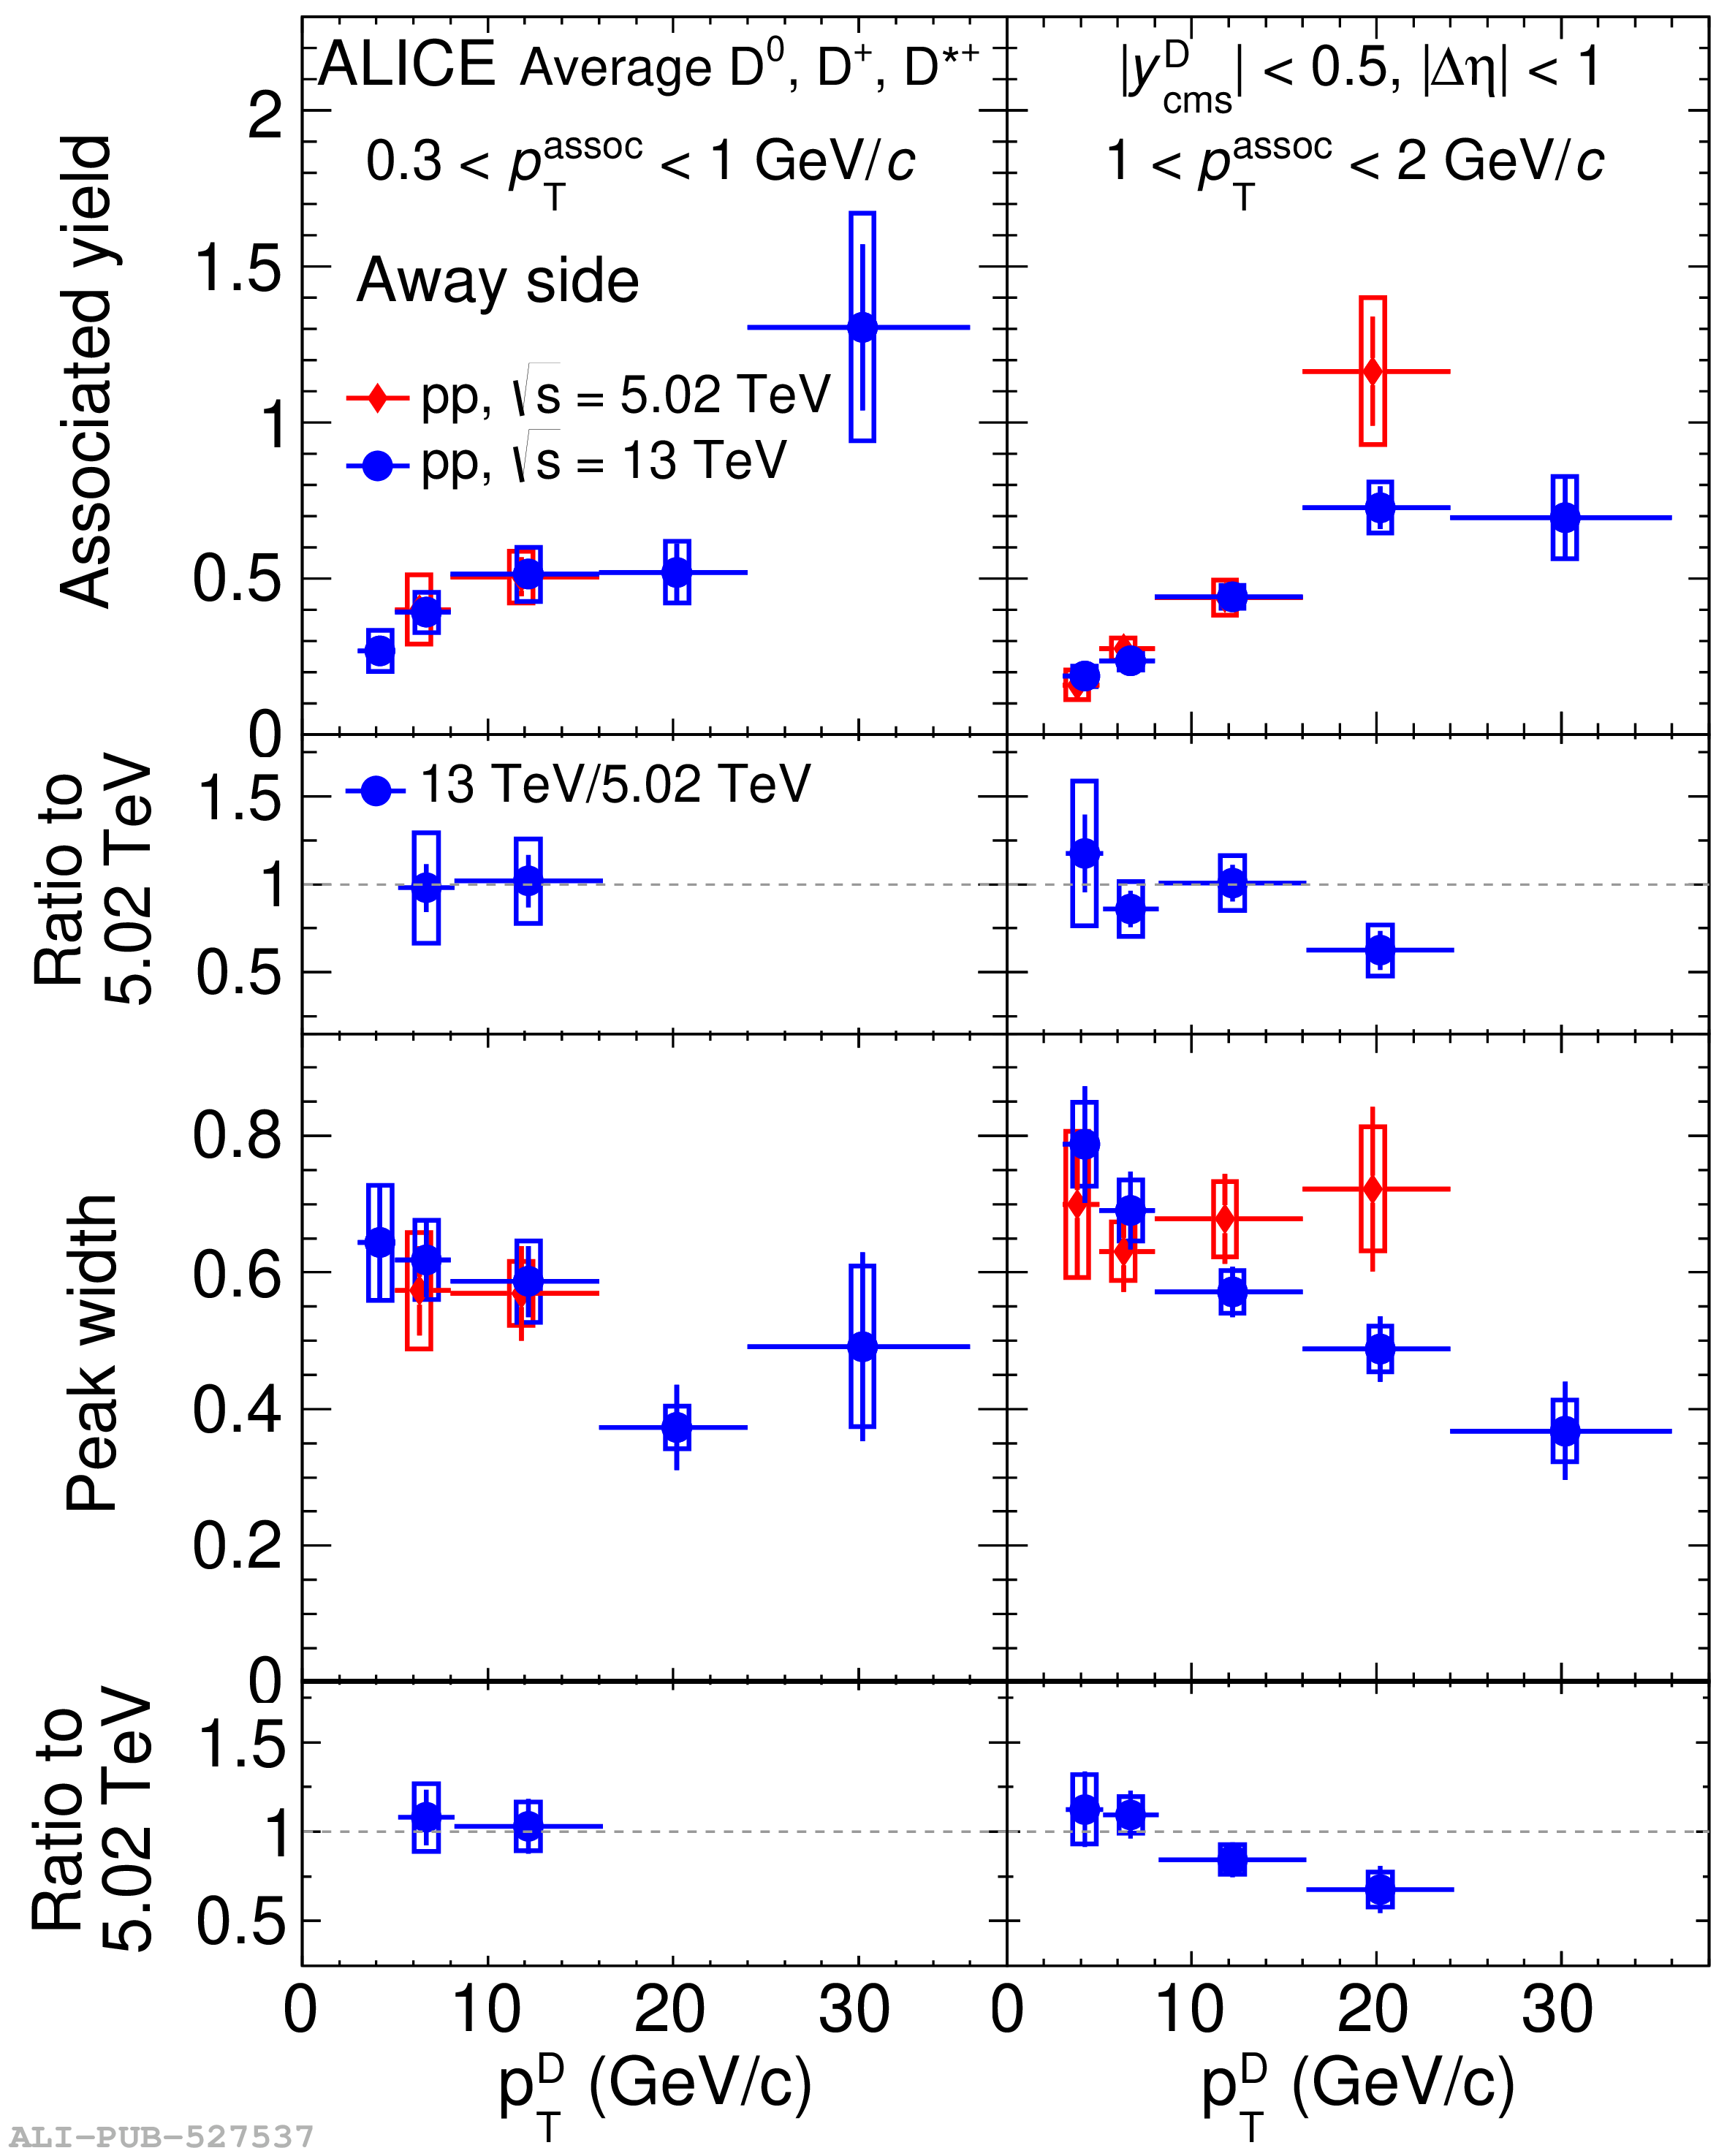 |
Figure 3
Azimuthal-correlation functions of $\Dzero$ mesons with associated particles, after the subtraction of the baseline, in pp collisions at $\sqrt{s}$ = 13 TeV, for 3 $< \ptD <$ 5 \GeVc, 5 $< \ptD <$ 8 \GeVc, 8 $< \ptD <$ 16 \GeVc, and 16 $<\ptD<$ 24 \GeVc (from left to right) and $\ptass>$ 0.3 \GeVc, 0.3 $<\ptass<$ 1 \GeVc, 1 $<\ptass<$ 2 \GeVc, 2 $<\ptass<$ 3 \GeVc (from top to bottom) for different multiplicity classes estimated with V0M. The four multiplicity classes are shown with different marker styles. Statistical and $\Delta\varphi$-dependent systematic uncertainties are shown as vertical error bars and boxes, respectively, and $\Delta\varphi$-independent uncertainties are written as text. The uncertainties from the subtraction of the baseline are displayed as boxes at $\Delta\varphi>\pi$. | 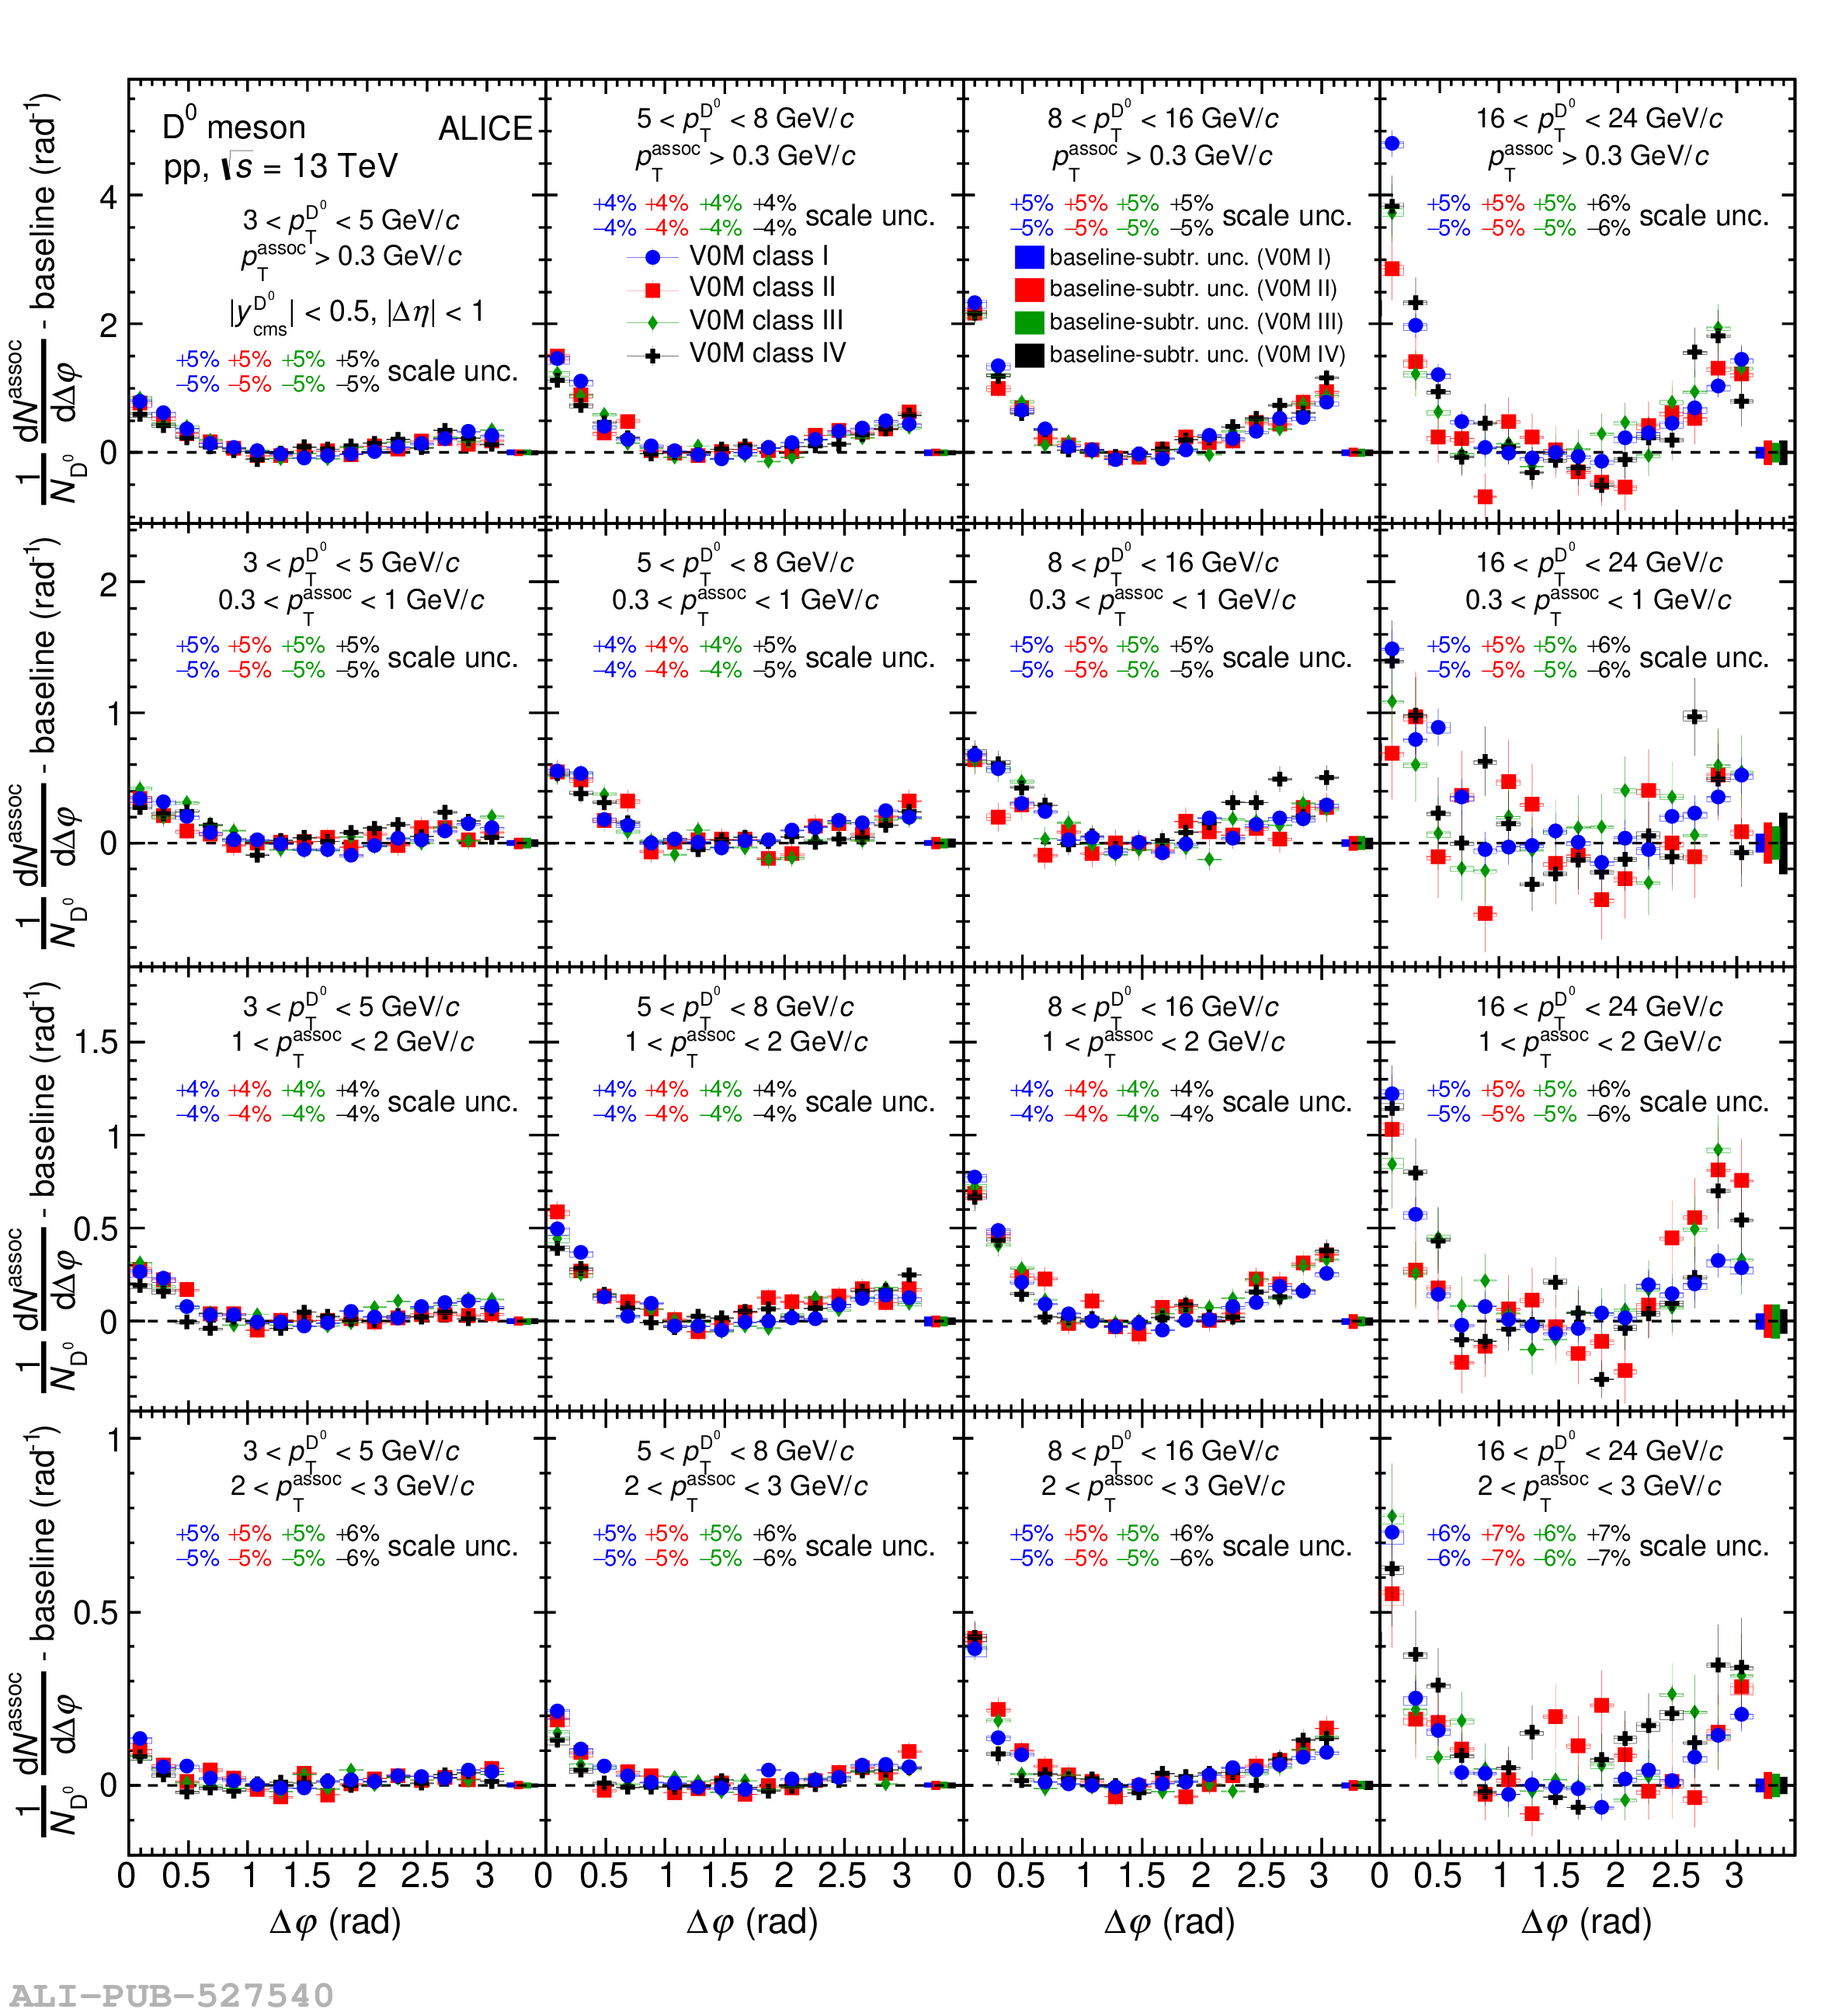 |
Figure 4
Near-side associated peak yields (top row) and widths (third row) measured in pp collisions at $\sqrt{s}$ = 13 TeV, for the four V0M multiplicity classes, shown with different marker styles. The ratios of yield (width) values in each V0M class with respect to those in the V0M class I are shown in the second (fourth) row. Results are presented as a function of the $\Dzero$-meson $\pt$, for $\ptass>$ 0.3 \GeVc and the sub-ranges 0.3 $<\ptass<$ 1 \GeVc, 1 $<\ptass<$ 2 \GeVc, and 2 $<\ptass<$ 3 \GeVc (from left to right). Statistical and systematic uncertainties are shown as vertical error bars and boxes, respectively. | 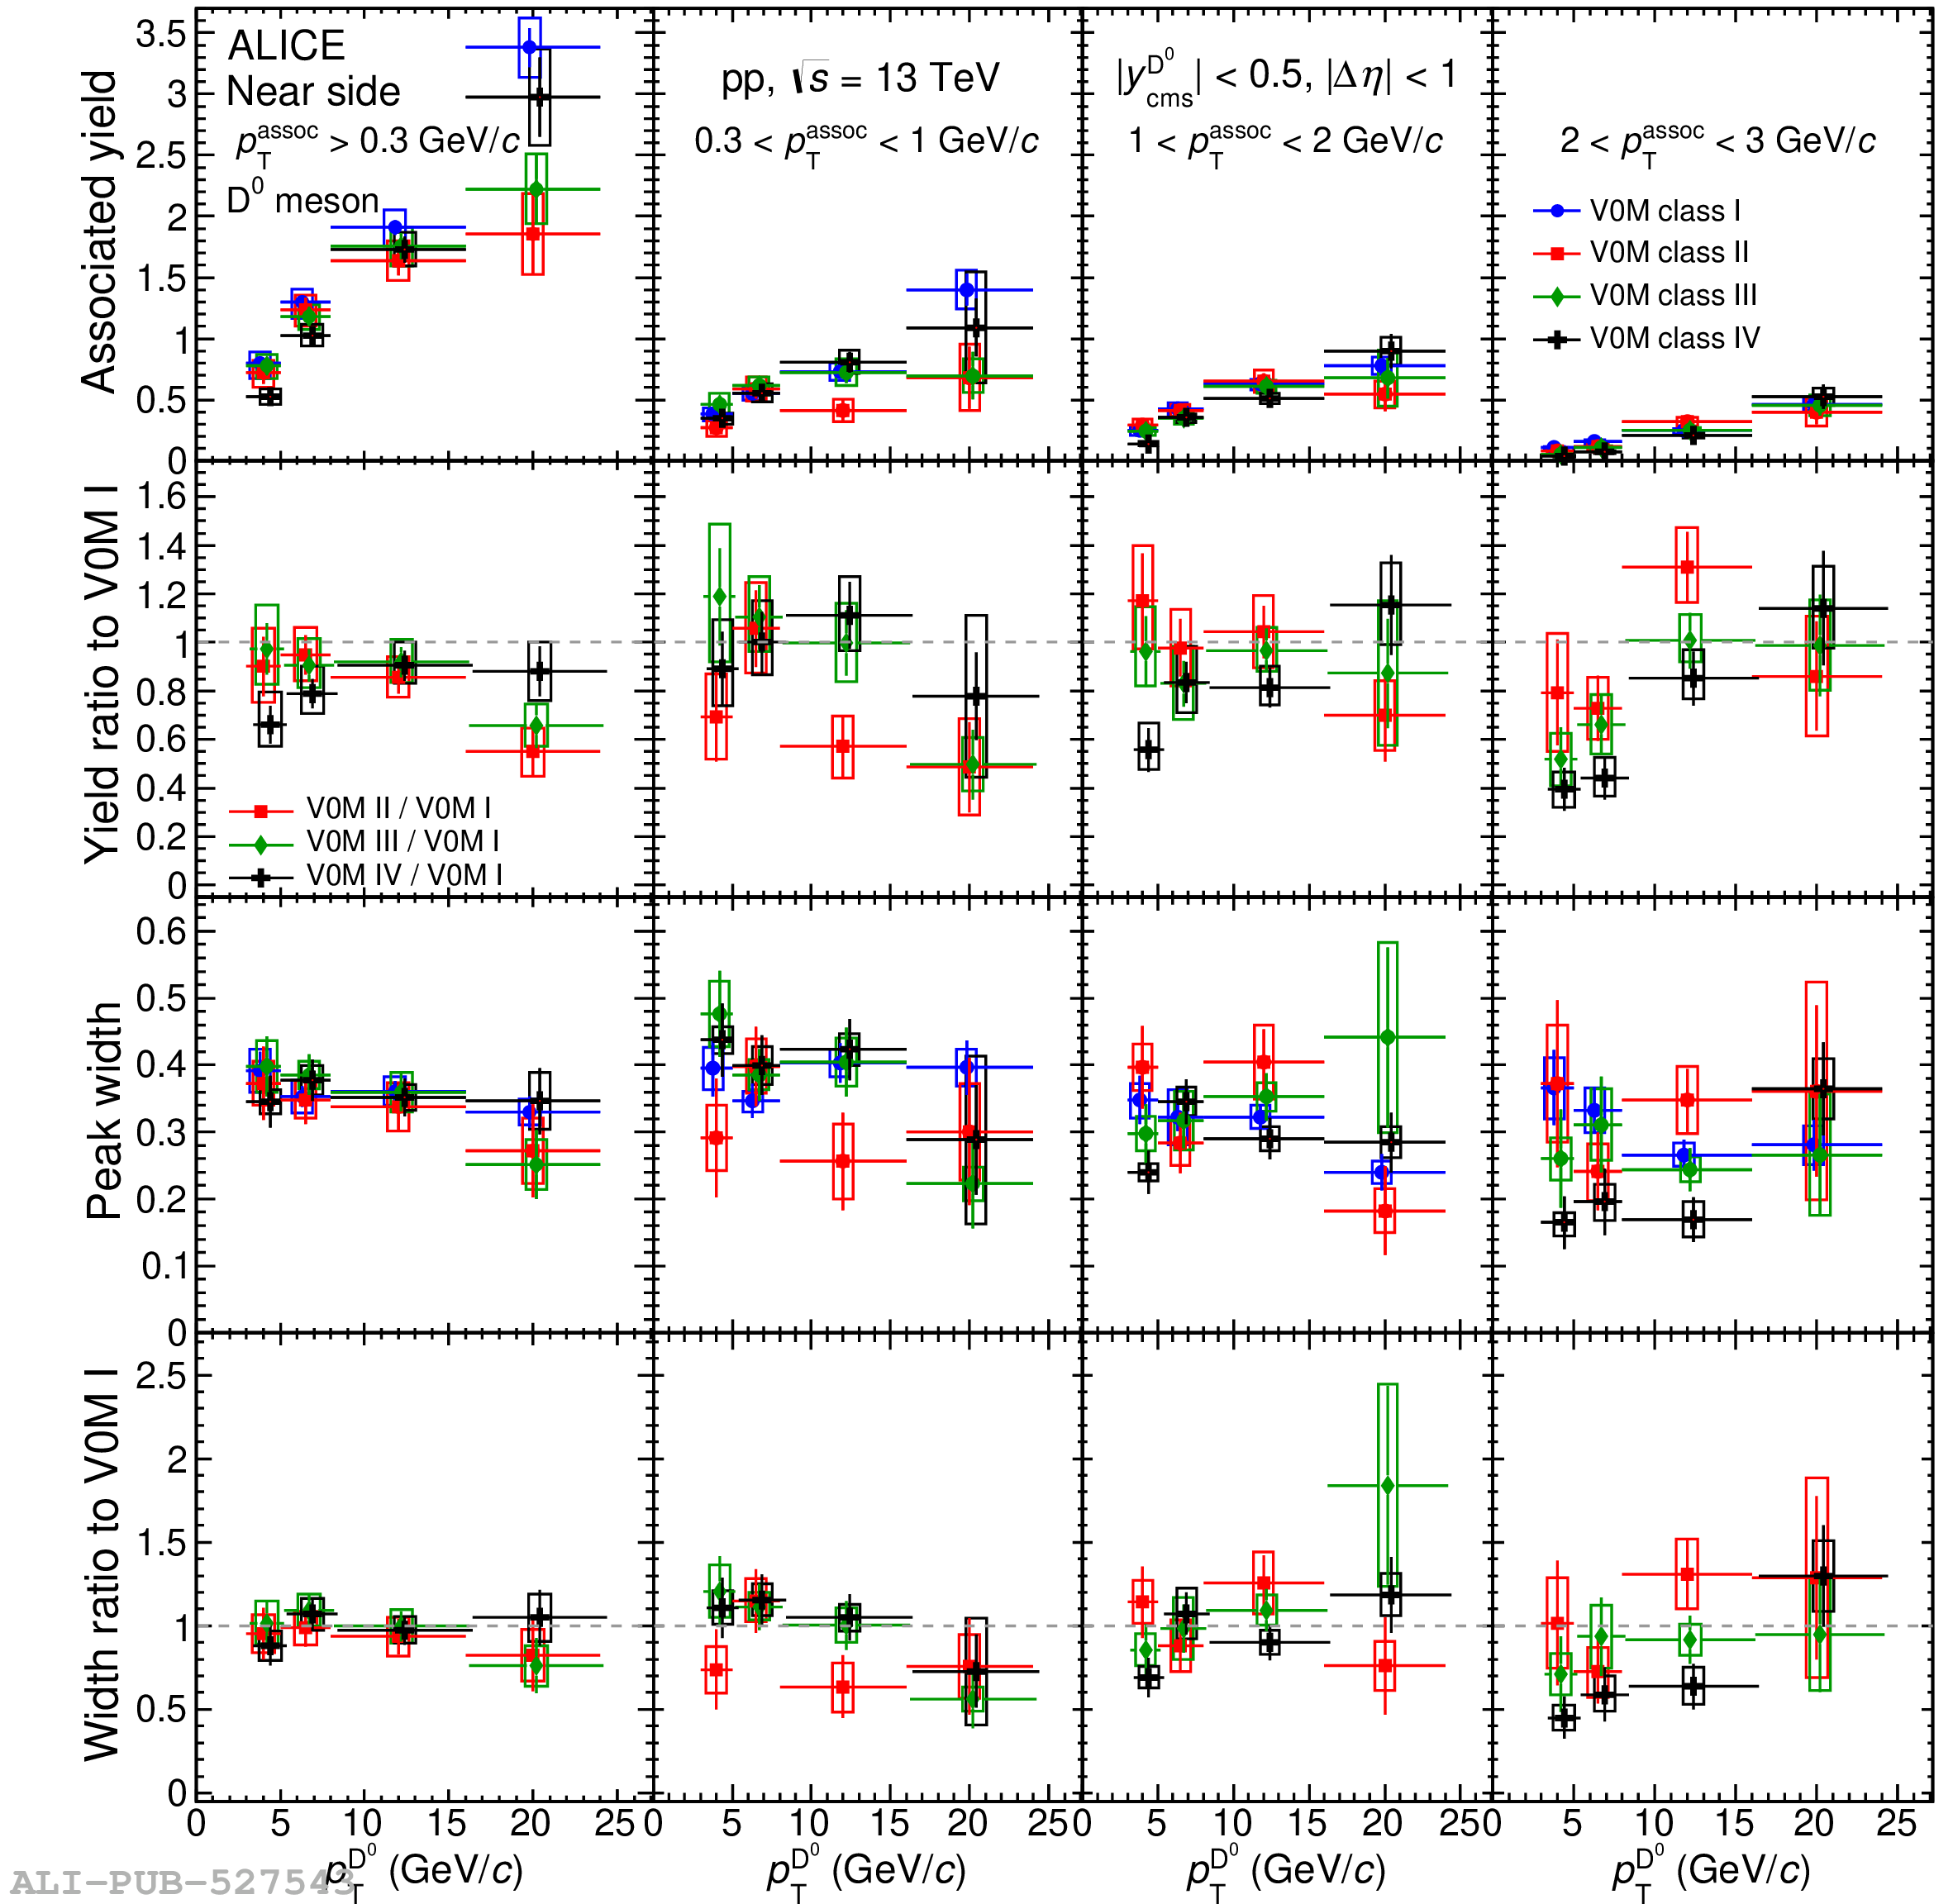 |
Figure 5
Away-side associated peak yields (left) and widths (right) measured in pp collisions at $\sqrt{s}$ = 13 TeV, for the four V0M multiplicity classes, shown with different marker styles. The ratios of the observable values in each V0M class with respect to those in V0M class I are represented in the bottom insets. Results are presented as a function of the $\Dzero$-meson $\pt$, for $\ptass>$ 0.3 \GeVc. Statistical and systematic uncertainties are shown as vertical error bars and boxes, respectively. | 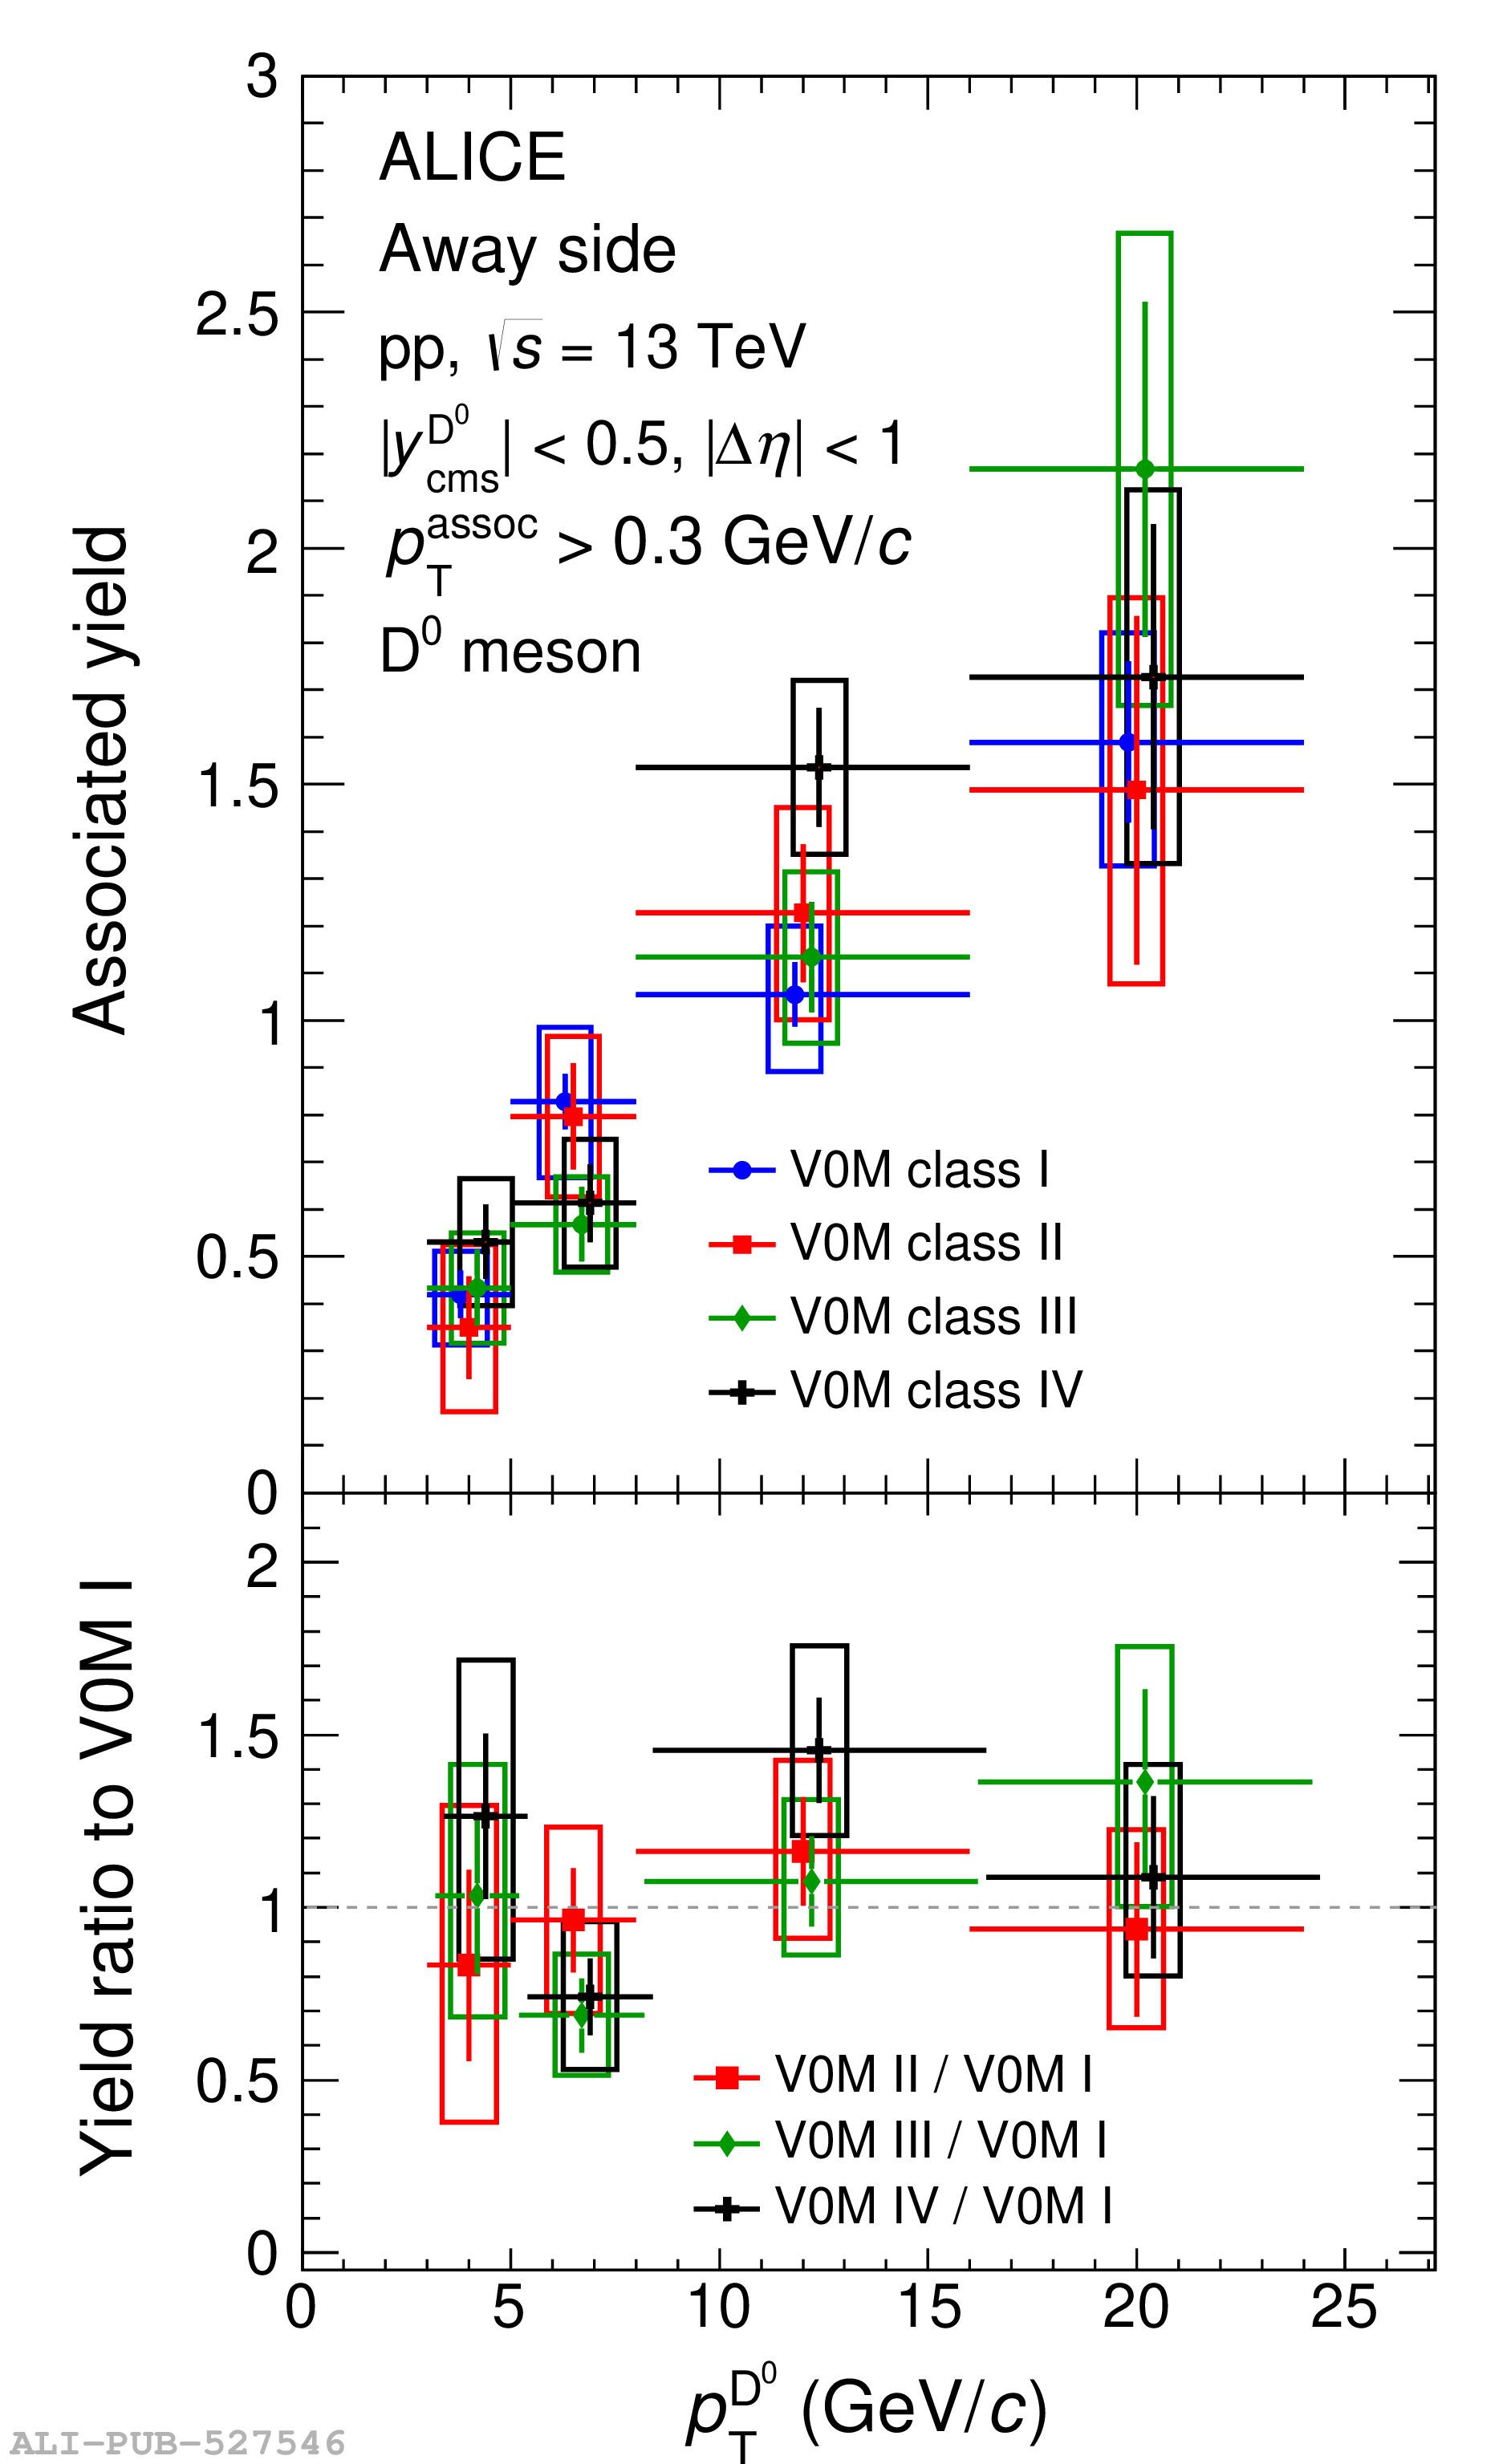 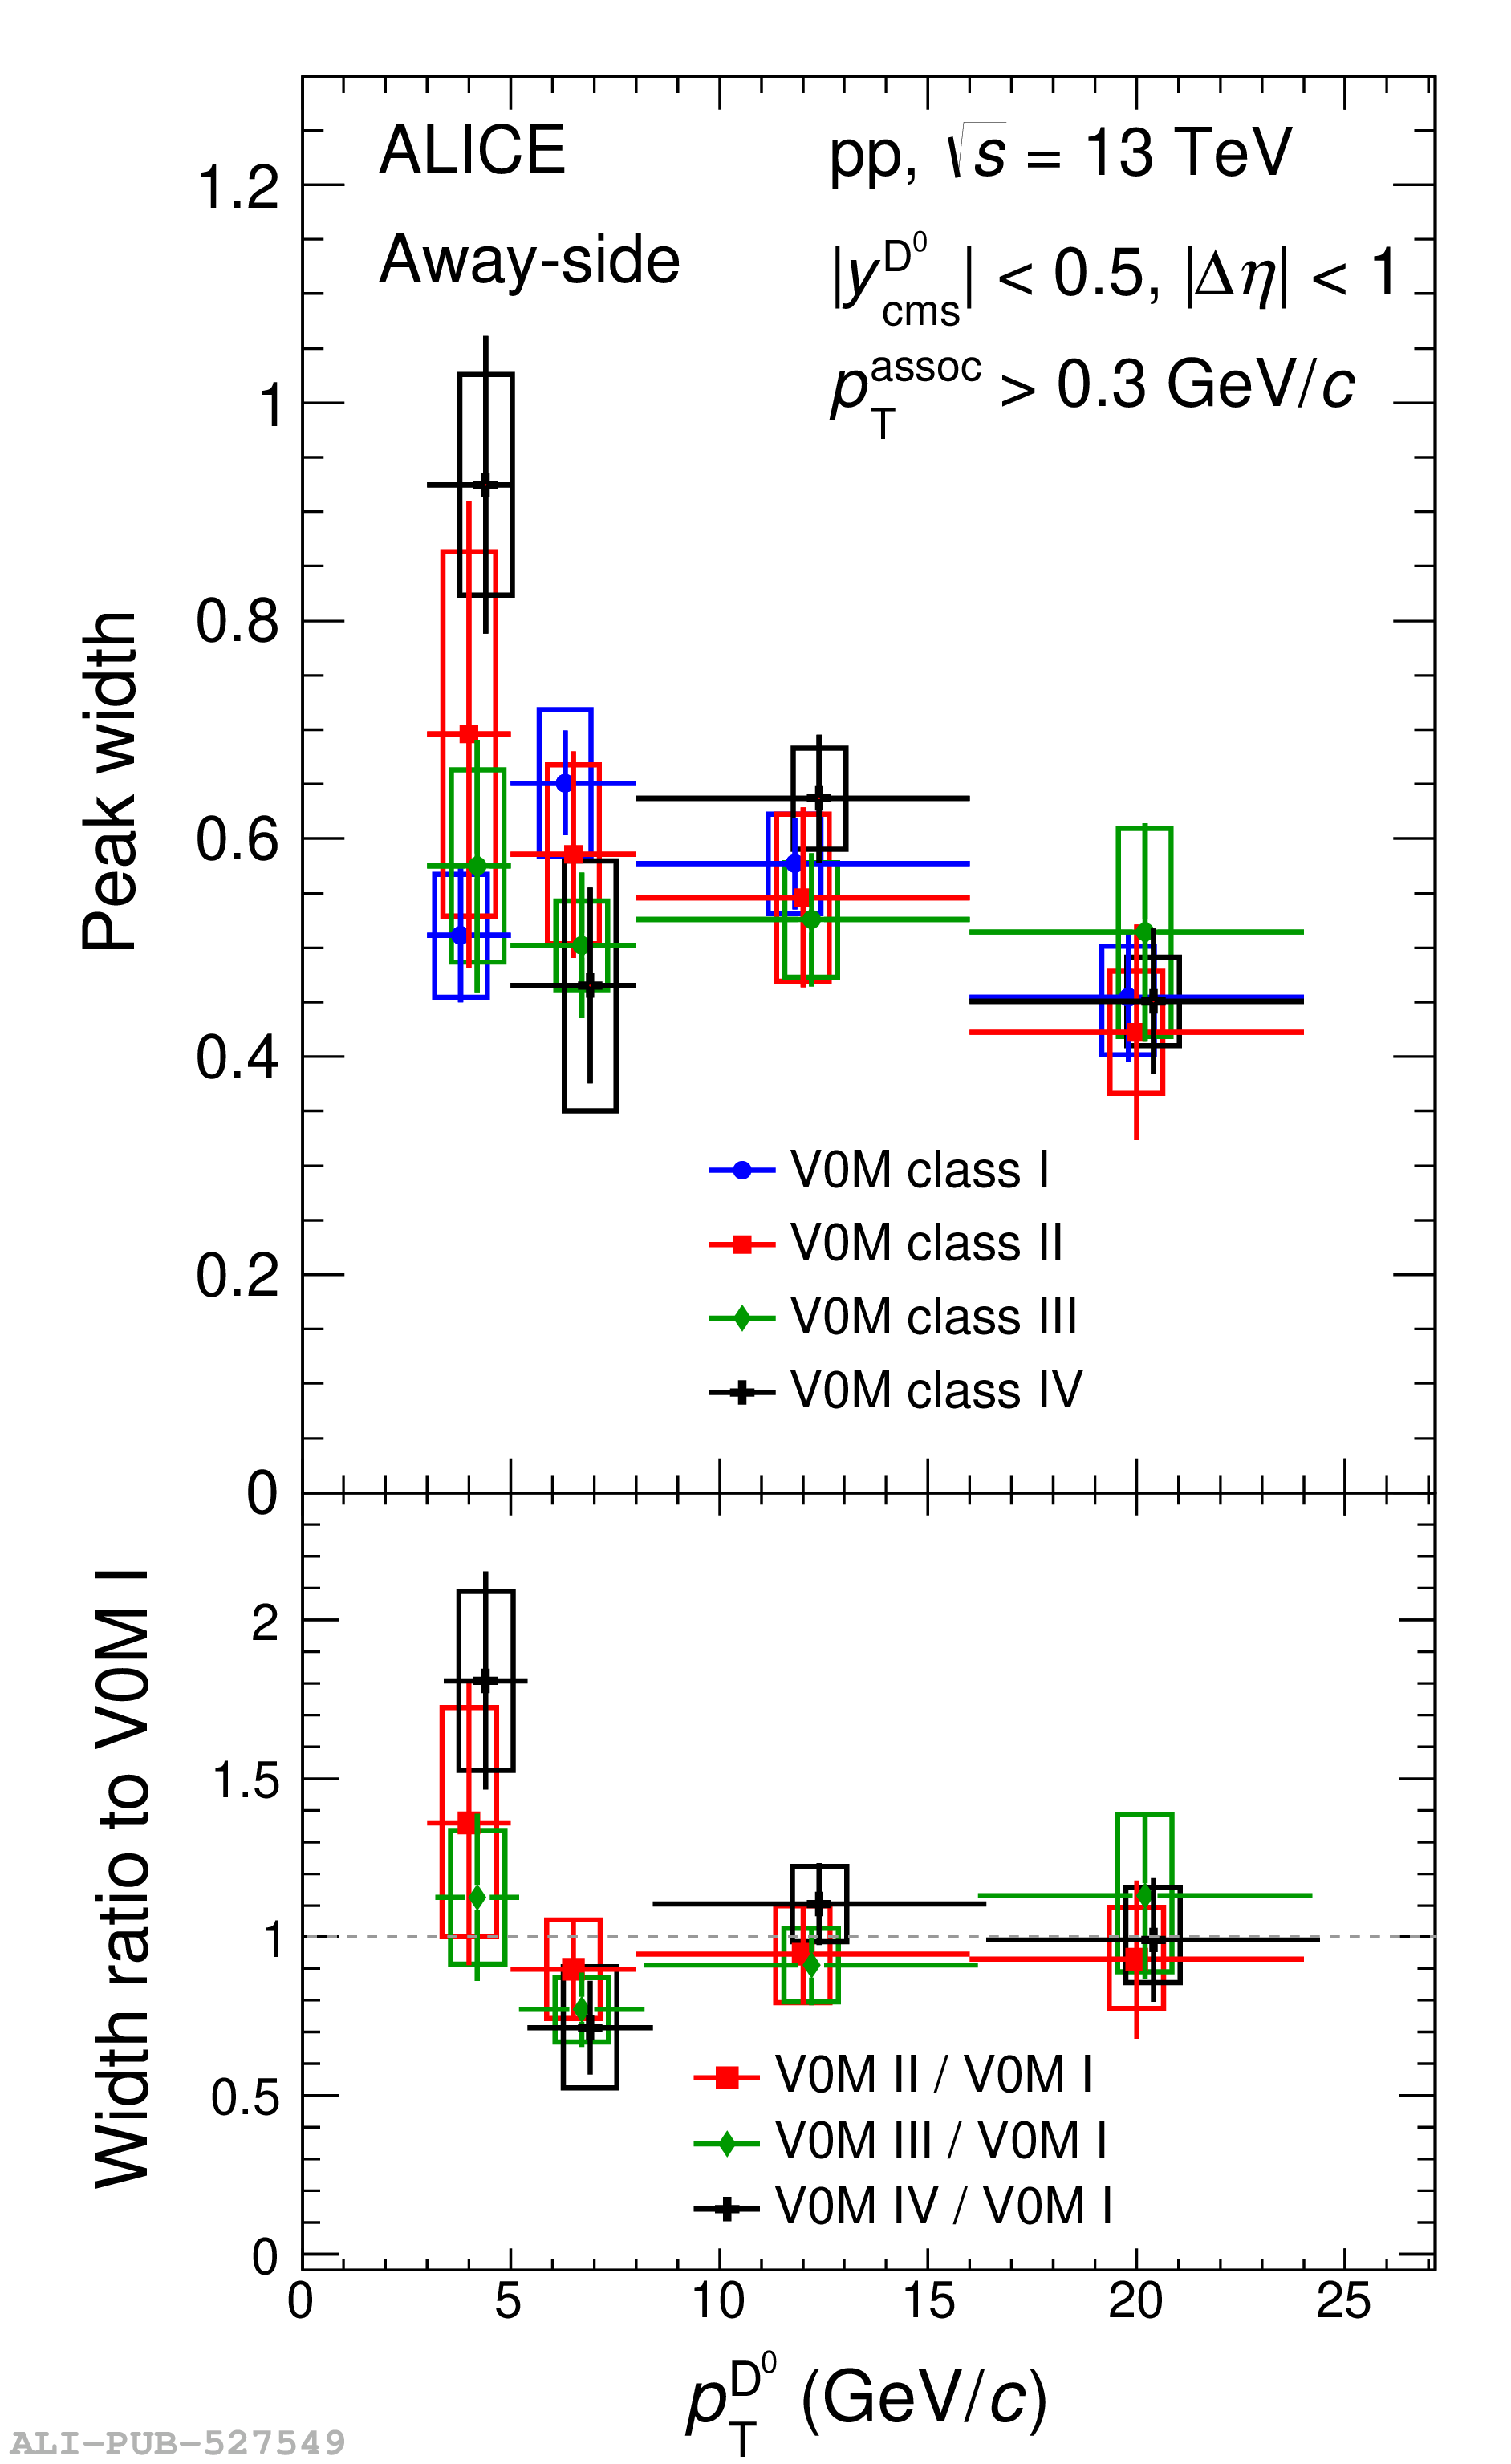 |
Figure 6
Near-side associated peak yields (top row) and widths (third row down) in pp collisions at $\sqrt{s}$ = 13 TeV, compared with predictions by PYTHIA, POWHEG+PYTHIA8, HERWIG, and EPOS 3 event generators with various configurations. Results are presented as a function of the D-meson $\pt$, for $\ptass>$ 0.3 \GeVc, $0.3 < \ptass < 1$ \GeVc, $1 < \ptass < 2$ \GeVc, and $2 < \ptass < 3$ \GeVc (from left to right). The ratios of model predictions to data measurements for yield (width) values are shown in the second (fourth) row down. In these rows, model statistical and systematic uncertainties are shown as vertical error bars and boxes, respectively, while data total uncertainties are displayed as a solid band. | 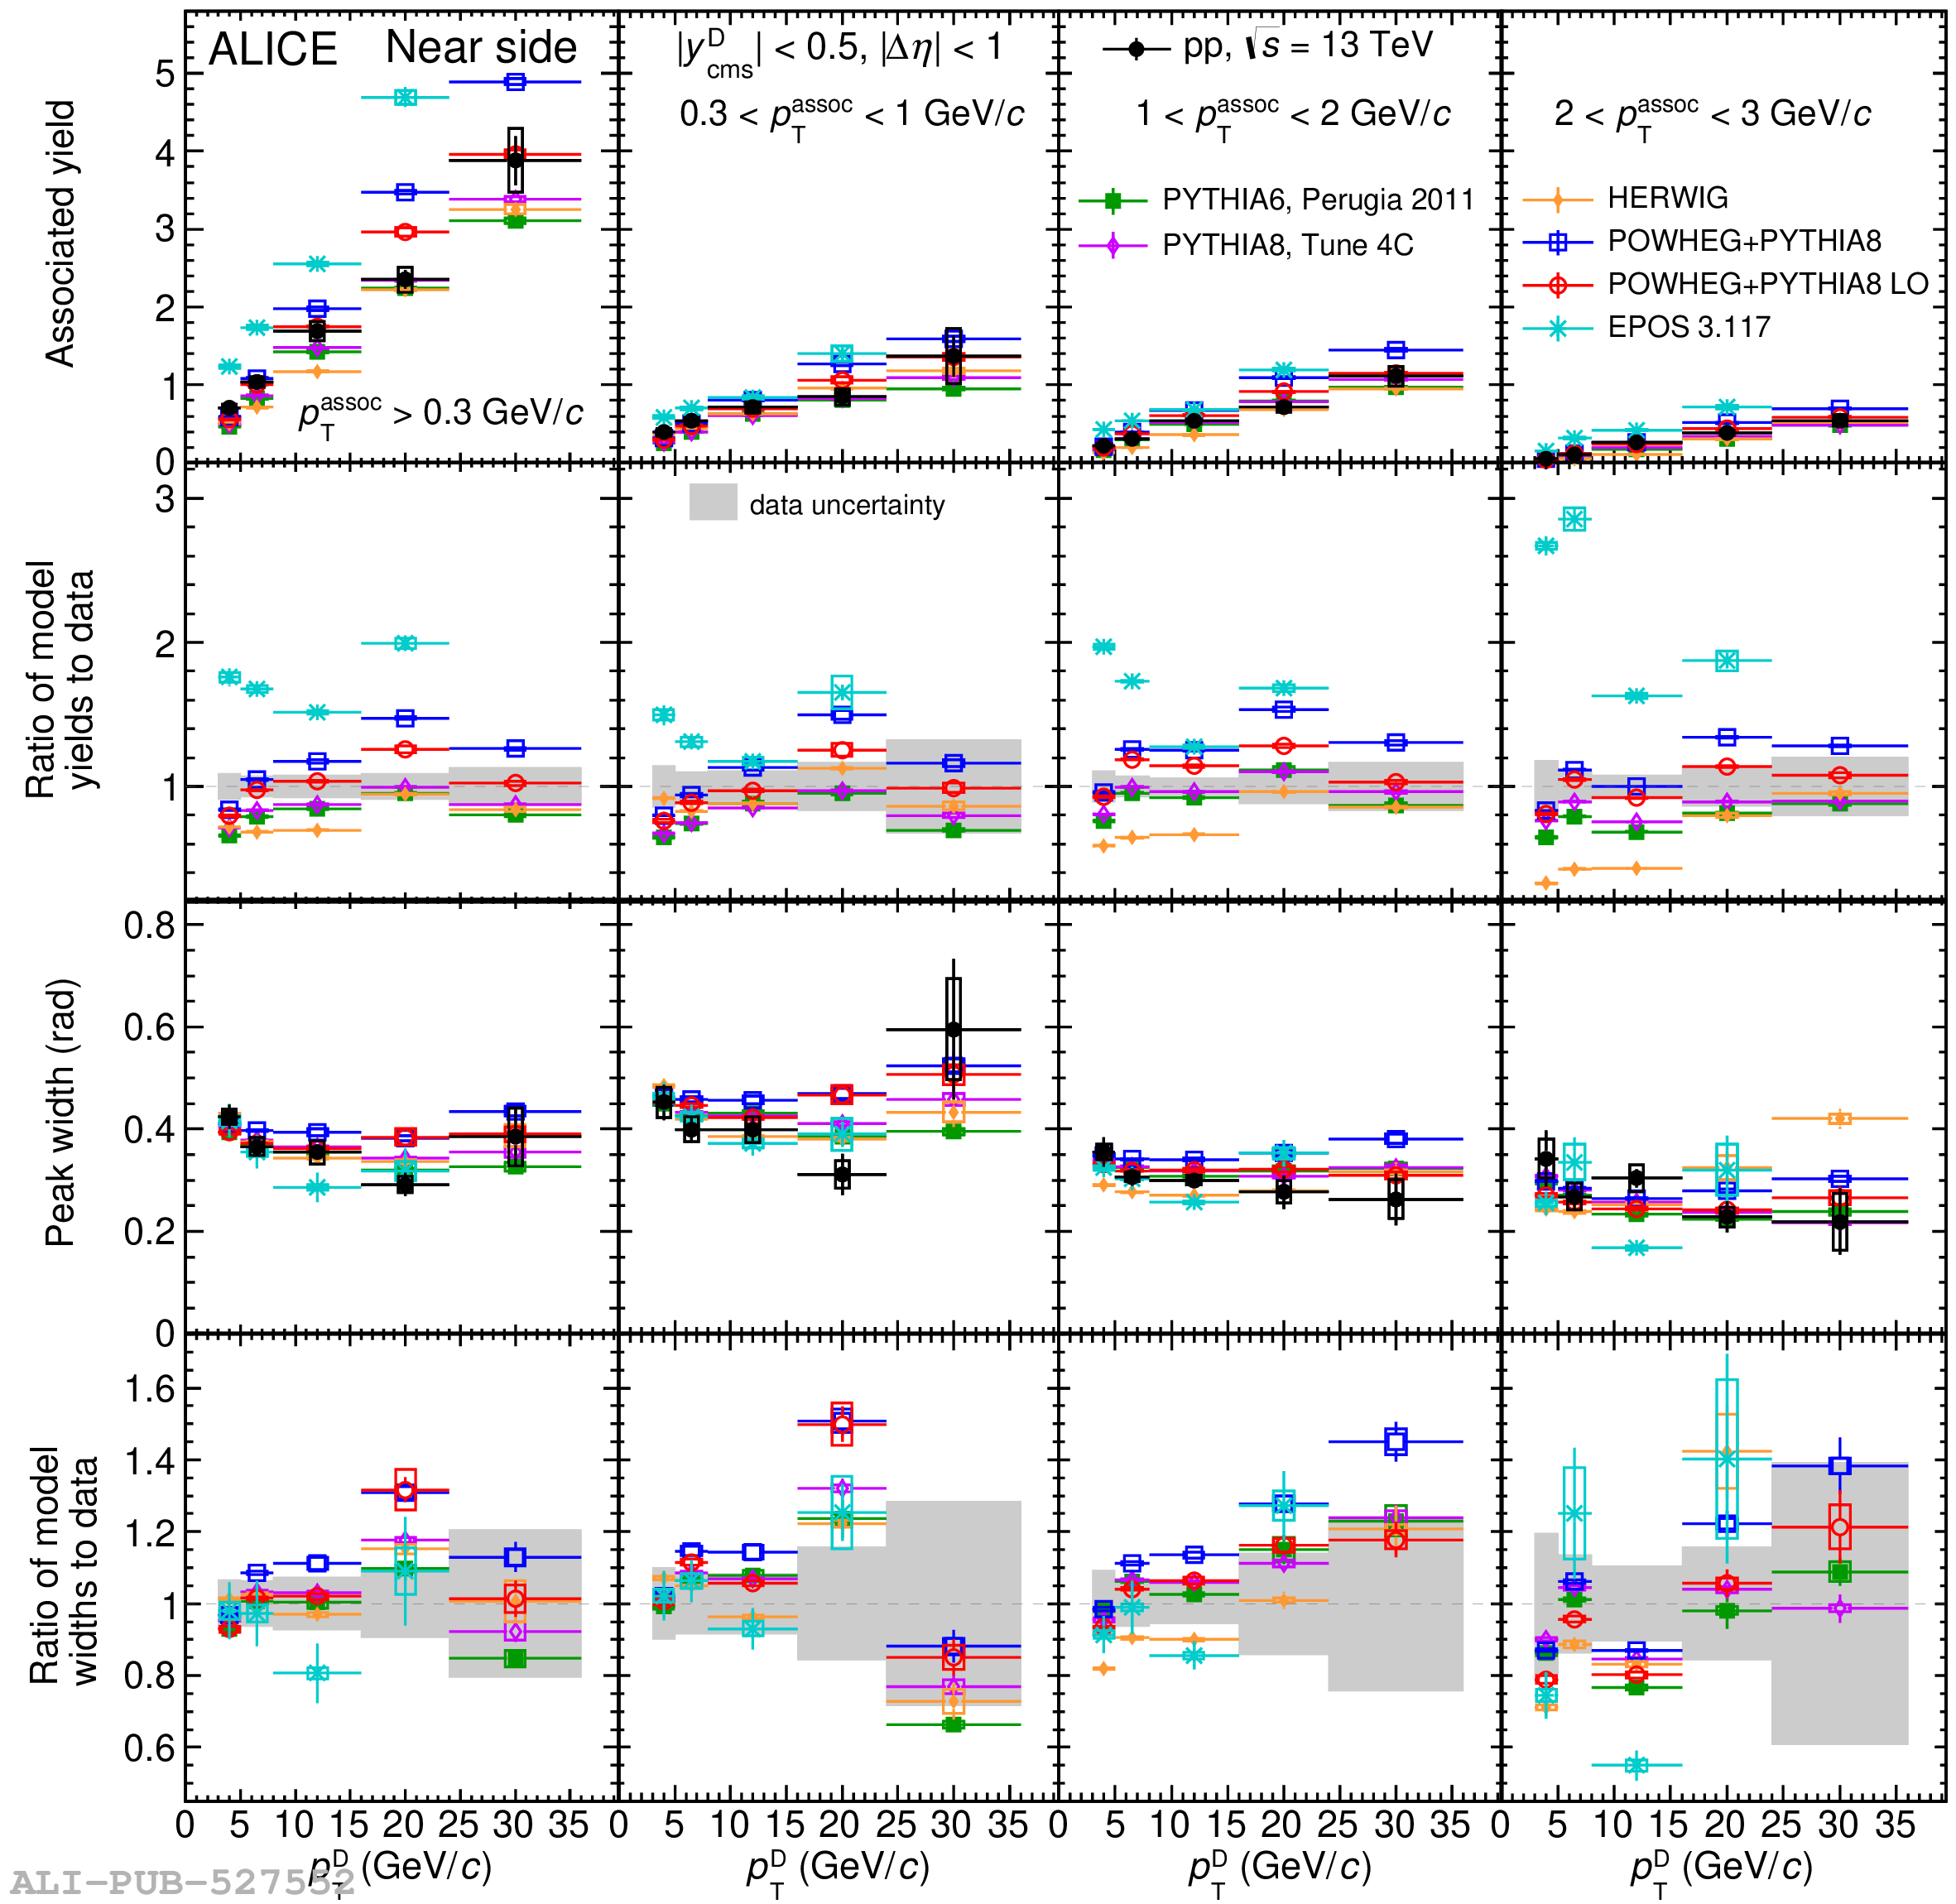 |
Figure 7
Away-side associated peak yields (top row) and widths (third row down) in pp collisions at $\sqrt{s}$ = 13 TeV, compared with predictions by PYTHIA, POWHEG+PYTHIA8, HERWIG, and EPOS 3 event generators with various configurations. Results are presented as a function of the D-meson $\pt$, for $\ptass>$ 0.3 \GeVc, $0.3 < \ptass < 1$ \GeVc, $1 < \ptass < 2$ \GeVc, and $2 < \ptass < 3$ \GeVc (from left to right). The ratios of model predictions to data measurements for yield (width) values are shown in the second (fourth) row down. In these rows, model statistical and systematic uncertainties are shown as vertical error bars and boxes, respectively, while data total uncertainties are displayed as a solid band. |  |
Figure 8
Near- and away-side peak yields (first column), widths (second column), near-side peak $\beta$ parameter and baseline (third column) from fits to the D-meson and charged particle azimuthal-correlation function, from PYTHIA8 simulations obtained with different parton-level contributions. The predictions are obtained for multiplicity-integrated \pp collisions at $\s = 13$ \TeV, as a function of the D-meson $\pt$, for $\ptass > 0.3$ \GeVc, and compared with ALICE data. | 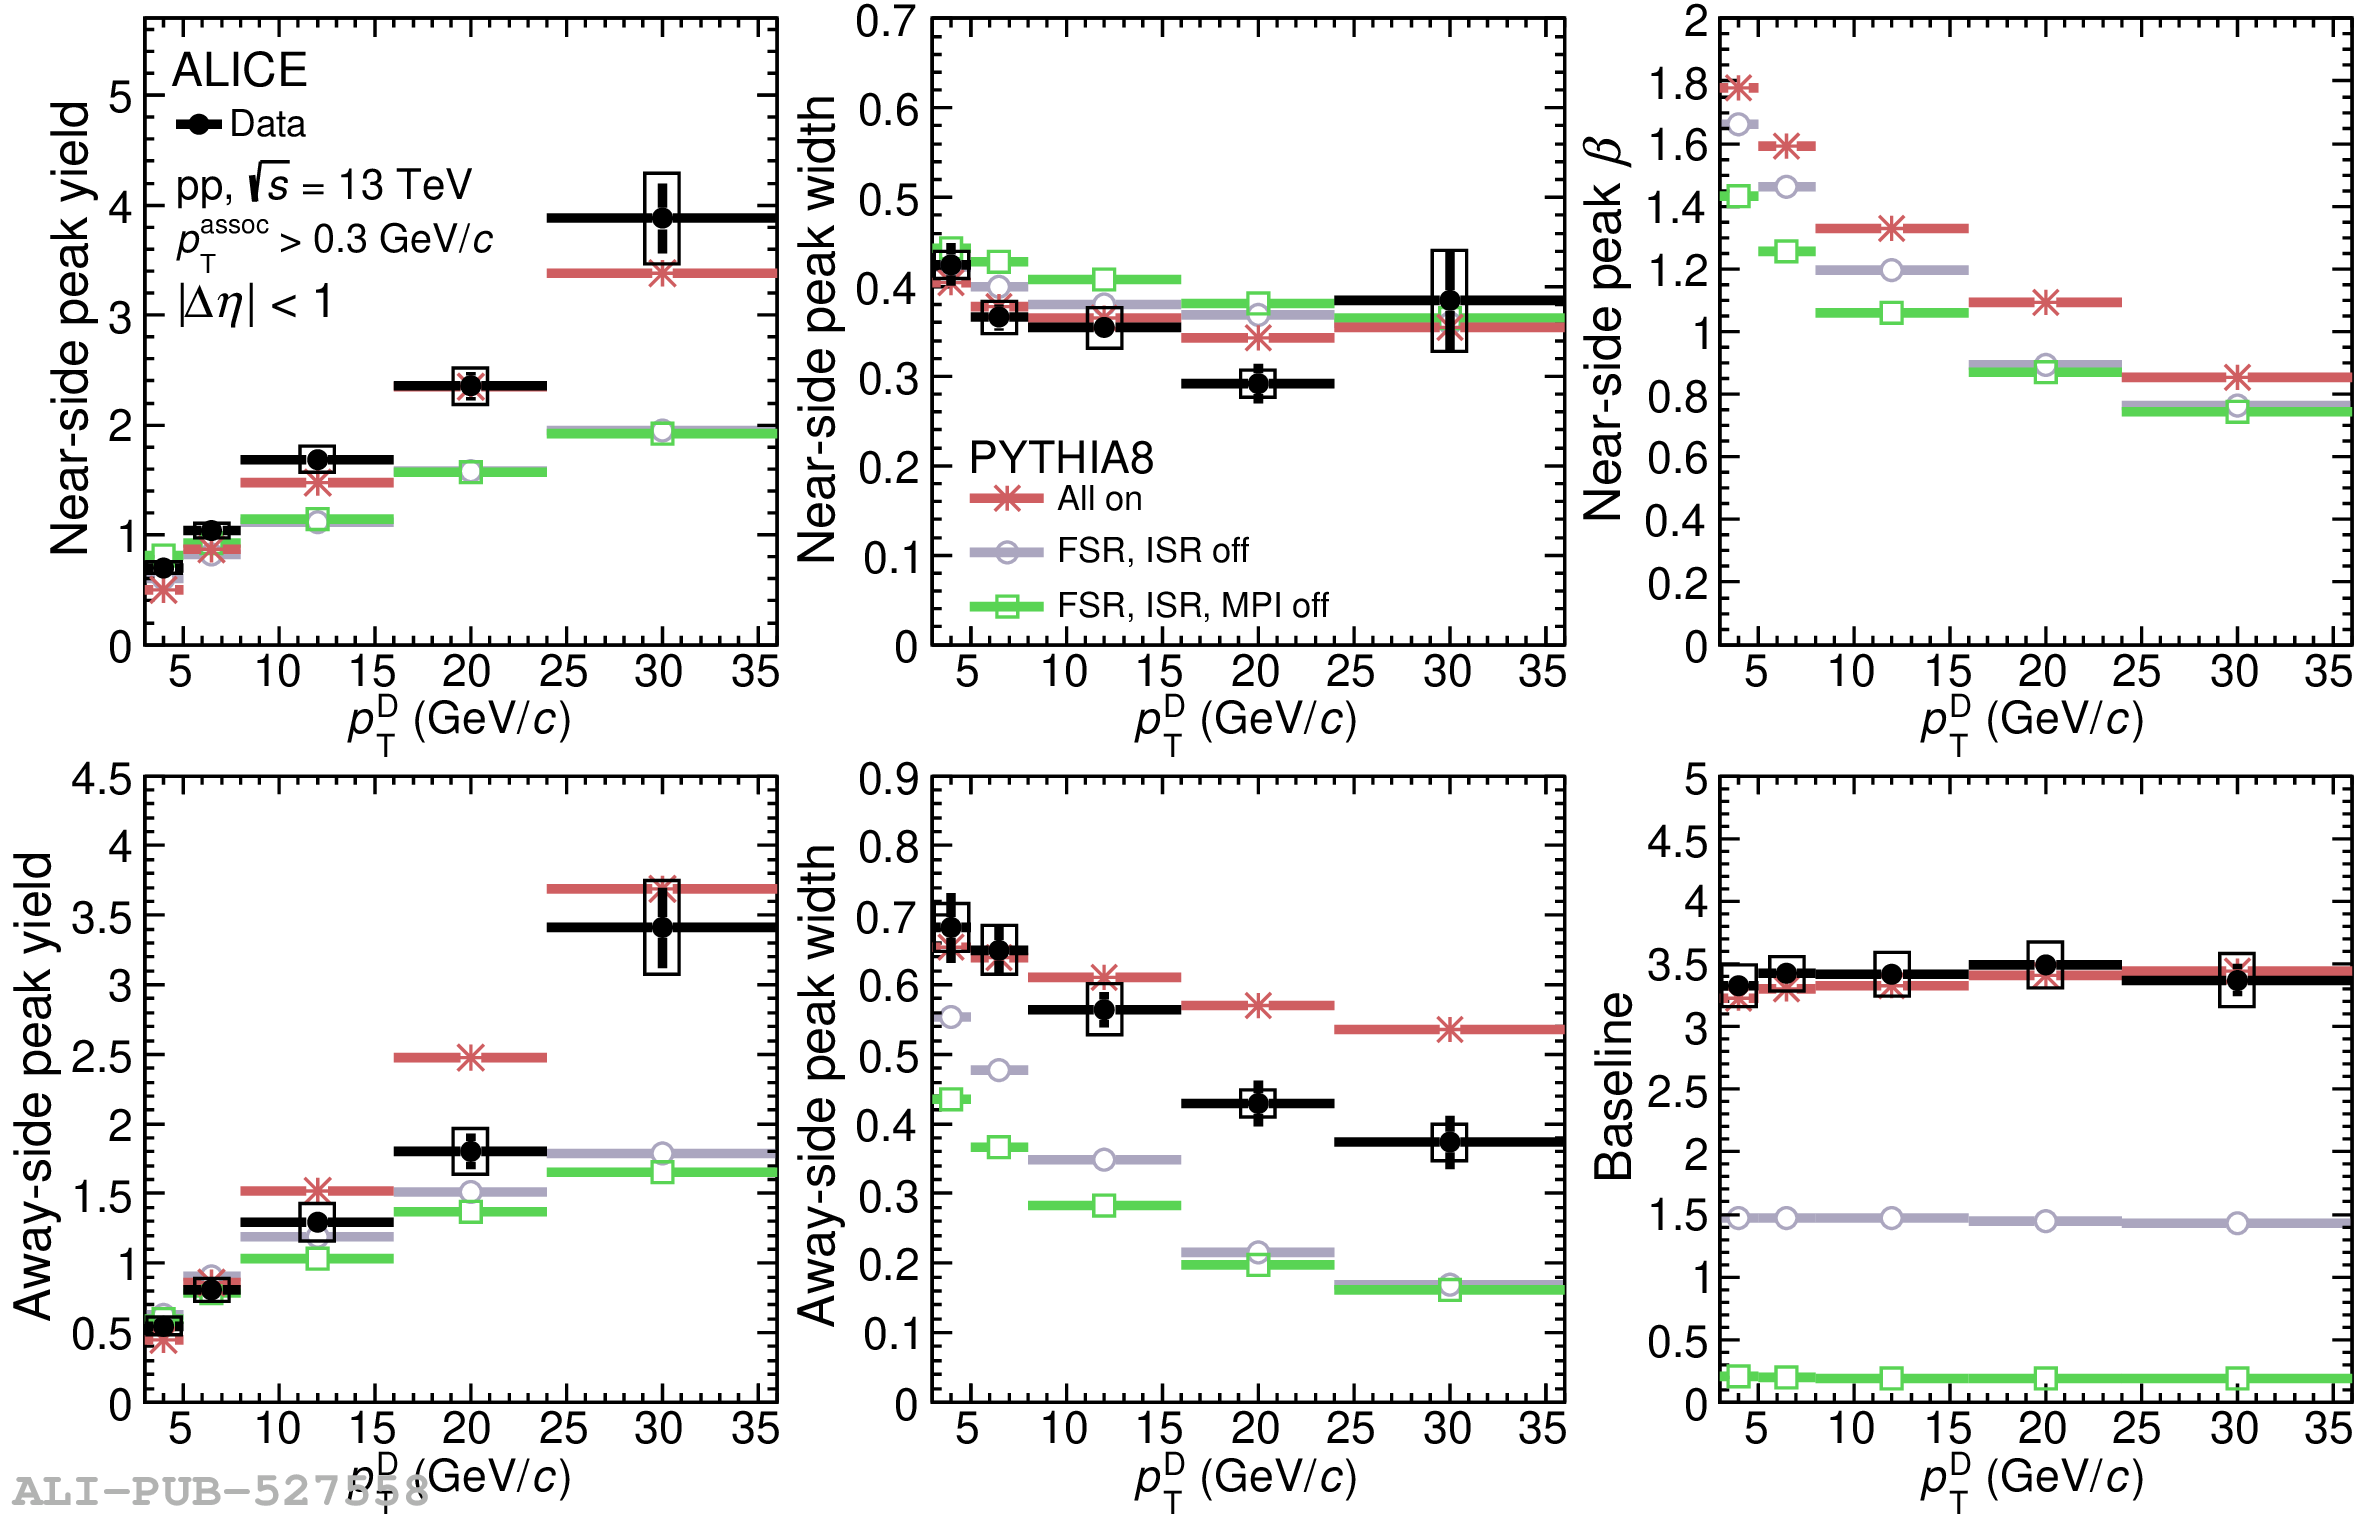 |
Figure 9
Near- and away-side peak yields (first column), widths (second column), near-side peak $\beta$ parameter and baseline (third column) from fits to the D-meson and charged particle azimuthal-correlation function, from POWHEG+PYTHIA8 simulations obtained with different parton-level contributions. The predictions are obtained for multiplicity-integrated in \pp collisions at $\s = 13$ \TeV, as a function of the D-meson $\pt$, for $\ptass > 0.3$ \GeVc, and compared with ALICE data. | 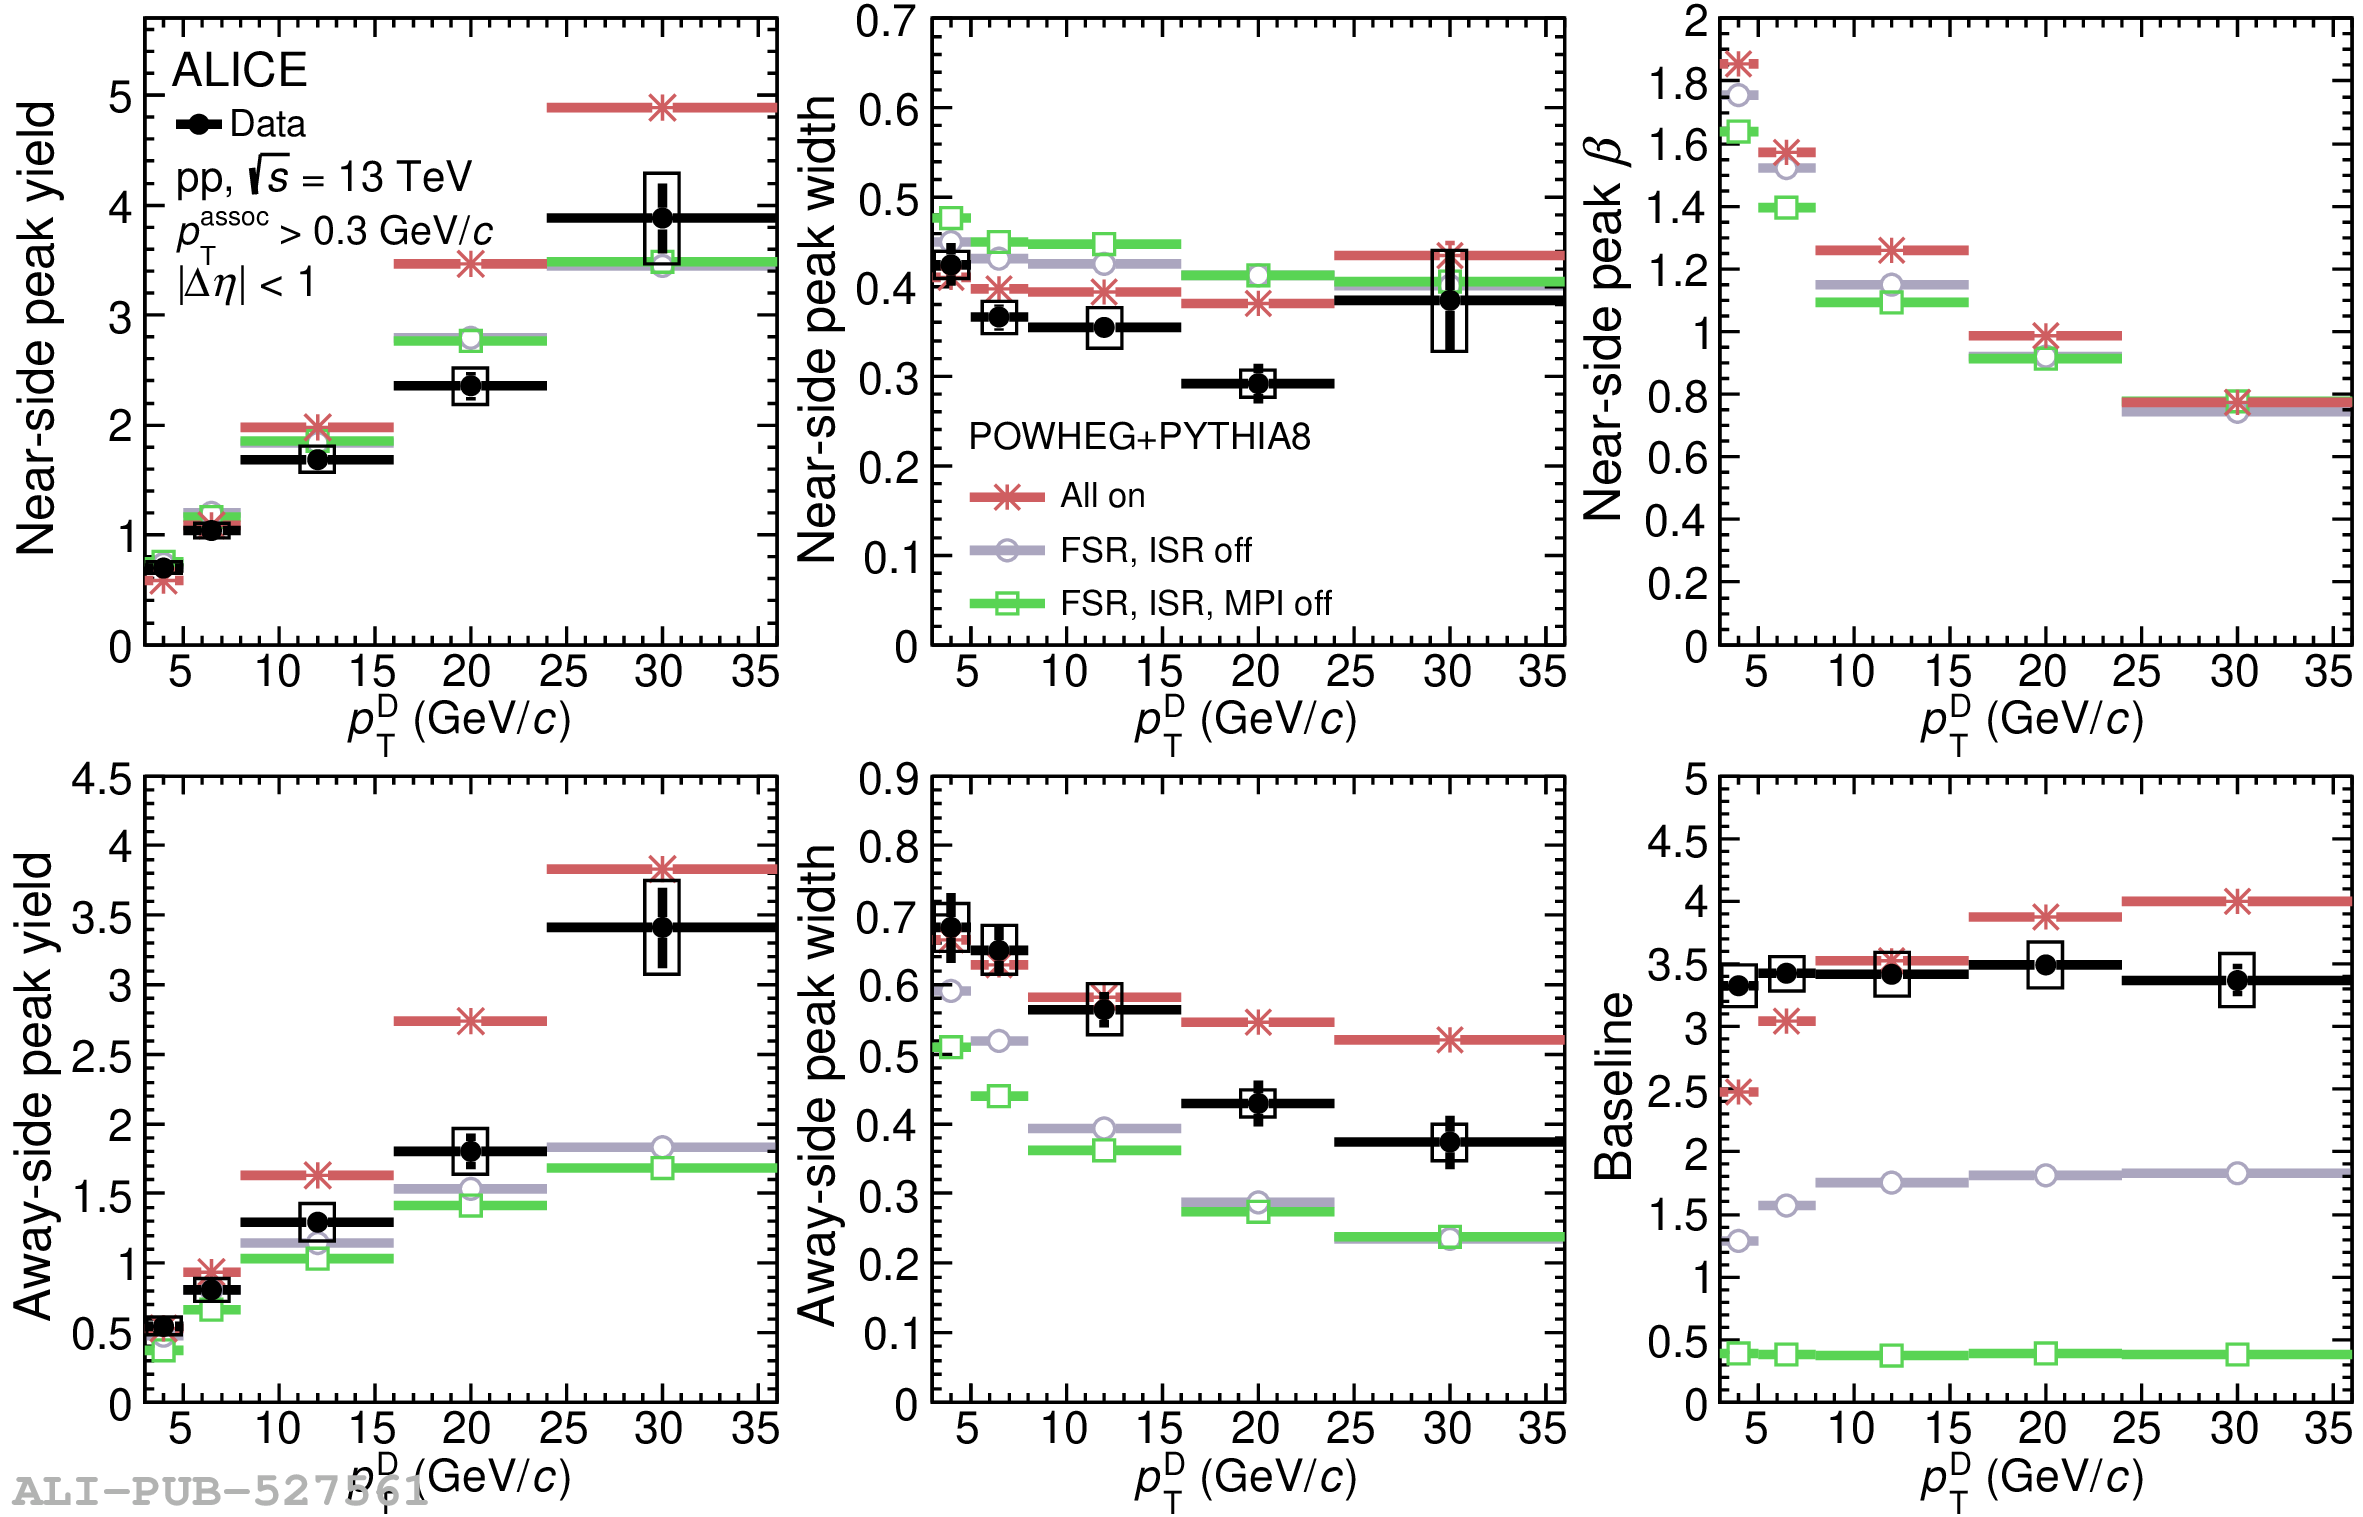 |
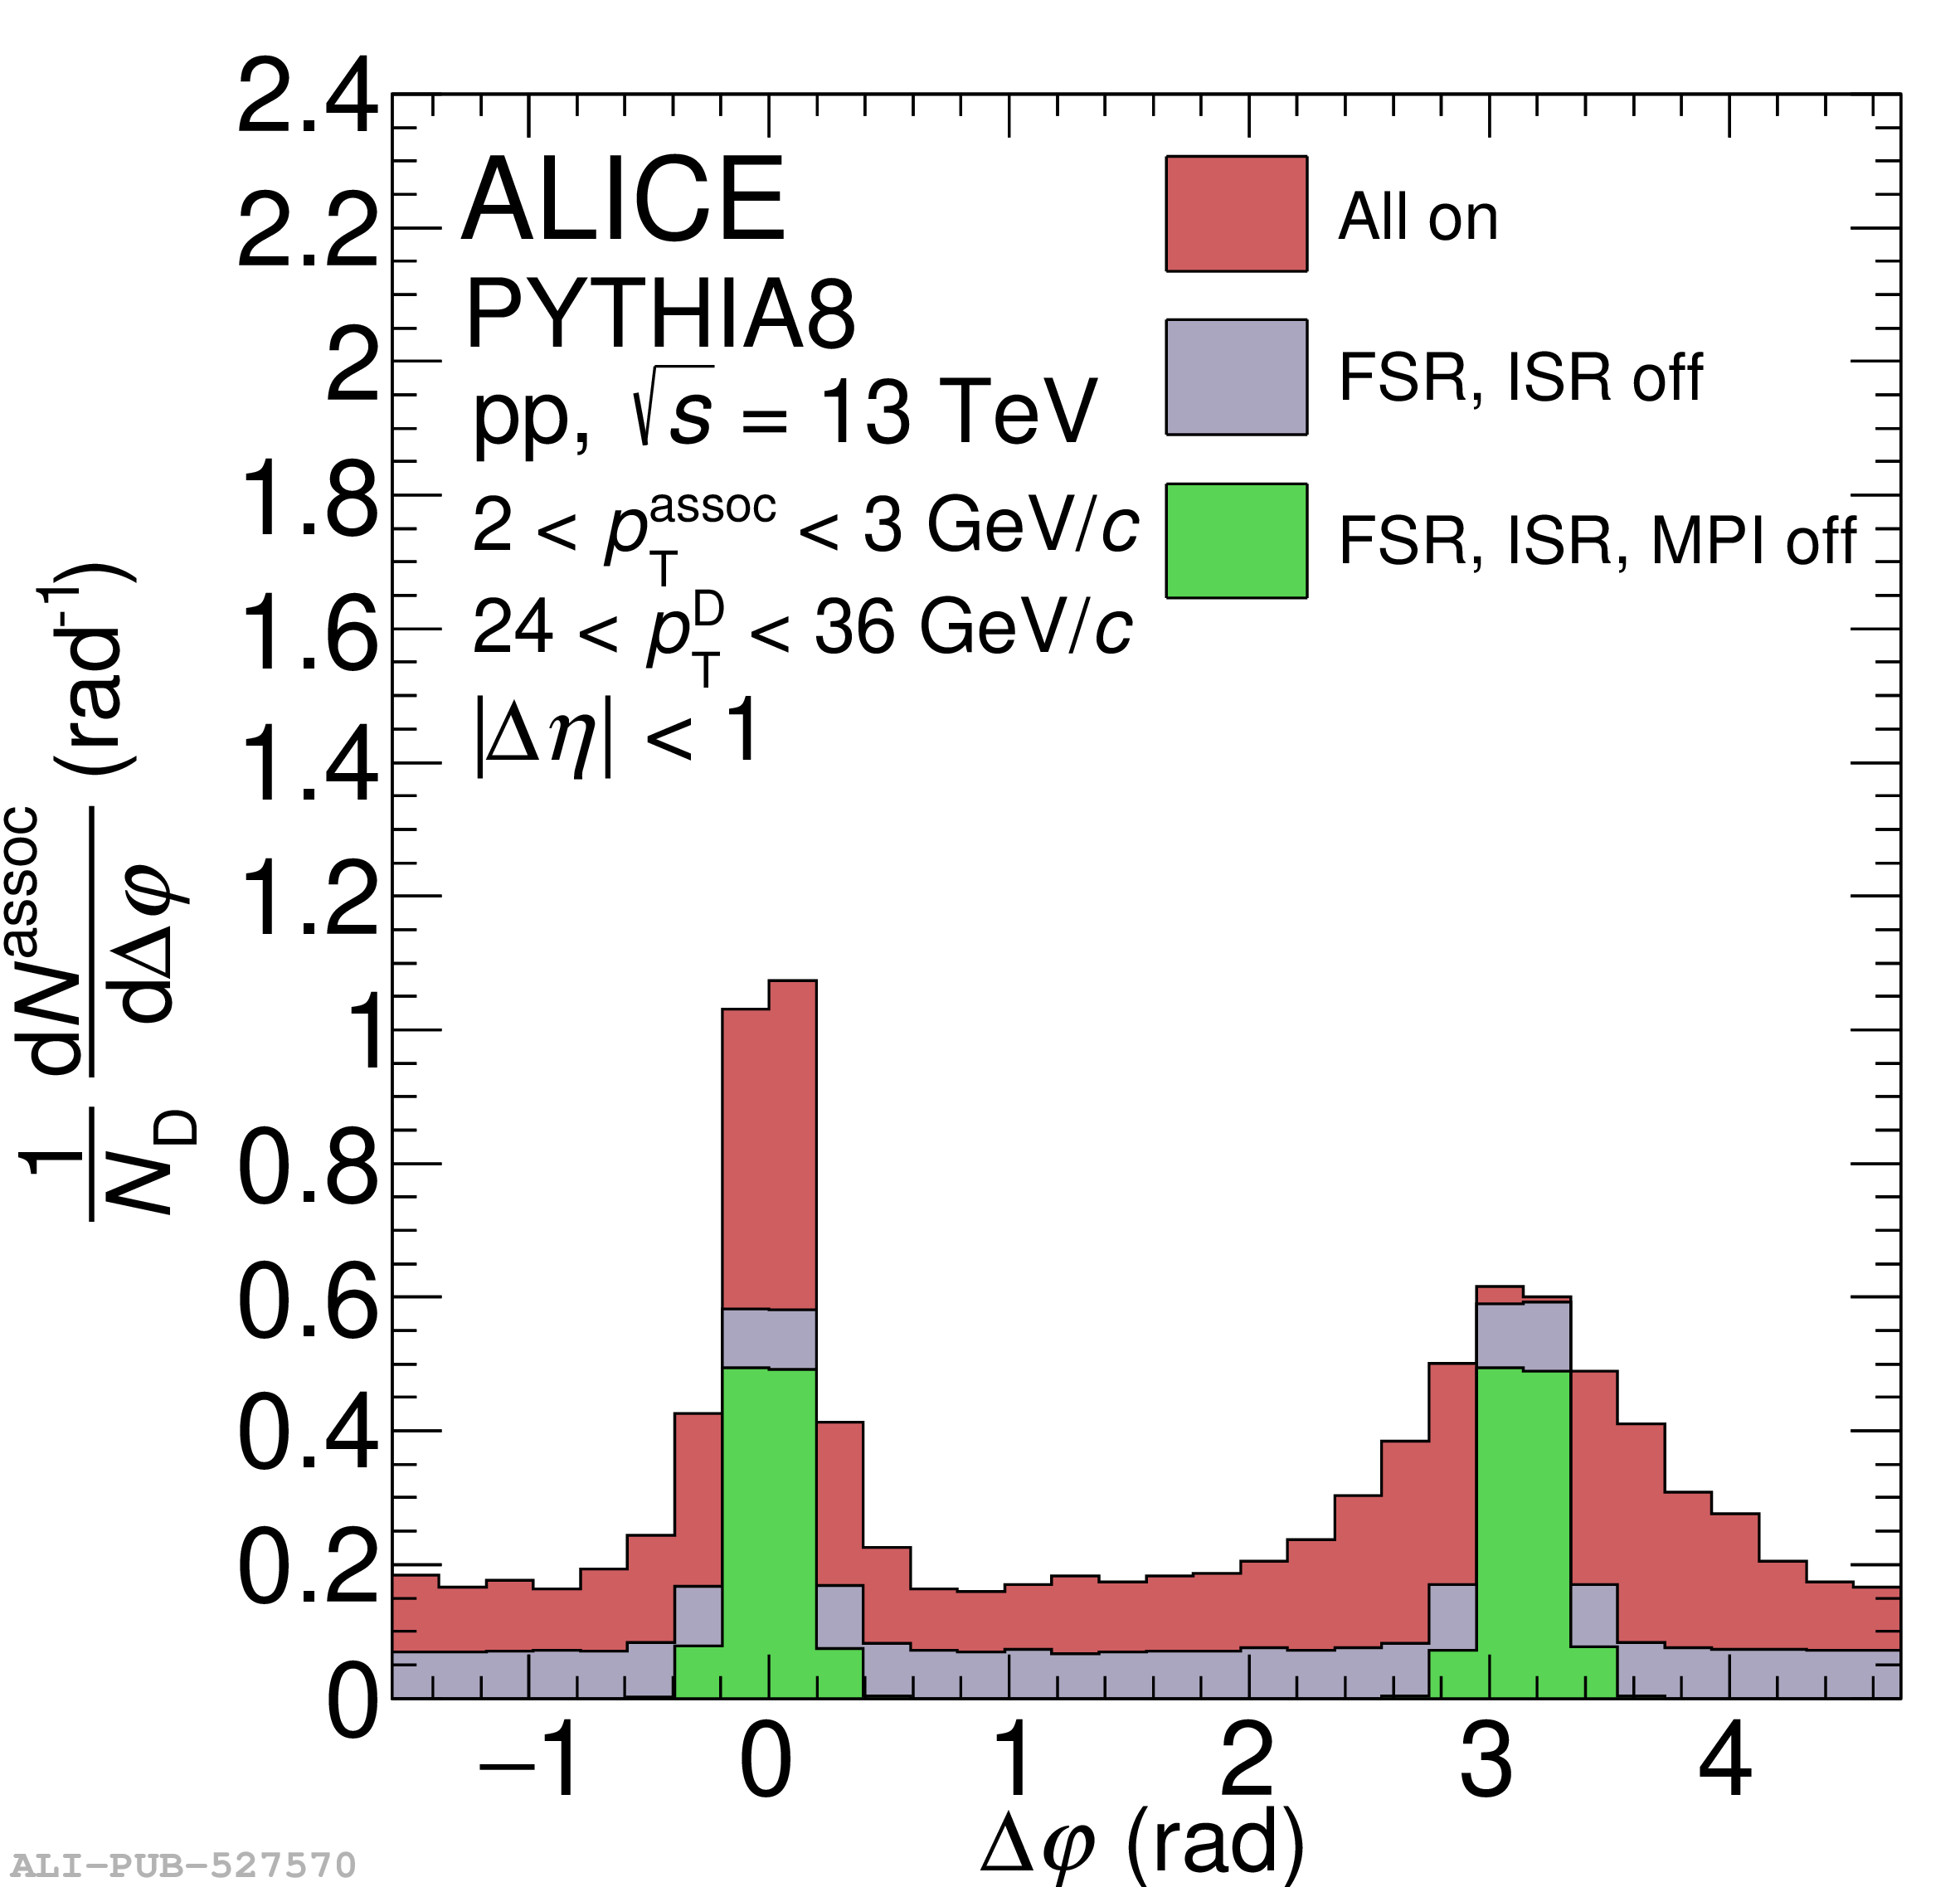
Figure 10
Azimuthal correlation function of D mesons with charged particles with different parton-level contributions from PYTHIA8 (left panel) and POWHEG+PYTHIA8 simulations (right panel) in pp collisions at $\s = 13$ \TeV, for $0.3 <\ptass< 1$ \GeVc and $3 <\ptD< 5$ \GeVc. | 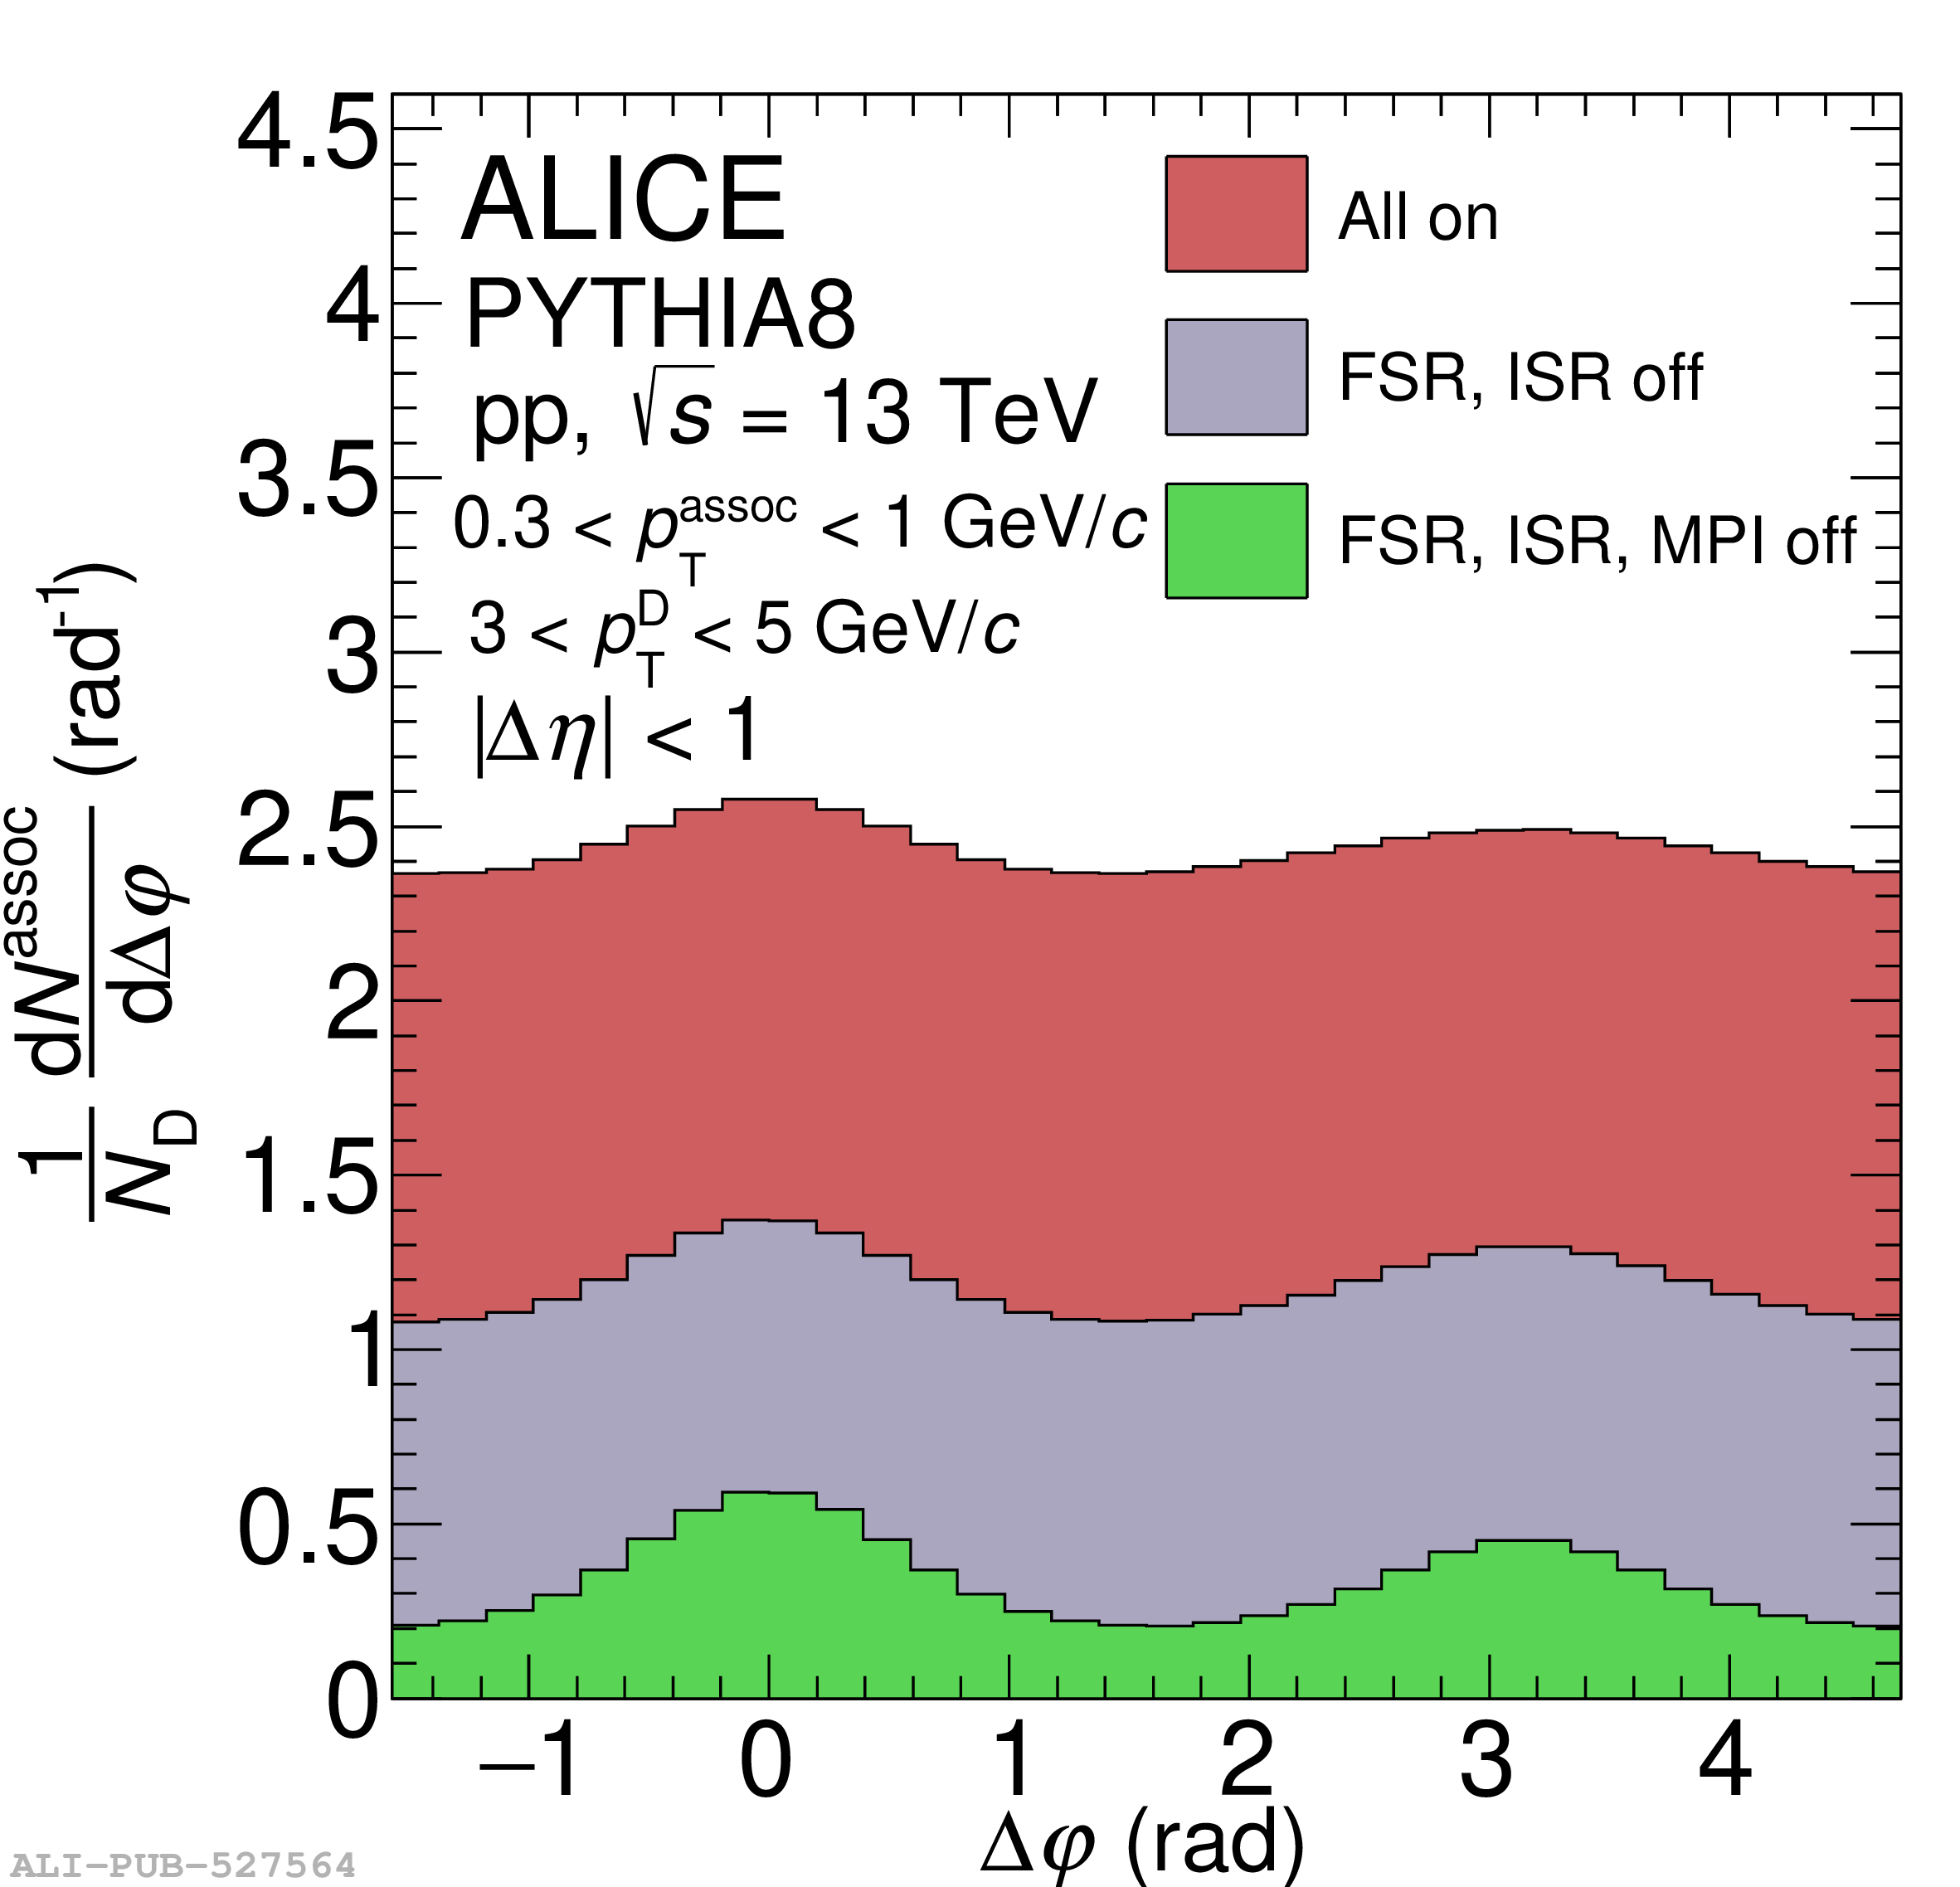 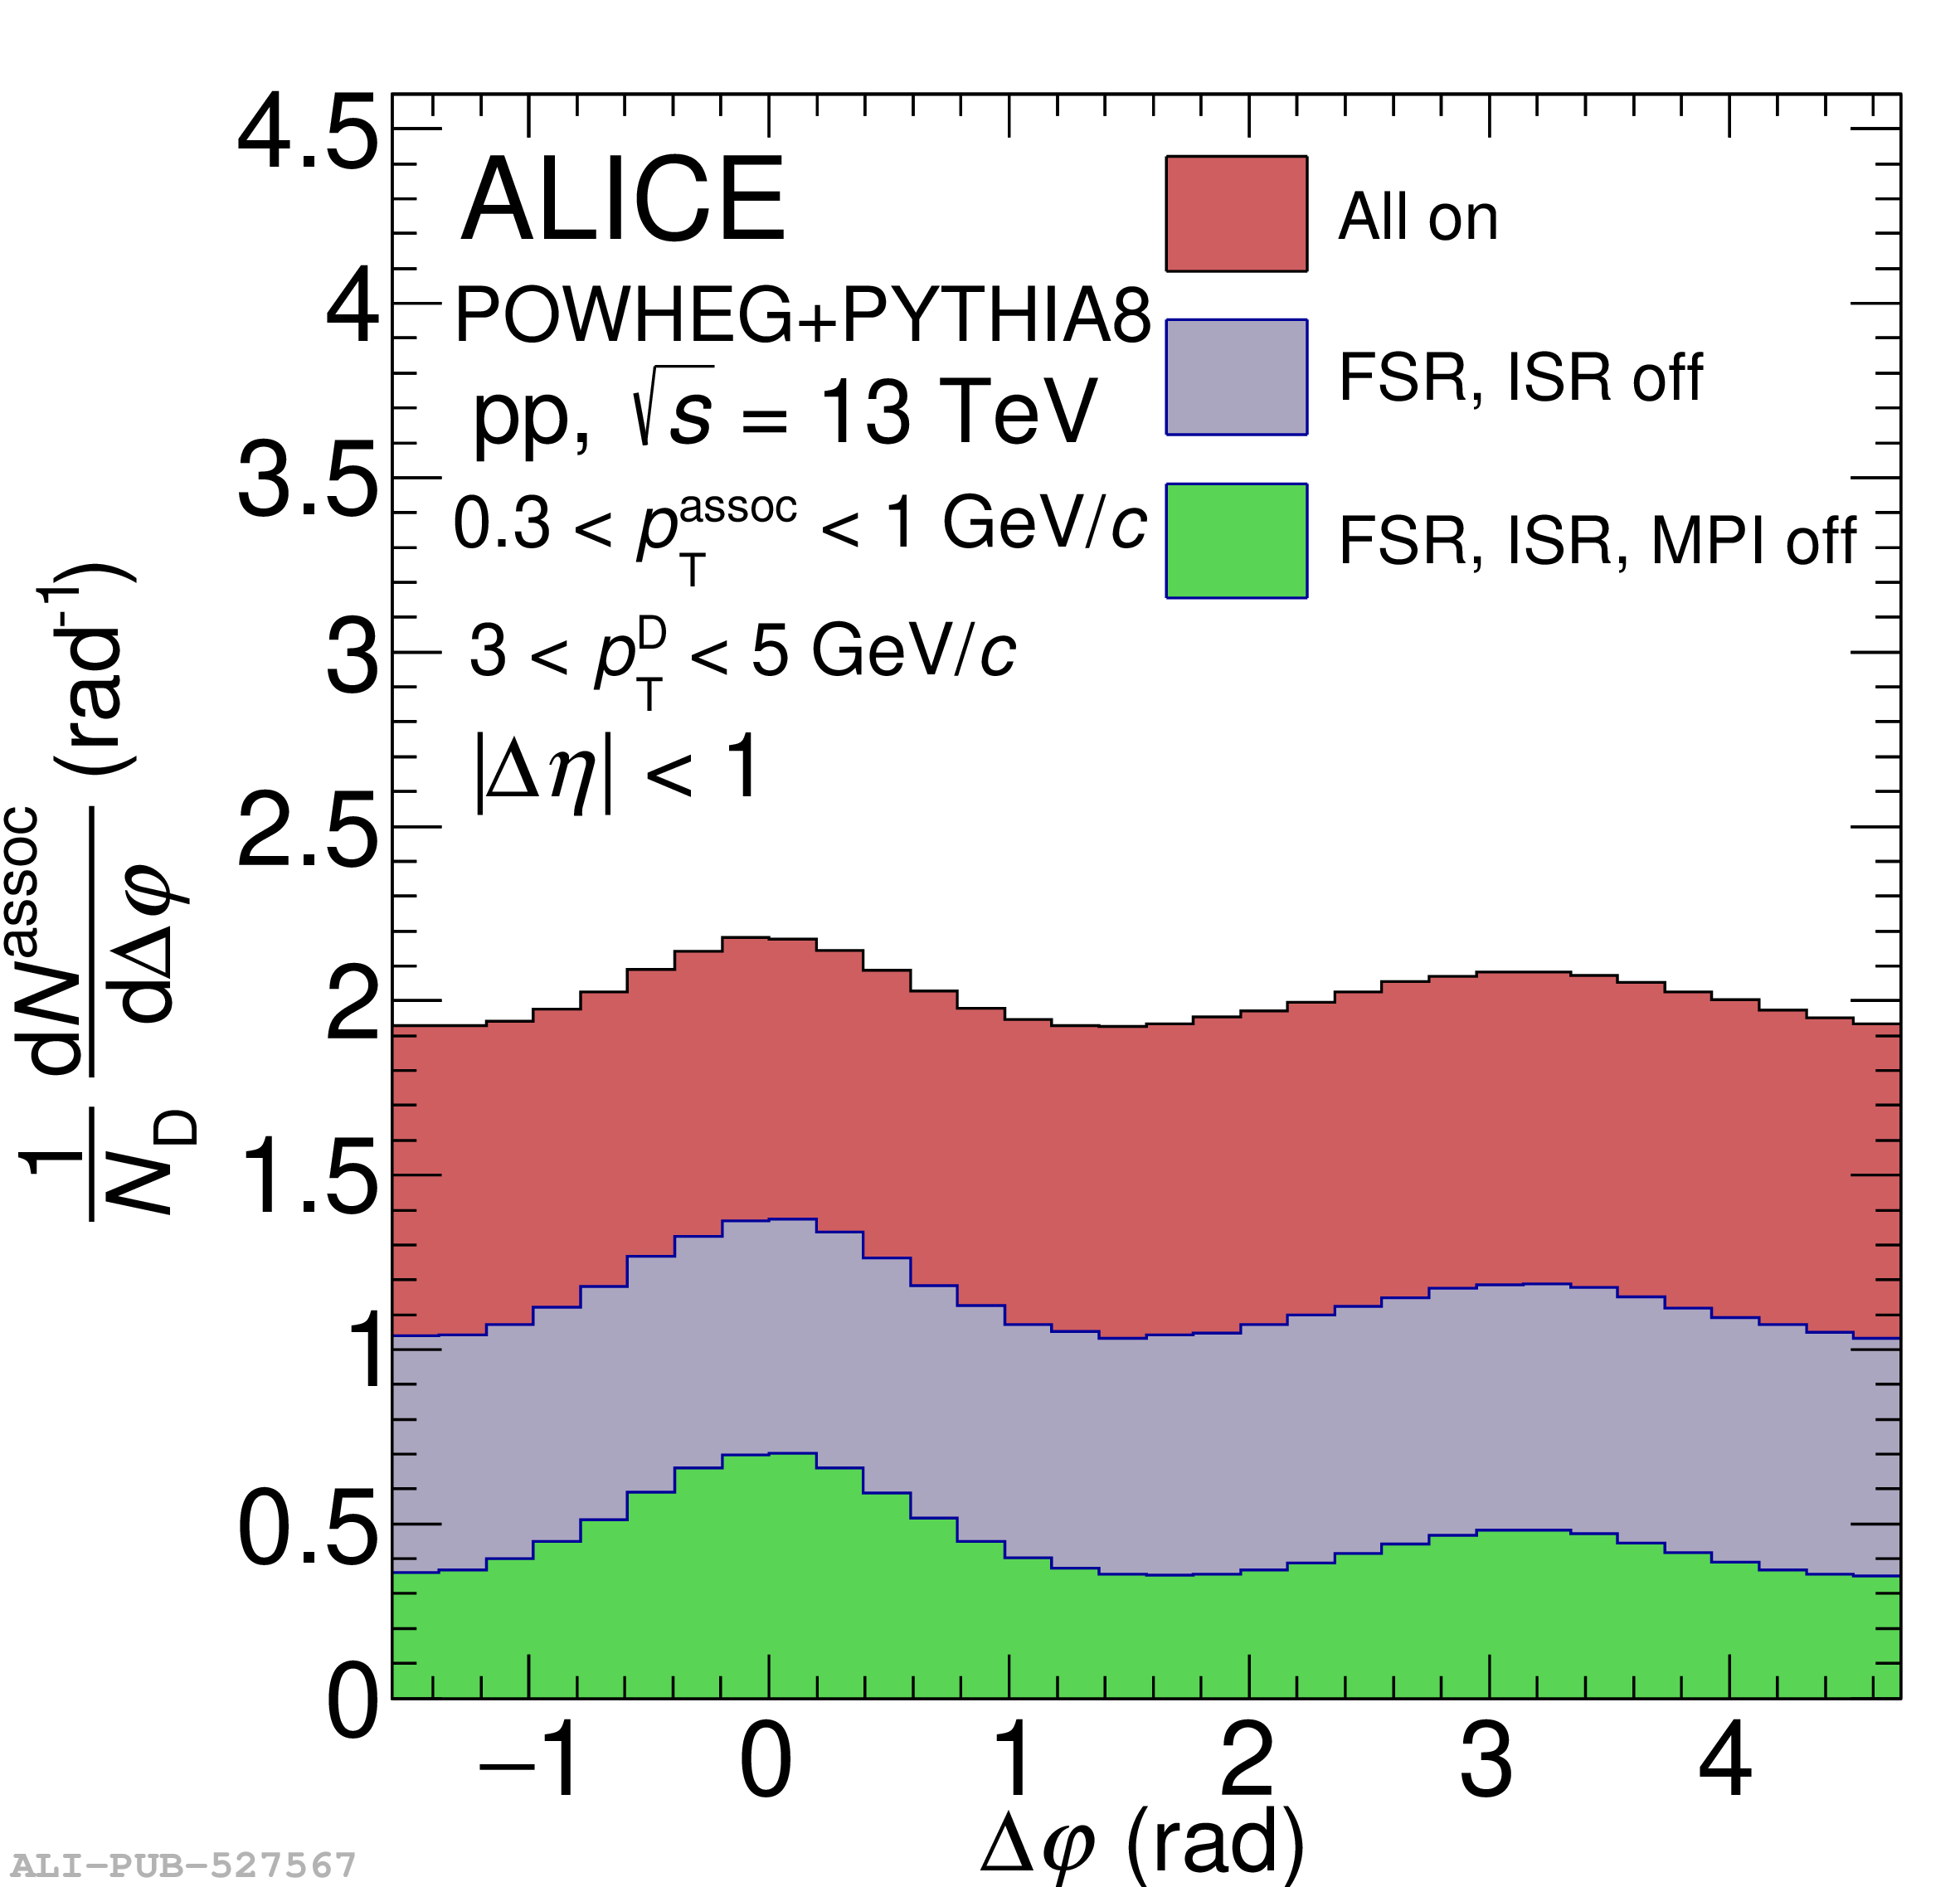 |