The production of prompt D$^{0}$, D$^{+}$, and D$^{*+}$ mesons was measured at midrapidity (|y|<~ 0.5) in Pb-Pb collisions at the centre-of-mass energy per nucleon-nucleon pair $\sqrt{s_{\rm NN}}$ = 5.02 TeV with the ALICE detector at the LHC. The D mesons were reconstructed via their hadronic decay channels and their production yields were measured in central (0-10%) and semicentral (30-50%) collisions. The measurement was performed up to a transverse momentum ($p_{\rm T}$) of 36 or 50 GeV/$c$ depending on the D meson species and the centrality interval. For the first time in Pb-Pb collisions at the LHC, the yield of D$^0$ mesons was measured down to $p_{\rm T}$ = 0, which allowed a model-independent determination of the $p_{\rm T}$-integrated yield per unit of rapidity (d$N$/d$y$). A maximum suppression by a factor 5 and 2.5 was observed with the nuclear modification factor ($R_{\rm AA}$) of prompt D mesons at $p_{\rm T}$ = 6-8 GeV/$c$ for the 0-10% and 30-50% centrality classes, respectively. The D-meson $R_{\rm AA}$ is compared with that of charged pions, charged hadrons, and J/$\psi$ mesons as well as with theoretical predictions. The analysis of the agreement between the measured $R_{\rm AA}$, elliptic ($v_2$) and triangular ($v_3$) flow, and the model predictions allowed us to constrain the charm spatial diffusion coefficient $D_s$. Furthermore the comparison of $R_{\rm AA}$ and $v_2$ with different implementations of the same models provides an important insight into the role of radiative energy loss as well as charm quark recombination in the hadronisation mechanisms.
JHEP 01 (2022) 174
HEP Data
e-Print: arXiv:2110.09420 | PDF | inSPIRE
CERN-EP-2021-213
Figure group
Figure 1
Invariant-mass (mass-difference) distribution of D0, D+, and D∗+ meson candidates in different pT intervals for the centrality class 0–10%. The fit functions are composed of a Gaussian function for the signal
and an additional term for the background, as described in detail in the text. The values for the Gaussian meanμ, width σ, and raw yield S are also reported. Top row: D0-meson candidates with 0 < pT < 1 GeV/c without reconstructing the decay vertex. The invariant-mass distributions are shown before (left) and after (right) the subtraction of the combinatorial background estimated from event-mixing. Middle row: D0-meson candidates with 1 < pT < 1.5 GeV/c with reconstruction of the decay vertex before (left) and after (right) background subtraction. The width of the Gaussian in this and in the previous pT interval is fixed to the value obtained from simulations. Bottom row: D+-meson candidates with 5 < pT < 5.5 GeV/c (left) and D∗+-meson candidates with 16 < pT < 24 GeV/c (right). | 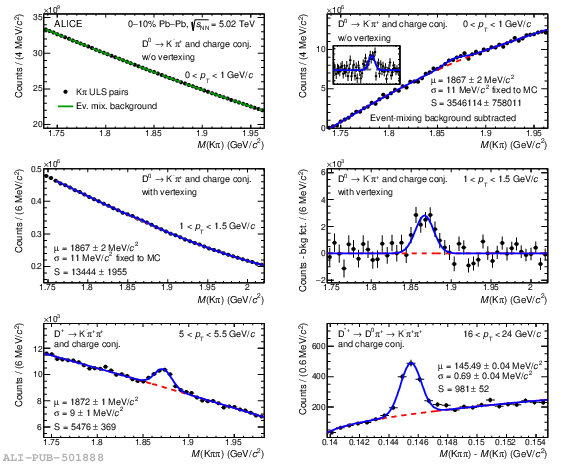 |

Figure 3
Transverse momentum distributions $\dNdydpt$ of prompt $\Dzero$ mesons from the analysis with (open marker) and without (full marker) decay-vertex reconstruction in the 0--10\% and 30--50\% centrality classes in \PbPb collisions at $\sqrtsNN = 5.02 \TeV$. Statistical uncertainties (bars) and systematic uncertainties (boxes) are shown. | 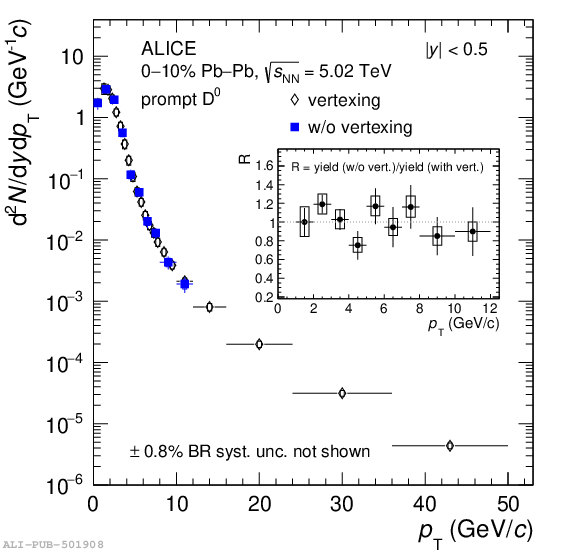  |
Figure 4
Transverse momentum distributions $\dNdydpt$ of prompt $\Dzero$ (left), $\Dplus$ (middle), and $\Dstar$ (right) mesons in the 0--10\% (cross) and 30--50\% (diamond) centrality classes in \PbPb collisions at $\sqrtsNN = 5.02 \TeV$. The reference \pp distributions multiplied by $\langle\TAA\rangle$ are shown as well. Statistical uncertainties (bars) and systematic uncertainties (boxes) are shown. The uncertainties on the BRs are quoted separately and the horizontal bars represent bin widths. The spectra in the 30--50\% centrality class are scaled by the factor reported in the legend for visibility. Filled and empty markers of the pp reference indicate the measured and $\pt$-extrapolated values, respectively, of the $\pt$-spectrum. | 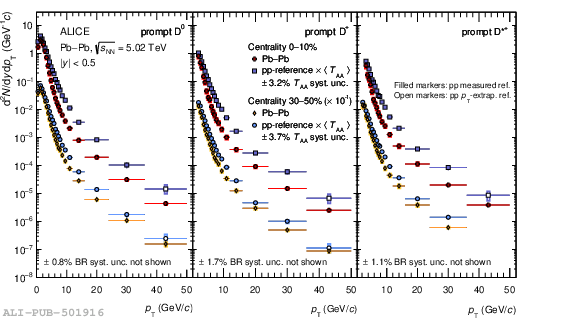 |
Figure 5
$\Dplus/\Dzero$ (top left panel) and $\Dstar/\Dzero$ (bottom left panel) ratios as a function of $\pt$ in central and semicentral \PbPb collisions compared to the results obtained from pp collisions . The right panels show the ratios in central \PbPb collisions compared to the predictions from the statistical hadronisation model (SHMc) with a core--corona approach and the FastReso package for resonance decays. Statistical (bars) and systematic (boxes) uncertainties are shown. | 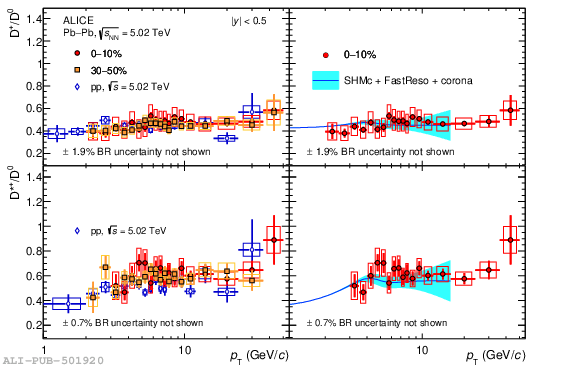 |
Figure 6
$\RAA$ of prompt $\Dzero$, $\Dplus$, and $\Dstar$ mesons as a function of $\pt$ for the 0--10\% (left panel) and 30--50\% (right panel) centrality classes. Statistical (bars), systematic (boxes), and normalisation (shaded box around unity) uncertainties are shown. Filled markers are obtained with the measured pp reference , empty markers with the $\pt$-extrapolated reference. | 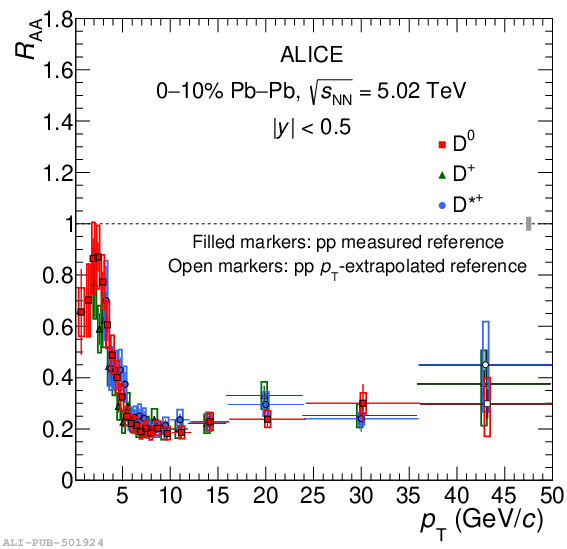 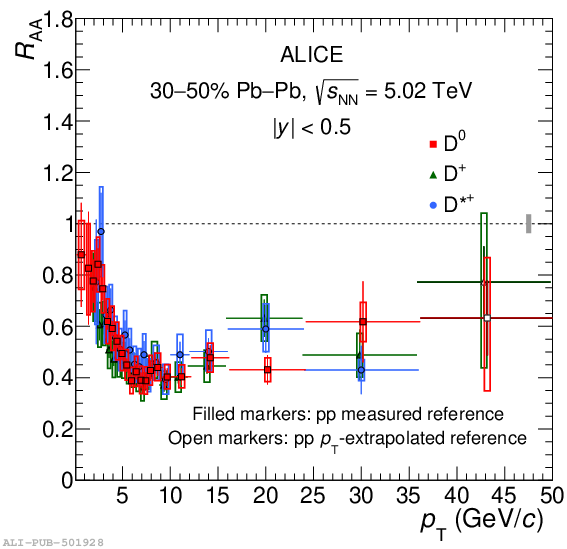 |
Figure 7
Left panel: prompt D-meson $\RAA$ (average of $\Dzero$, $\Dplus$, and $\Dstar$) as a function of $\pt$ measured in \PbPb collisions at $\sqrtsNN = 5.02 \TeV$ (2018 data sample) in the 0--10\% and 30--50\% centrality classes compared with published results in the 60--80\% centrality class (2015 data sample) and in \pPb collisions at the same centre-of-mass energy . Statistical (bars), systematic (boxes), and normalisation (shaded box around unity) uncertainties are shown. Right panel: prompt D-meson $\RAA$ in the 10\% most central \PbPb collisions at $\sqrtsNN= $5.02 TeV and 2.76 TeV compared to the $\Dzero$ $\RAA$ measured by the STAR collaboration in $\AuAu$ collisions at $\sqrtsNN= $200 GeV . | 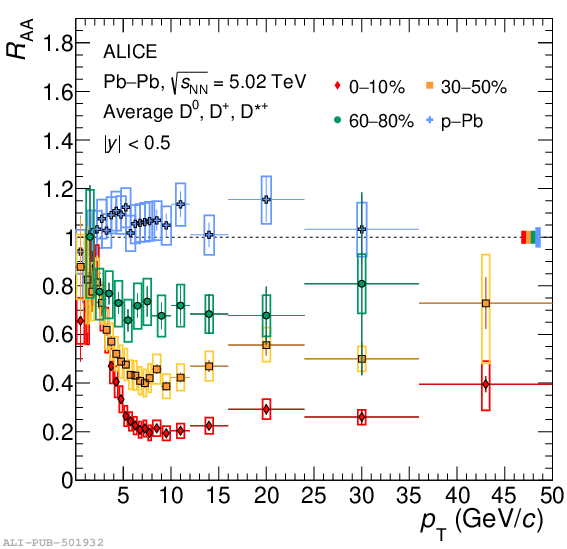 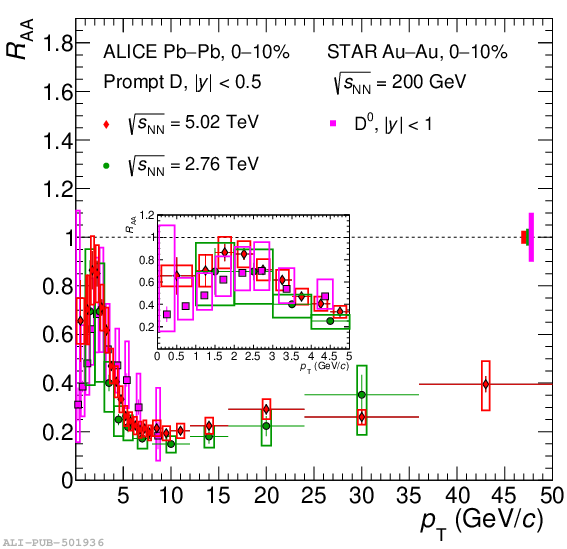 |
Figure 8
$\pt$-integrated nuclear modification factors of prompt $\Dzero$ mesons measured in \pPb and \PbPb collisions at $\sqrtsNN = 5.02 \TeV$. Statistical (bars) and systematic (brackets) uncertainties are shown. The results are compared with calculations at 90\% of confidence level of theoretical models nCTEQ15 (with Bayesian reweighting, see text for details) and EPPS16 that include only initial-state effects. | 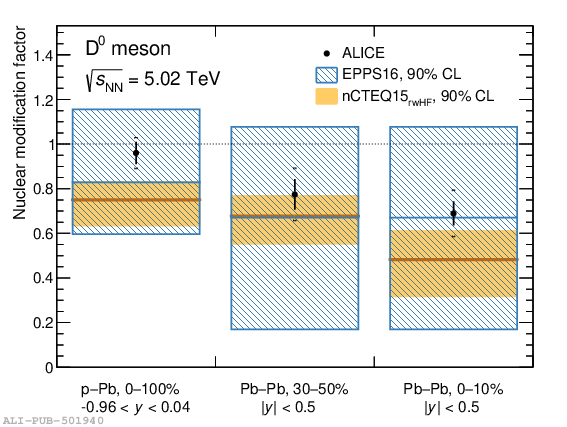 |
Figure 9
Average $\RAA$ of prompt $\Dzero$, $\Dplus$, and $\Dstar$ mesons in the 0--10$\%$ centrality class compared to $\RAA$ of charged pions , charged particles , inclusive J/$\psi$ measured by ALICE , and of prompt and non-prompt J/$\psi$ from CMS in \PbPb collisions at $\sqrtsNN = 5.02 \TeV$. | 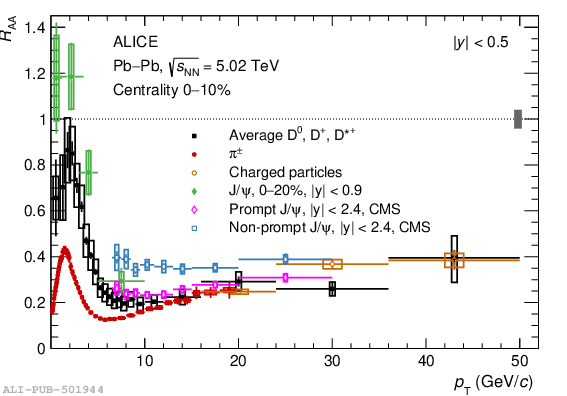 |

Figure 11
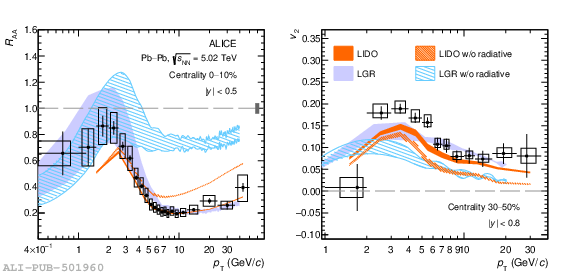
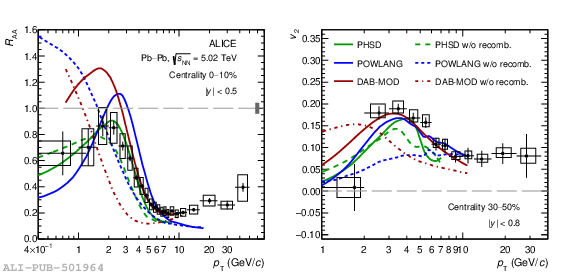
Average $\RAA$ (left) and elliptic flow $v_{2}$ (right) of prompt $\Dzero$, $\Dplus$, and $\Dstar$ mesons in the 0--10$\%$ (top) and 30--50$\%$ (bottom) centrality classes compared with predictions of models implementing the charm-quark transport in a hydrodynamically expanding medium . |
![[png]](https://alice-publications.web.cern.ch/sites/default/files/papers/7432/D_Raa_V2_vs_transportModel_010_1.png)
![[png]](https://alice-publications.web.cern.ch/sites/default/files/papers/7432/D_Raa_V2_vs_transportModel_3050_1.png)