The production of K$^{*}(892)^{0}$ and $\phi(1020)$ mesons in proton-proton (pp) and lead-lead (Pb-Pb) collisions at $\sqrt{s_\mathrm{NN}} = 5.02$ TeV has been measured using the ALICE detector at the Large Hadron Collider (LHC). The transverse momentum ($p_{\mathrm{T}}$) distributions of K$^{*}(892)^{0}$ and $\phi(1020)$ mesons have been measured at midrapidity $(|y|<~0.5)$ up to $p_{\mathrm{T}} = 20$ GeV$/c$ in inelastic pp collisions and for several Pb-Pb collision centralities. The collision centrality and collision energy dependence of the average transverse momenta agree with the radial flow scenario observed with stable hadrons, showing that the effect is stronger for more central collisions and higher collision energies. The $\mathrm{K^{*0}/K}$ ratio is found to be suppressed in Pb-Pb collisions relative to pp collisions: this indicates a loss of the measured K$^{*}(892)^{0}$ signal due to rescattering of its decay products in the hadronic phase. In contrast, for the longer-lived $\phi(1020)$ mesons, no such suppression is observed. The nuclear modification factors ($R_{\rm AA}$) of K$^{*}(892)^{0}$ and $\phi(1020)$ mesons are calculated using pp reference spectra at the same collision energy. In central Pb-Pb collisions for $p_{\rm T} > 8$ GeV$/c$, the $R_{\rm AA}$ values of K$^{*}(892)^{0}$ and $\phi(1020)$ are below unity and observed to be similar to those of pions, kaons, and (anti)protons. The $R_{\rm AA}$ values at high $p_{\mathrm T}$ ($>$~8 GeV$/c$) for K$^{*}(892)^{0}$ and $\phi(1020)$ mesons are in agreement within uncertainties for $\sqrt{s_\mathrm{NN}} = 5.02$ and 2.76 TeV.
Phys. Rev. C 106 (2022) 034907
HEP Data
e-Print: arXiv:2106.13113 | PDF | inSPIRE
CERN-EP-2021-101
Figure 1
Invariant-mass distributions of \pik pairs for the 0--10\% and 70--80\% centrality classes in \PbPb collisions at \snn $=$ 5.02 \TeV for the transverse momentum range 1.2 \textless \pt \textless 1.6 \GeVc. The left panels show the unlike charge \pik invariant-mass distribution from the same event and the normalized mixed event background. The right panels report the invariant-mass distribution after subtraction of the combinatorial background for \kstar. The solid curves represent fits to the distributions and the dashed curves are the components of the fits that describe the residual background. The statistical uncertainties are shown by bars. |  |
Figure 2
Invariant-mass distributions of \kk pairs for the 0--10\% and 70--80\% centrality classes in \PbPb collisions at \snn $=$ 5.02 \TeV for the transverse momentum ranges 0.8 \textless \pt \textless 1.0 \GeVc. The left panels show the unlike charge \kk invariant-mass distribution from the same event and the normalized mixed event background. The right panels report the invariant-mass distribution after subtraction of the combinatorial background for \phim. The solid curves represent fits to the distributions and the dashed curves are the components of the fits that describe the residual background. The statistical uncertainties are shown by bars. | 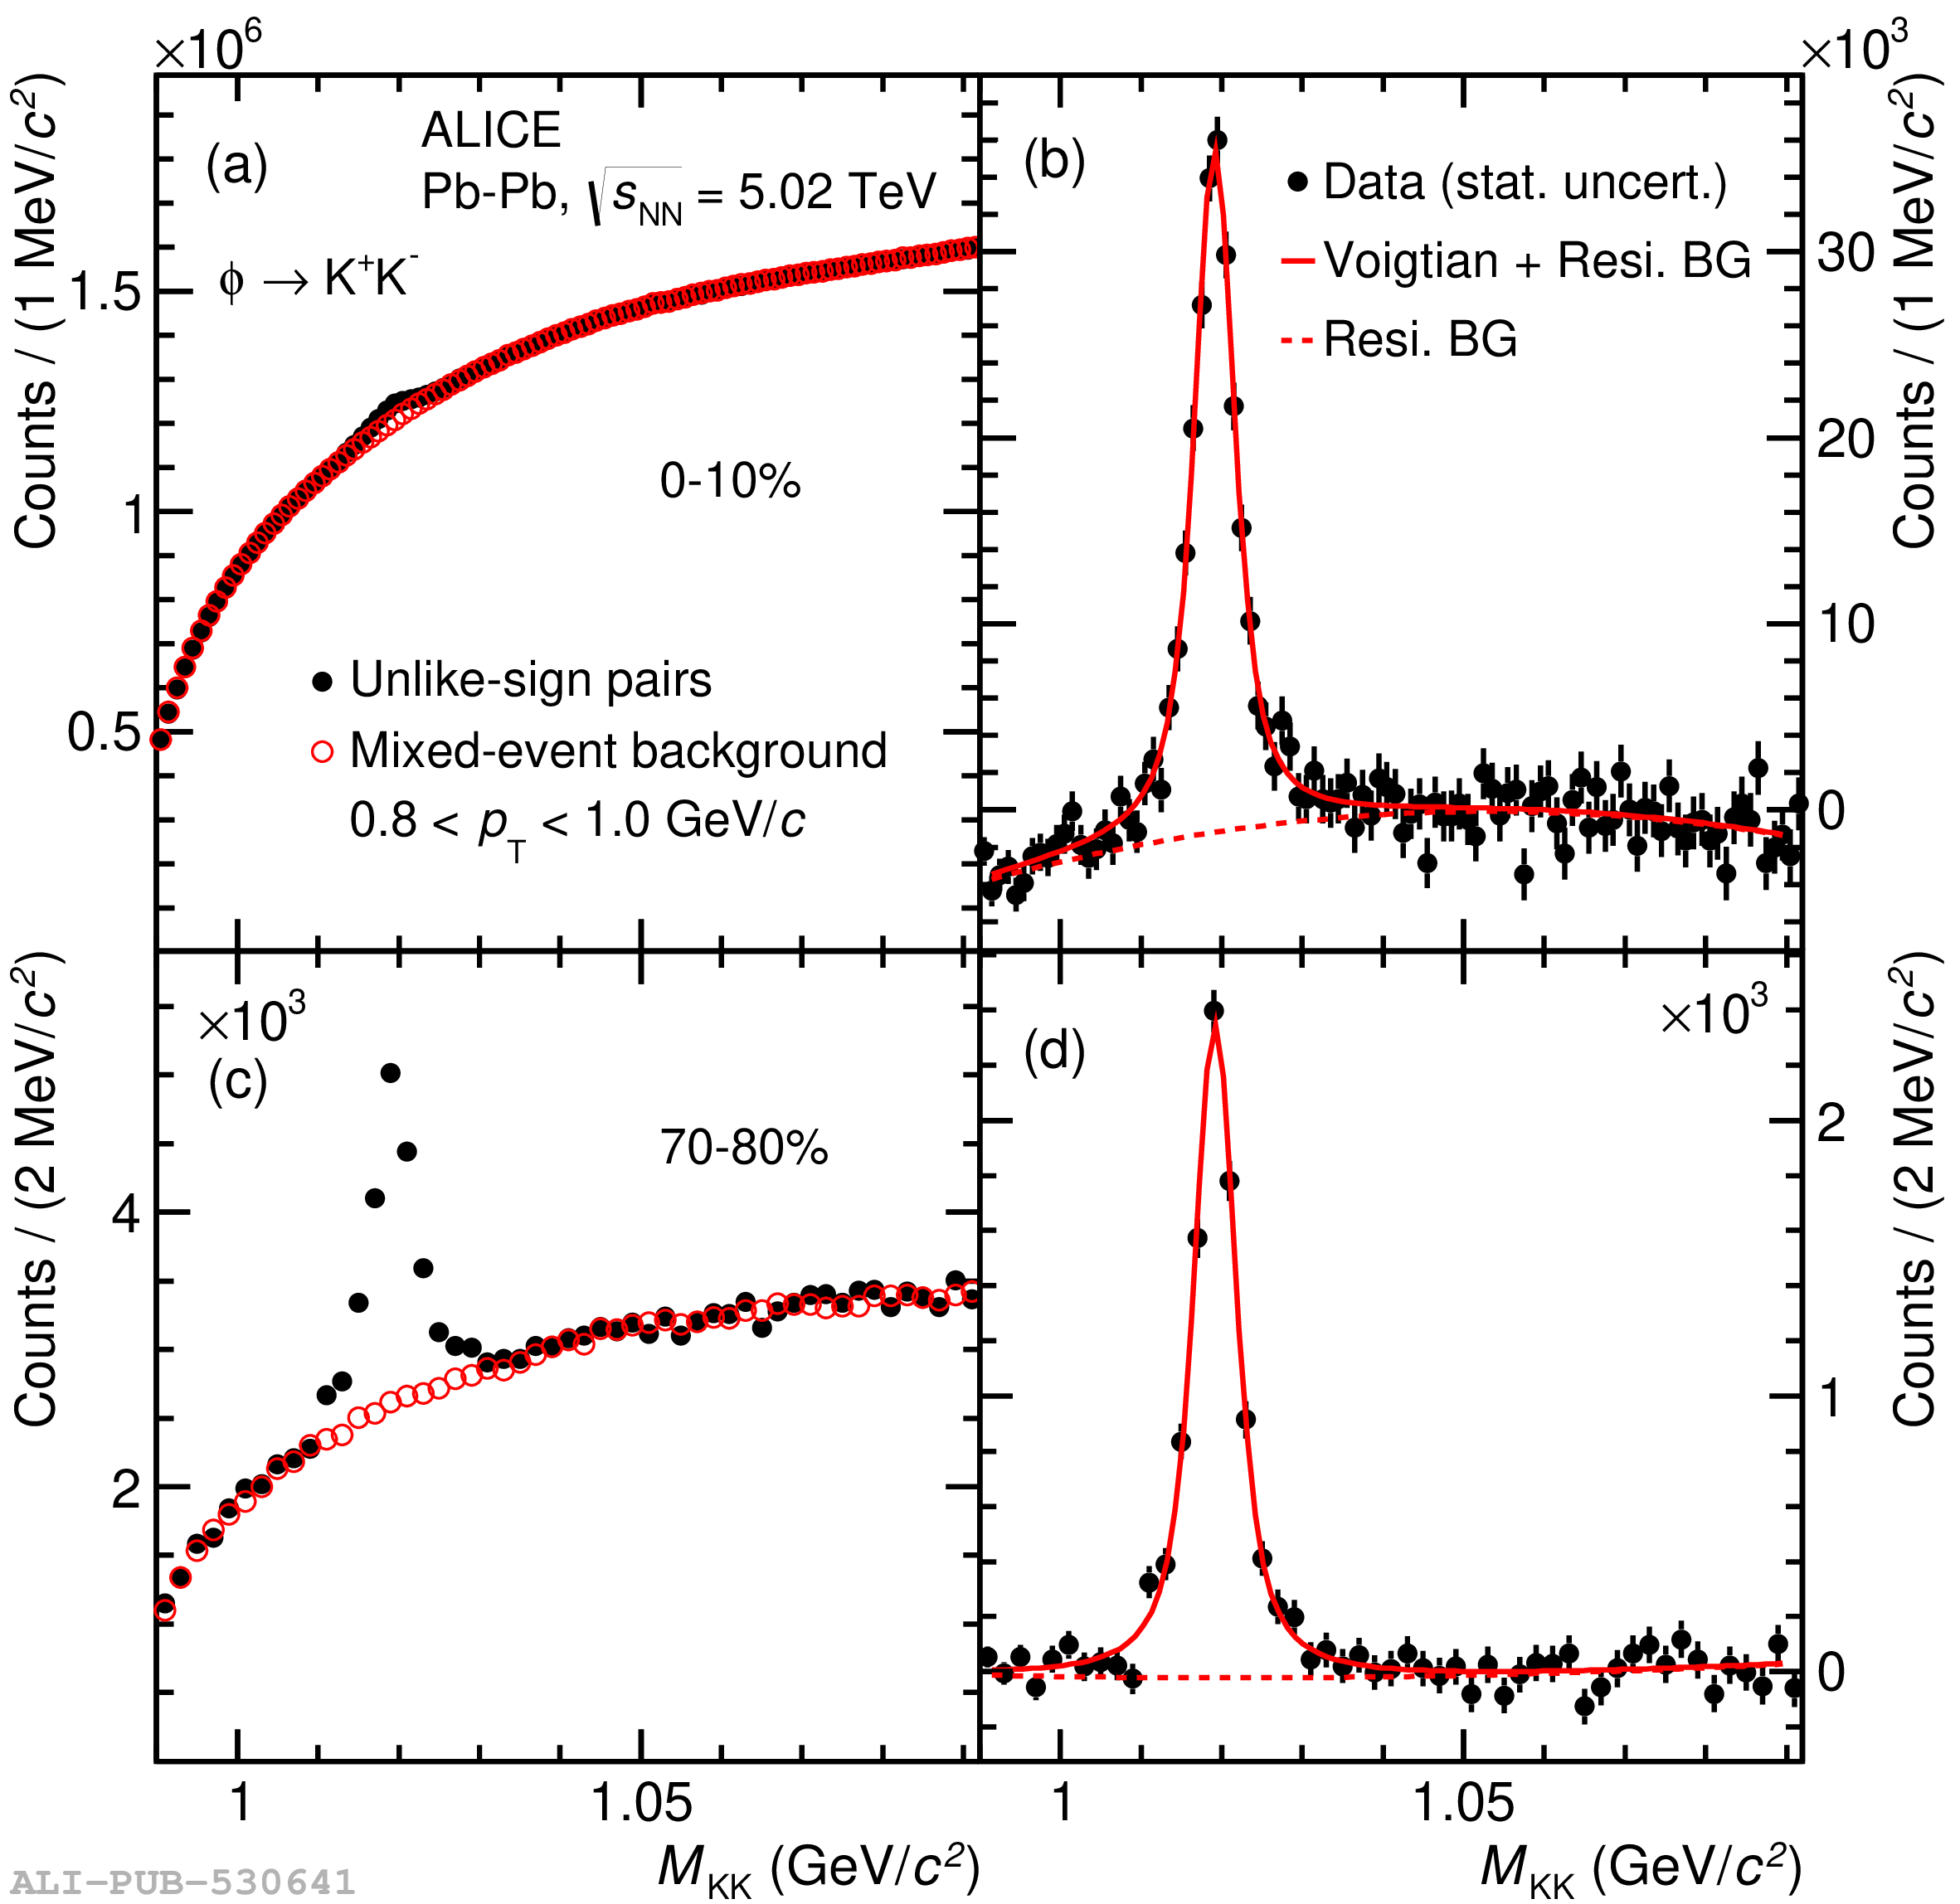 |
Figure 3
Transverse momentum spectra of \kstar (left panel) and \phim (right panel) for inelastic \pp collisions at \s $=$ 5.02 \TeV. The statistical and systematic uncertainties are shown by bars and boxes, respectively. The results are compared with model calculations from PYTHIA 6.4 (Perugia 2011 Tune) , PYTHIA 8.1 (Monash 2013 Tune) ,PYTHIA 8.2 (Rope hadronization) , EPOS-LHC , and HERWIG 7.1 , which are shown as different dashed lines. The lower panels show the data to model ratio. |  |
Figure 4
Comparison of transverse momentum spectra of \kstar (left panel) and \phim (right panel) for inelastic \pp collisions at \s $=$ 5.02 \TeV (solid markers) and 2.76 \TeV (open markers) . The lower panels show the ratio of the \pt spectra at \s $=$ 5.02 \TeV to those from \s $=$ 2.76 \TeV. The statistical uncertainties on the data are shown by bars and the systematic uncertainties by boxes. The ratios are compared with model calculations from the PYTHIA 6.4 (Perugia 2011 Tune) , PYTHIA 8.1 (Monash 2013 Tune) ,PYTHIA 8.2 (Rope hadronization) , EPOS-LHC , and HERWIG 7.1 , which are shown as different dashed lines. | 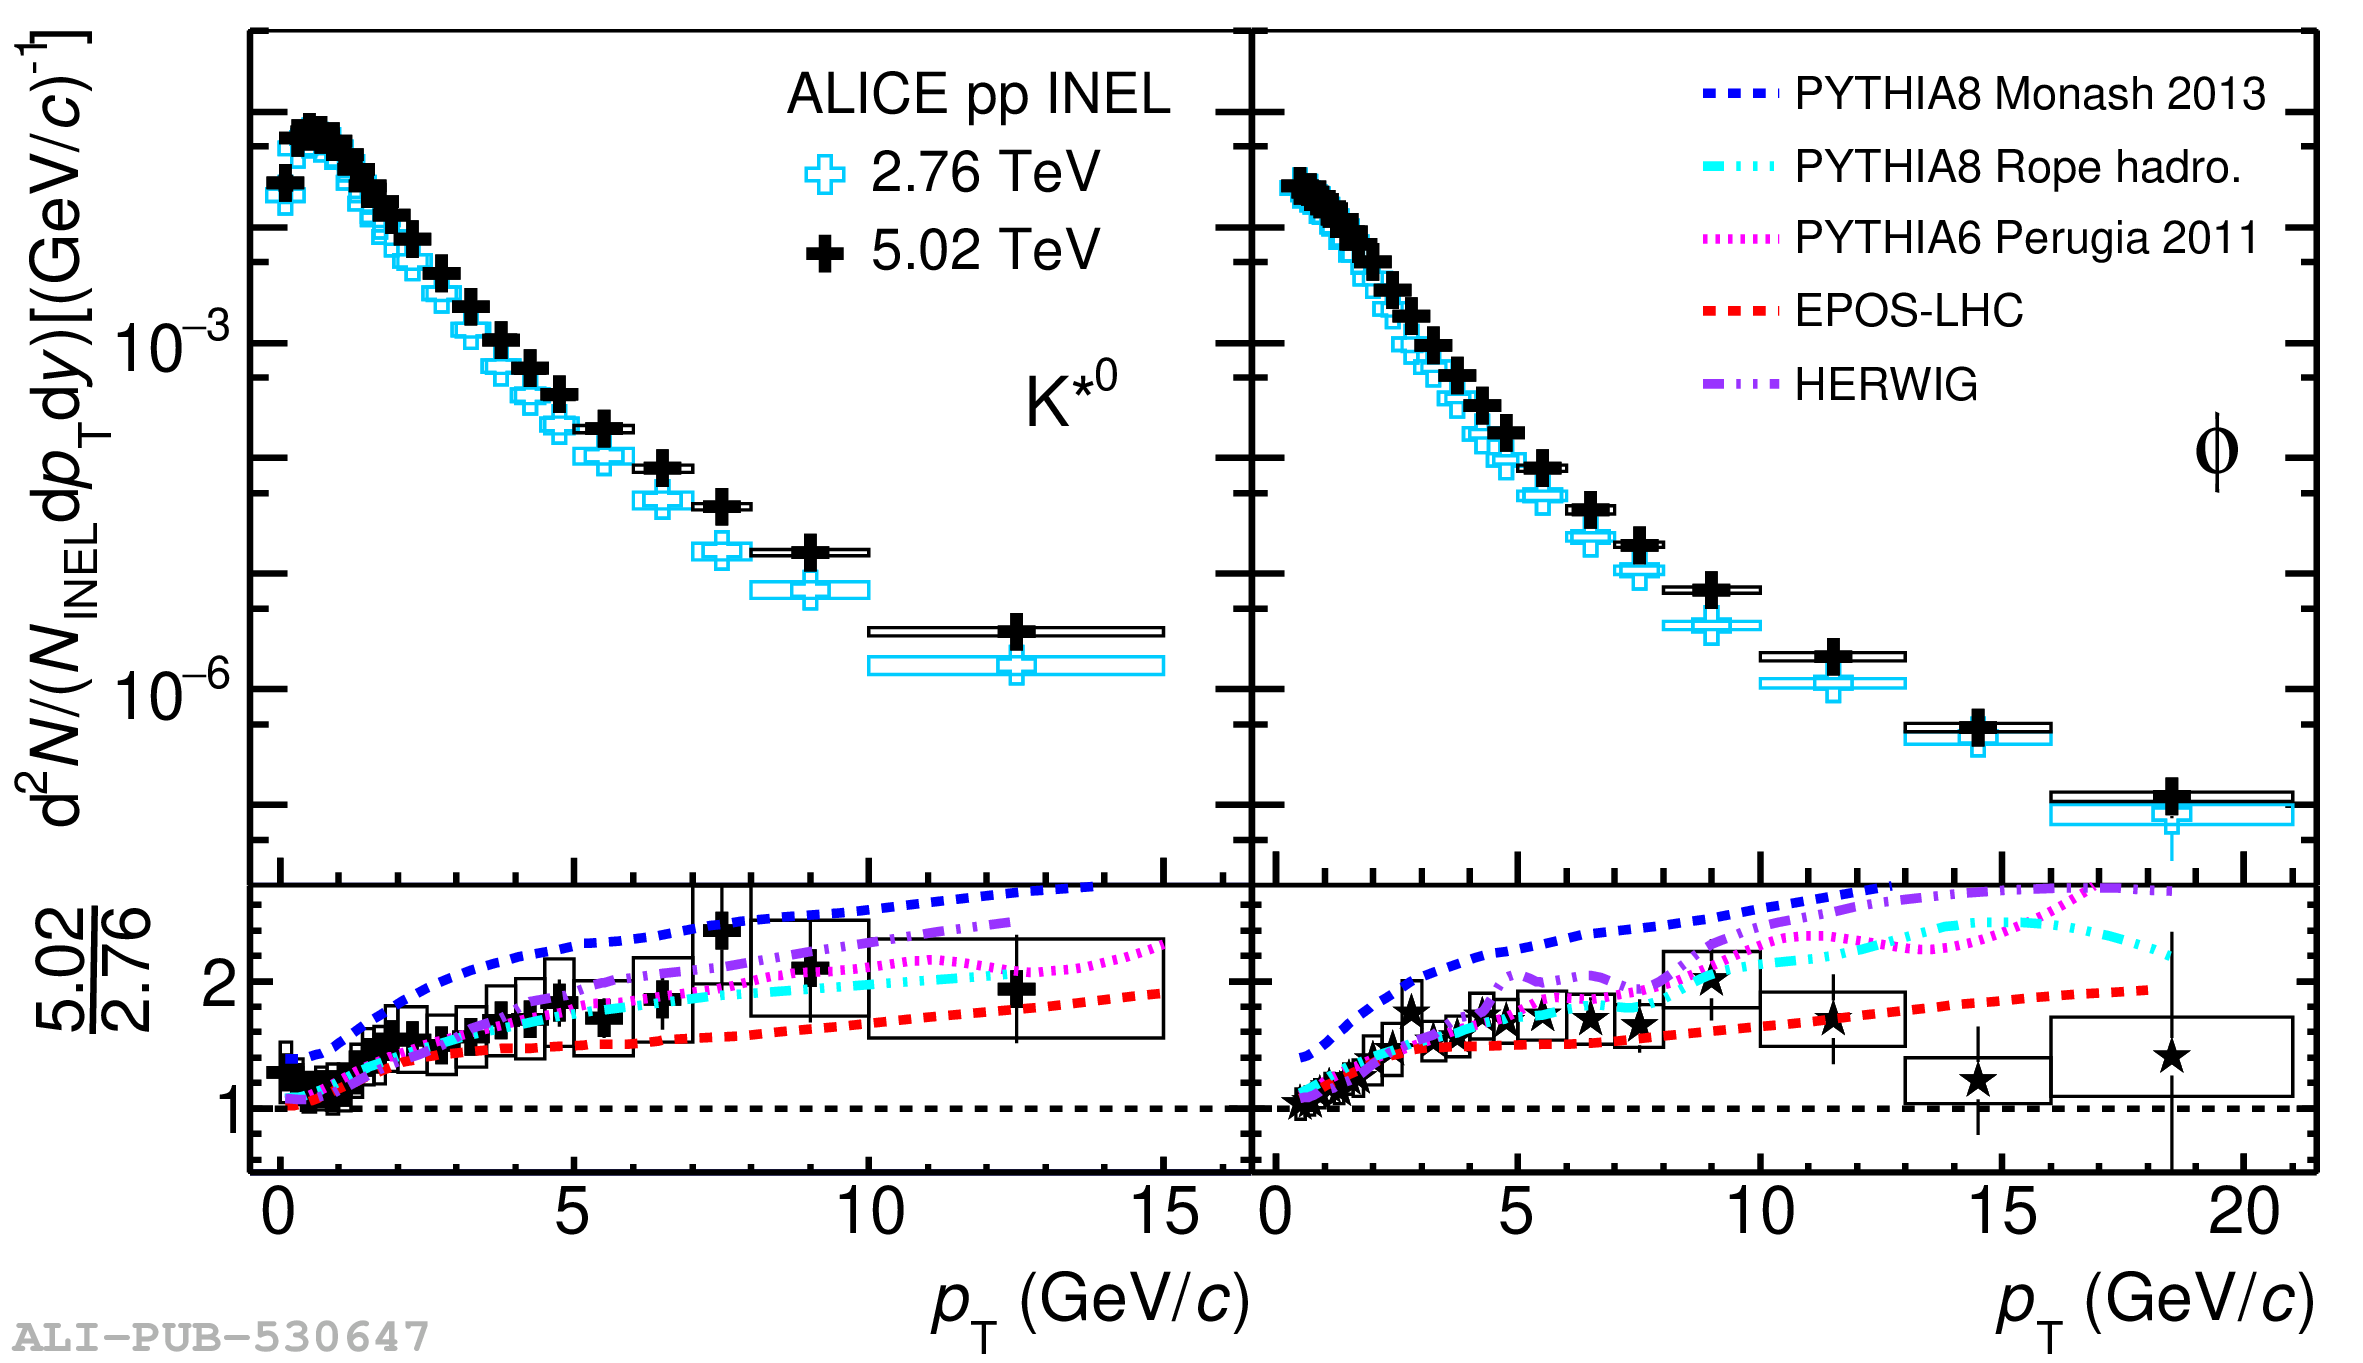 |
Figure 5
Transverse momentum spectra of \kstar (left panel) and \phim (right panel) at midrapidity in various centrality classes in \PbPb collisions at \snn $=$ 5.02 \TeV. The statistical uncertainties on the data are shown by bars and the systematic uncertainties by boxes. The results are compared with model calculations from HIJING 1.36 , which are shown as dashed lines. The lower panel shows the data to model ratios. | 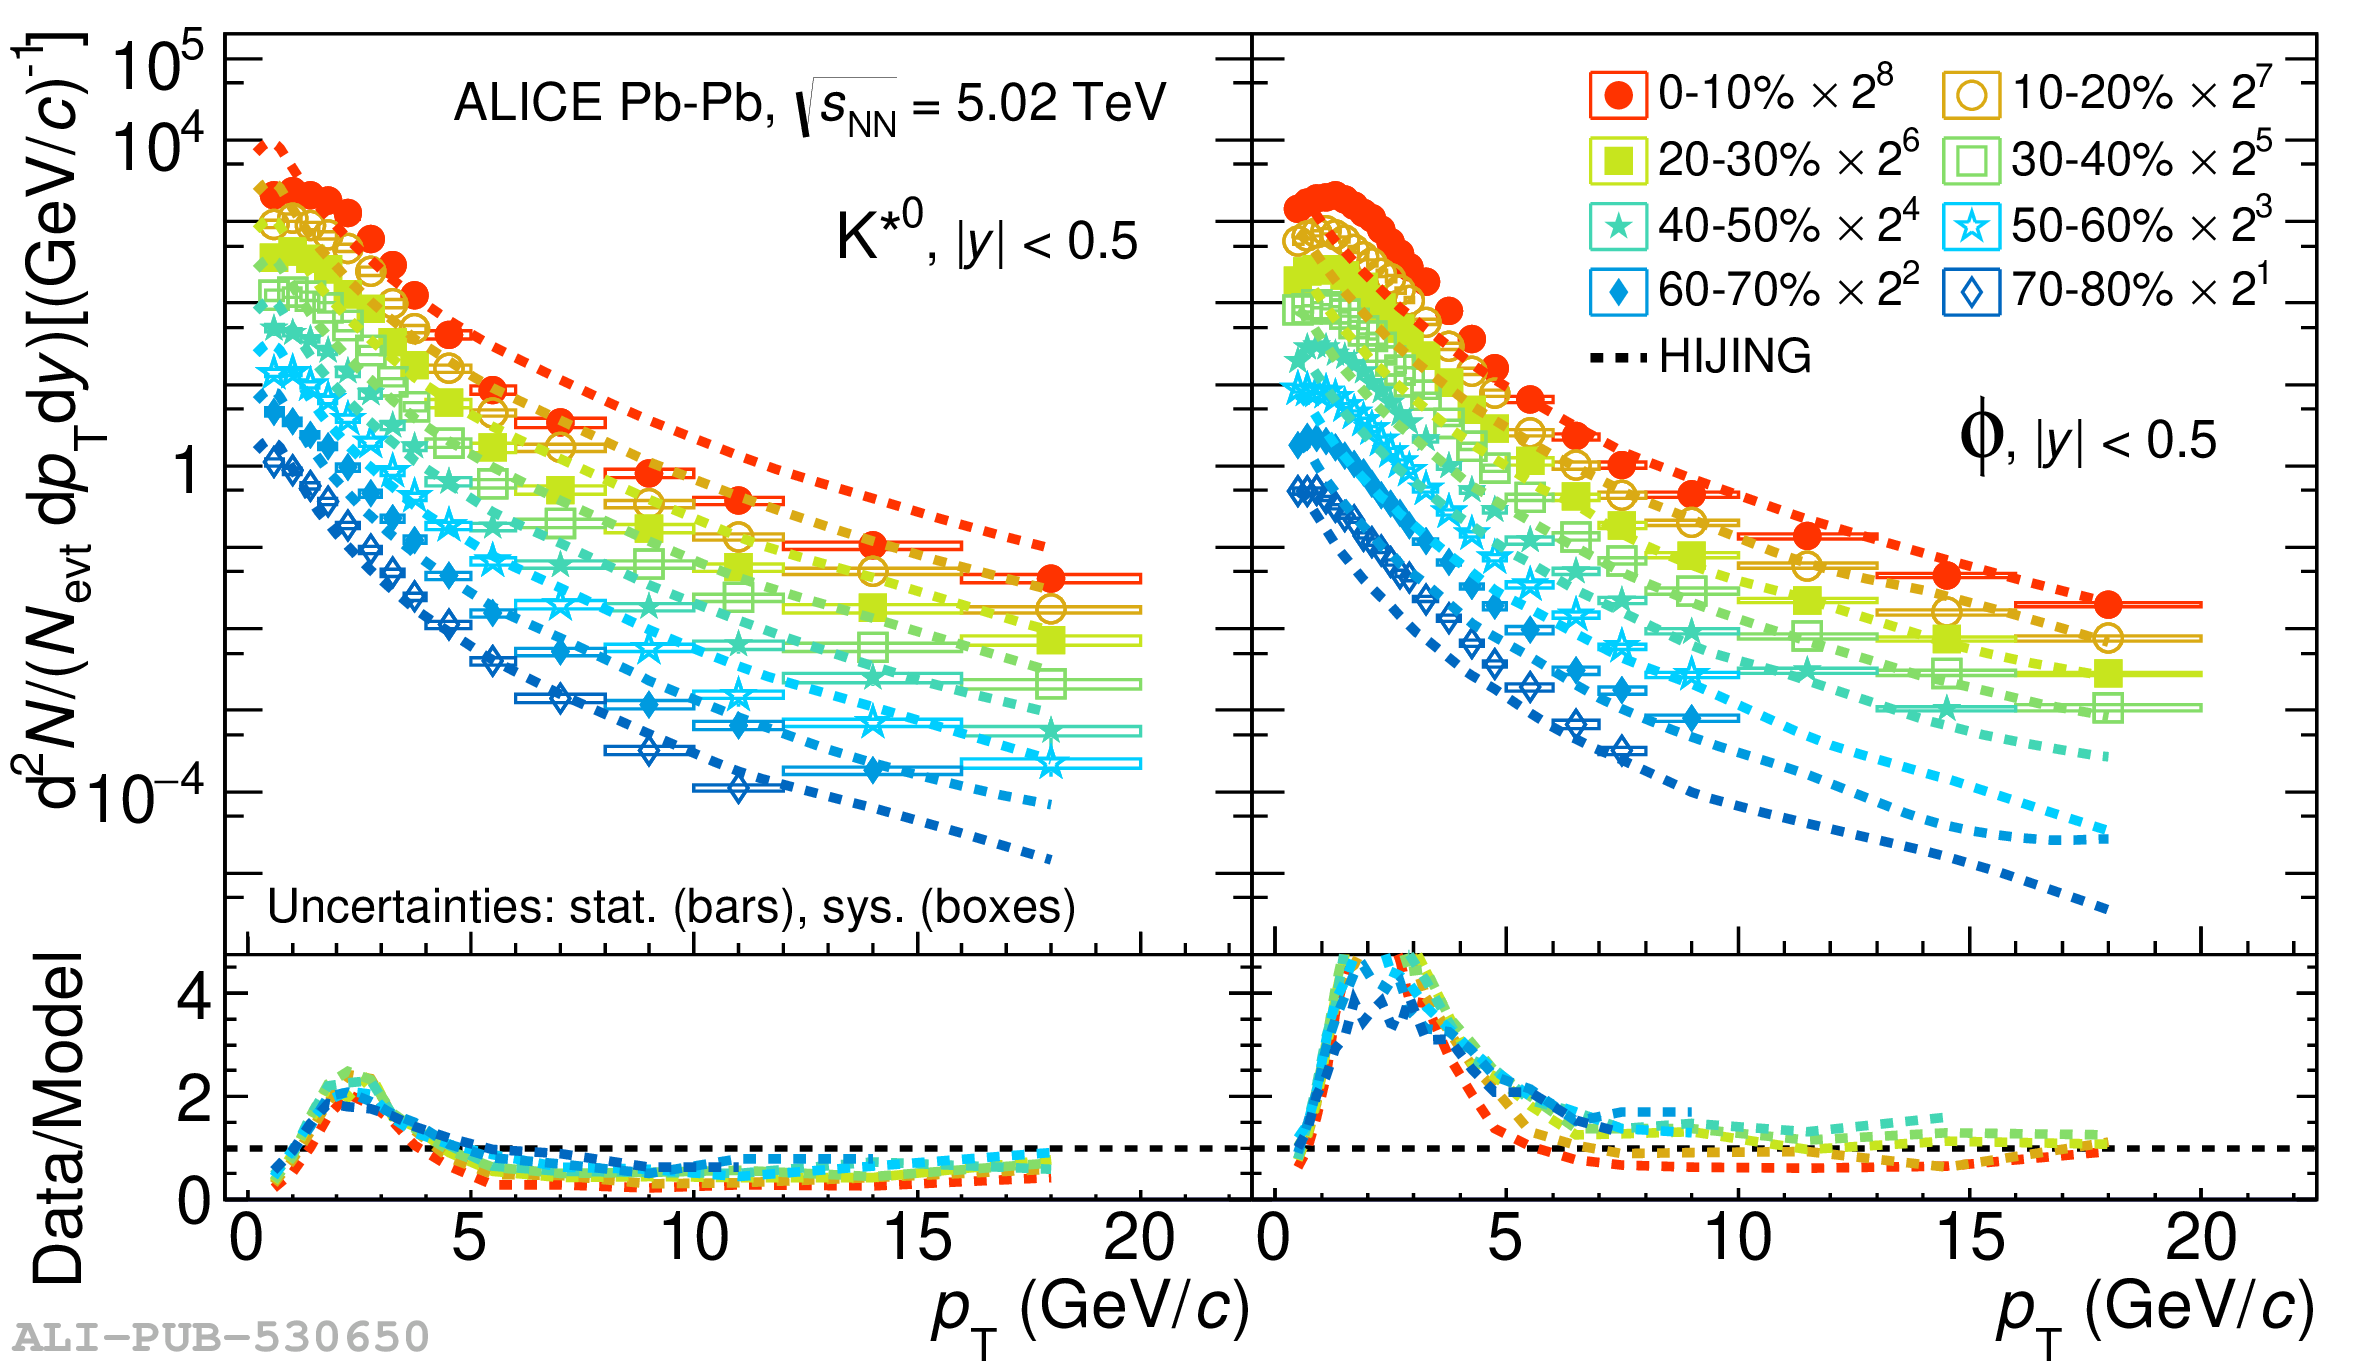 |
Figure 6
Comparison of transverse momentum spectra of \kstar (left panel) and \phim (right panel) in central (0--10\%) and mid-central (40--50\%) centrality classes in \PbPb collisions at \snn $=$ 5.02 (solid marker) and 2.76 (open marker) \TeV . The lower panels show the ratio of the \pt spectra at \snn $=$ 5.02 \TeV to those from \snn $=$ 2.76 \TeV. The statistical uncertainties on the data are shown by bars and the systematic uncertainties by boxes. |  |
Figure 7
Transverse-momentum distributions of \kstar and \phim resonances in Pb--Pb collisions at \snn $=$ 5.02 \TeV along with expected distributions for central (left) and peripheral (right) collisions. The shapes of the expected distributions are given by Boltzmann-Gibbs blast-wave functions using parameters obtained from fits to pion, kaon, and (anti)proton \pt distributions (see text for details). The shaded bands indicate the uncertainties in the fit parameters of the model distributions. The lower panels show the ratios of the measured distribution to the values from the model. | 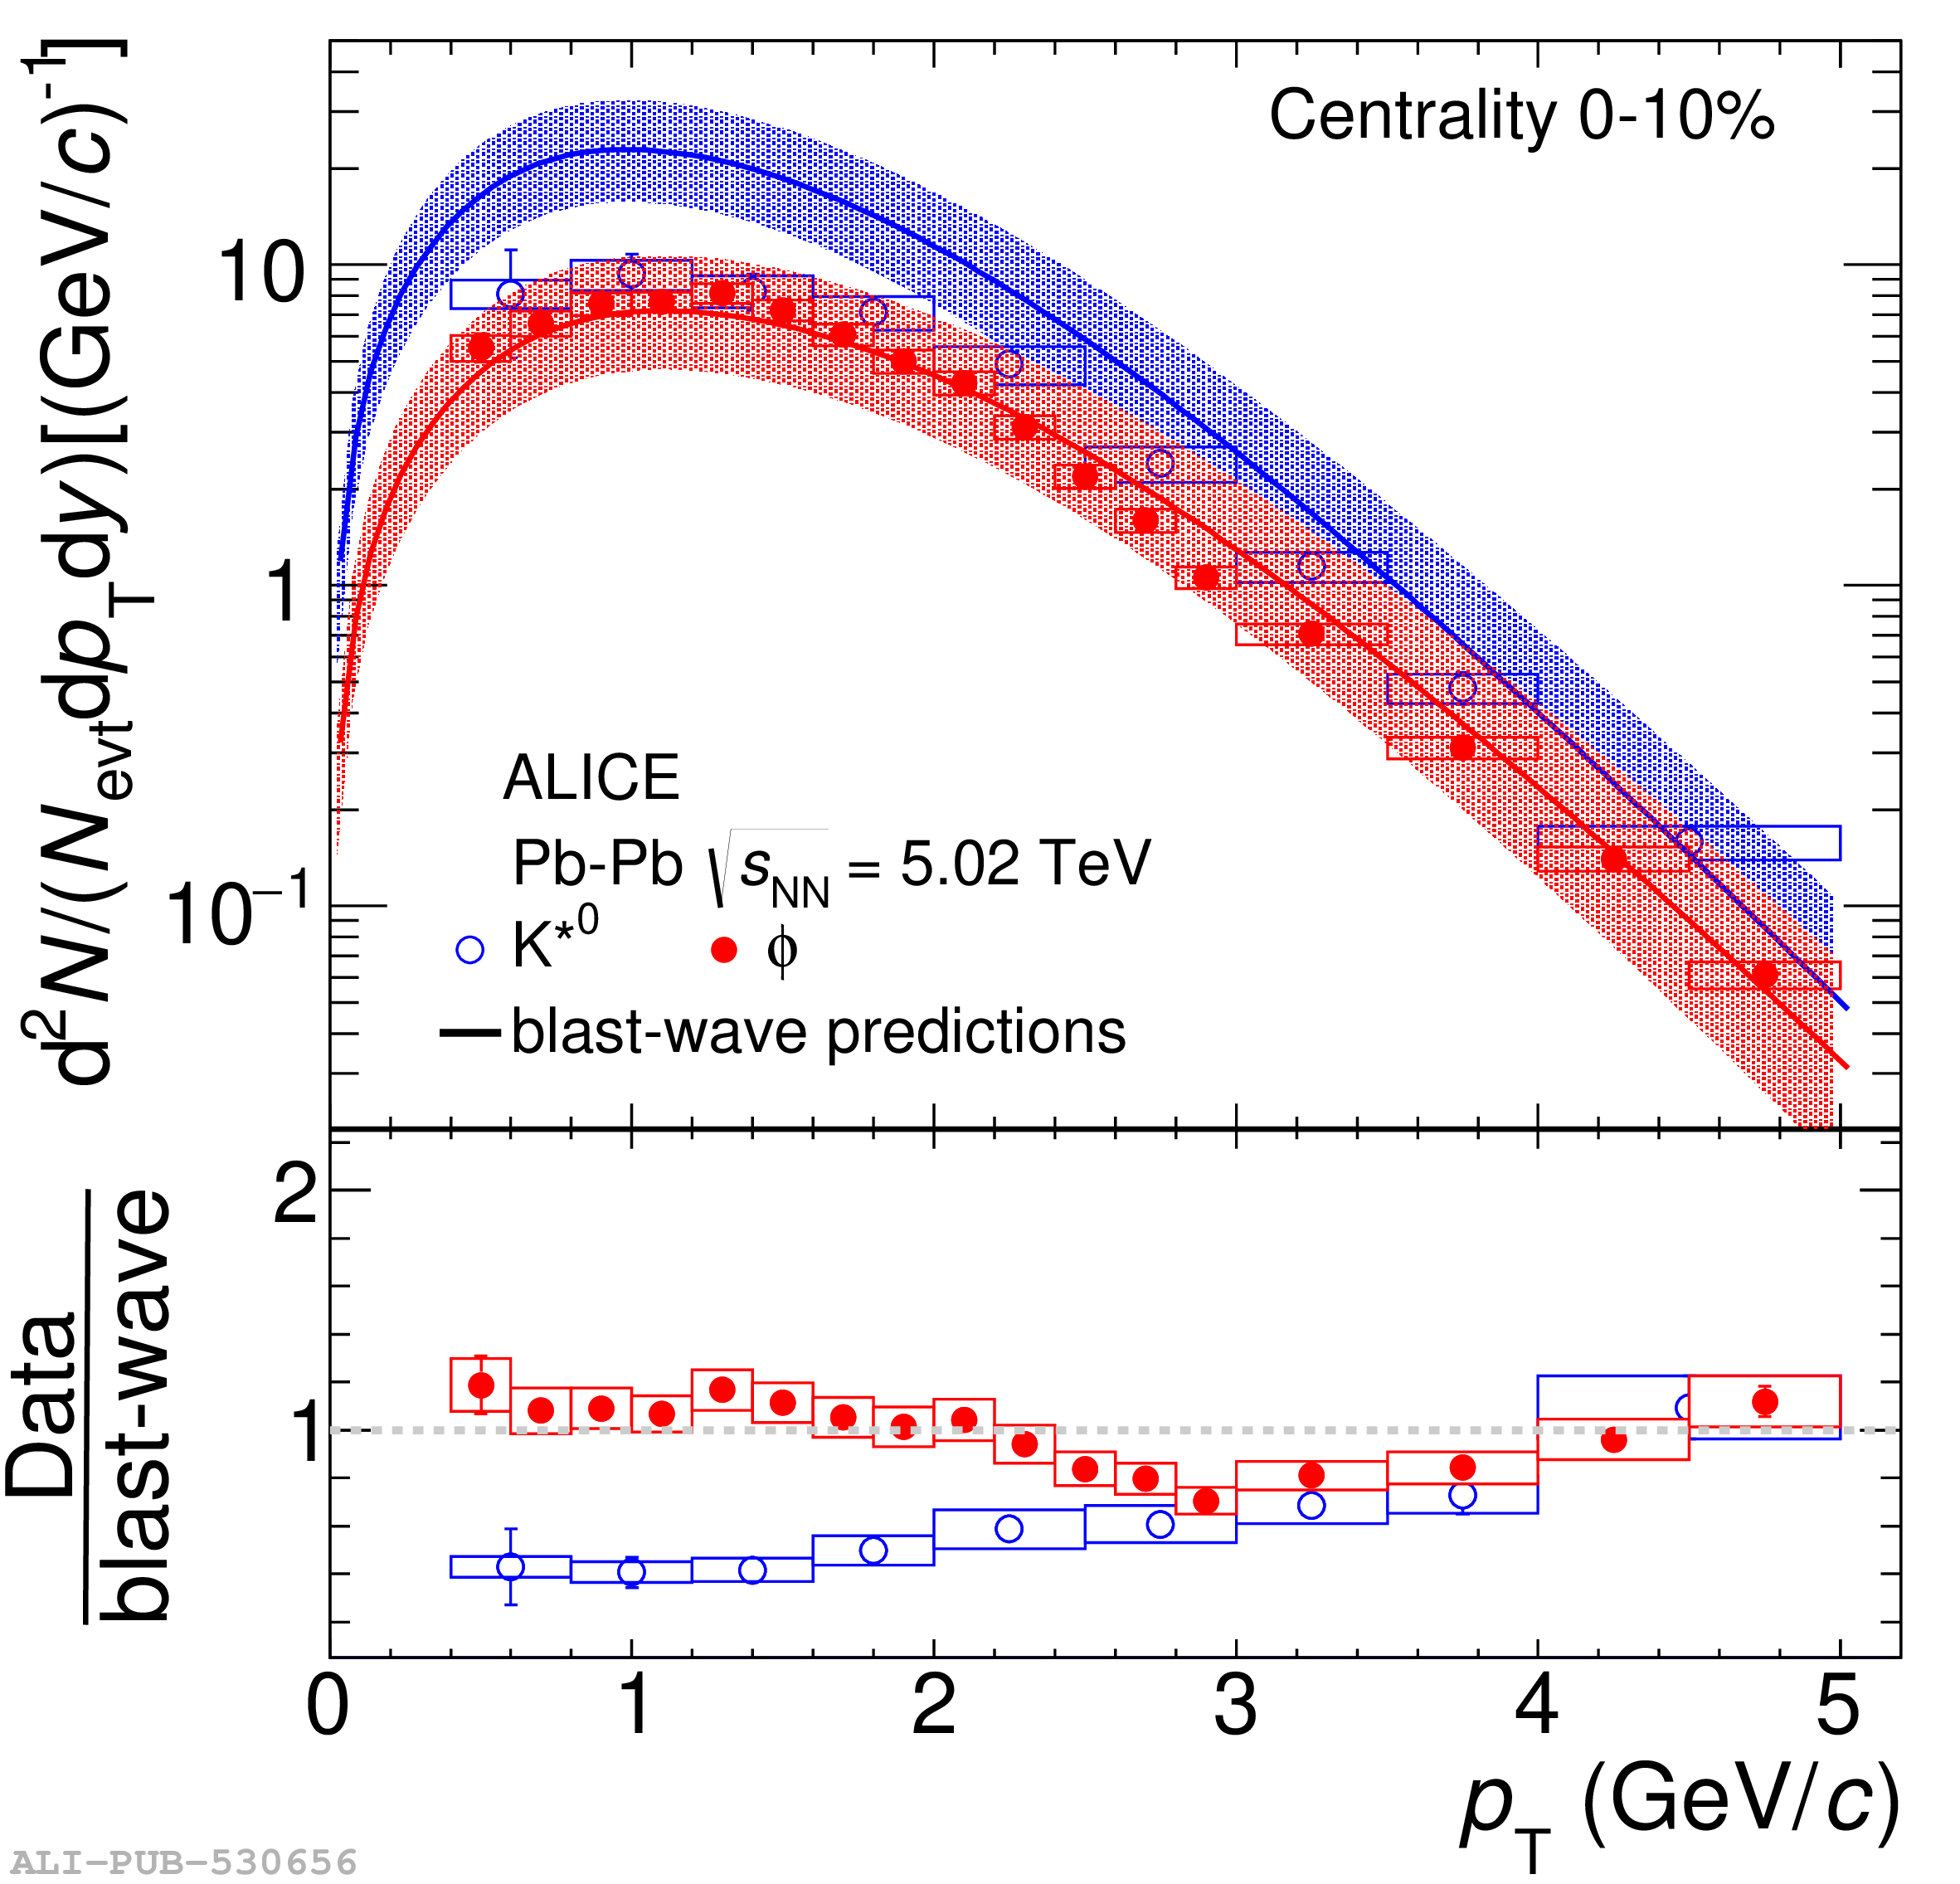  |
Figure 8
Transverse momentum integrated yield (d$N/$d$y$) of \kstar and \phim as a function of the averaged charged particle density (\avdndeta$_{|\eta|\textless0.5}$) in pp and \PbPb collisions at \snn $=$ 5.02 \TeV and compared with result from Pb--Pb collisions at \snn $=$ 2.76 \TeV . The statistical uncertainties on the data are shown by bars and the systematic uncertainties by boxes. The shaded box shows the uncorrelated systematic uncertainties. |  |
Figure 9
Mean transverse momentum of \kstar and \phim as a function of the averaged charged particle density (\avdndeta$_{|\eta|\textless0.5}$)in \PbPb and pp collisions at \snn $=$ 5.02 \TeV. Also shown forcomparison are the corresponding values from \PbPb and pp collisionsat \snn $=$ 2.76 \TeV , and Au--Auand pp collisions at \snn $=$ 200\GeV . Thestatistical uncertainties on the data are shown by bars and thesystematic uncertainties by boxes. The shaded box shows theuncorrelated systematic uncertainties. | 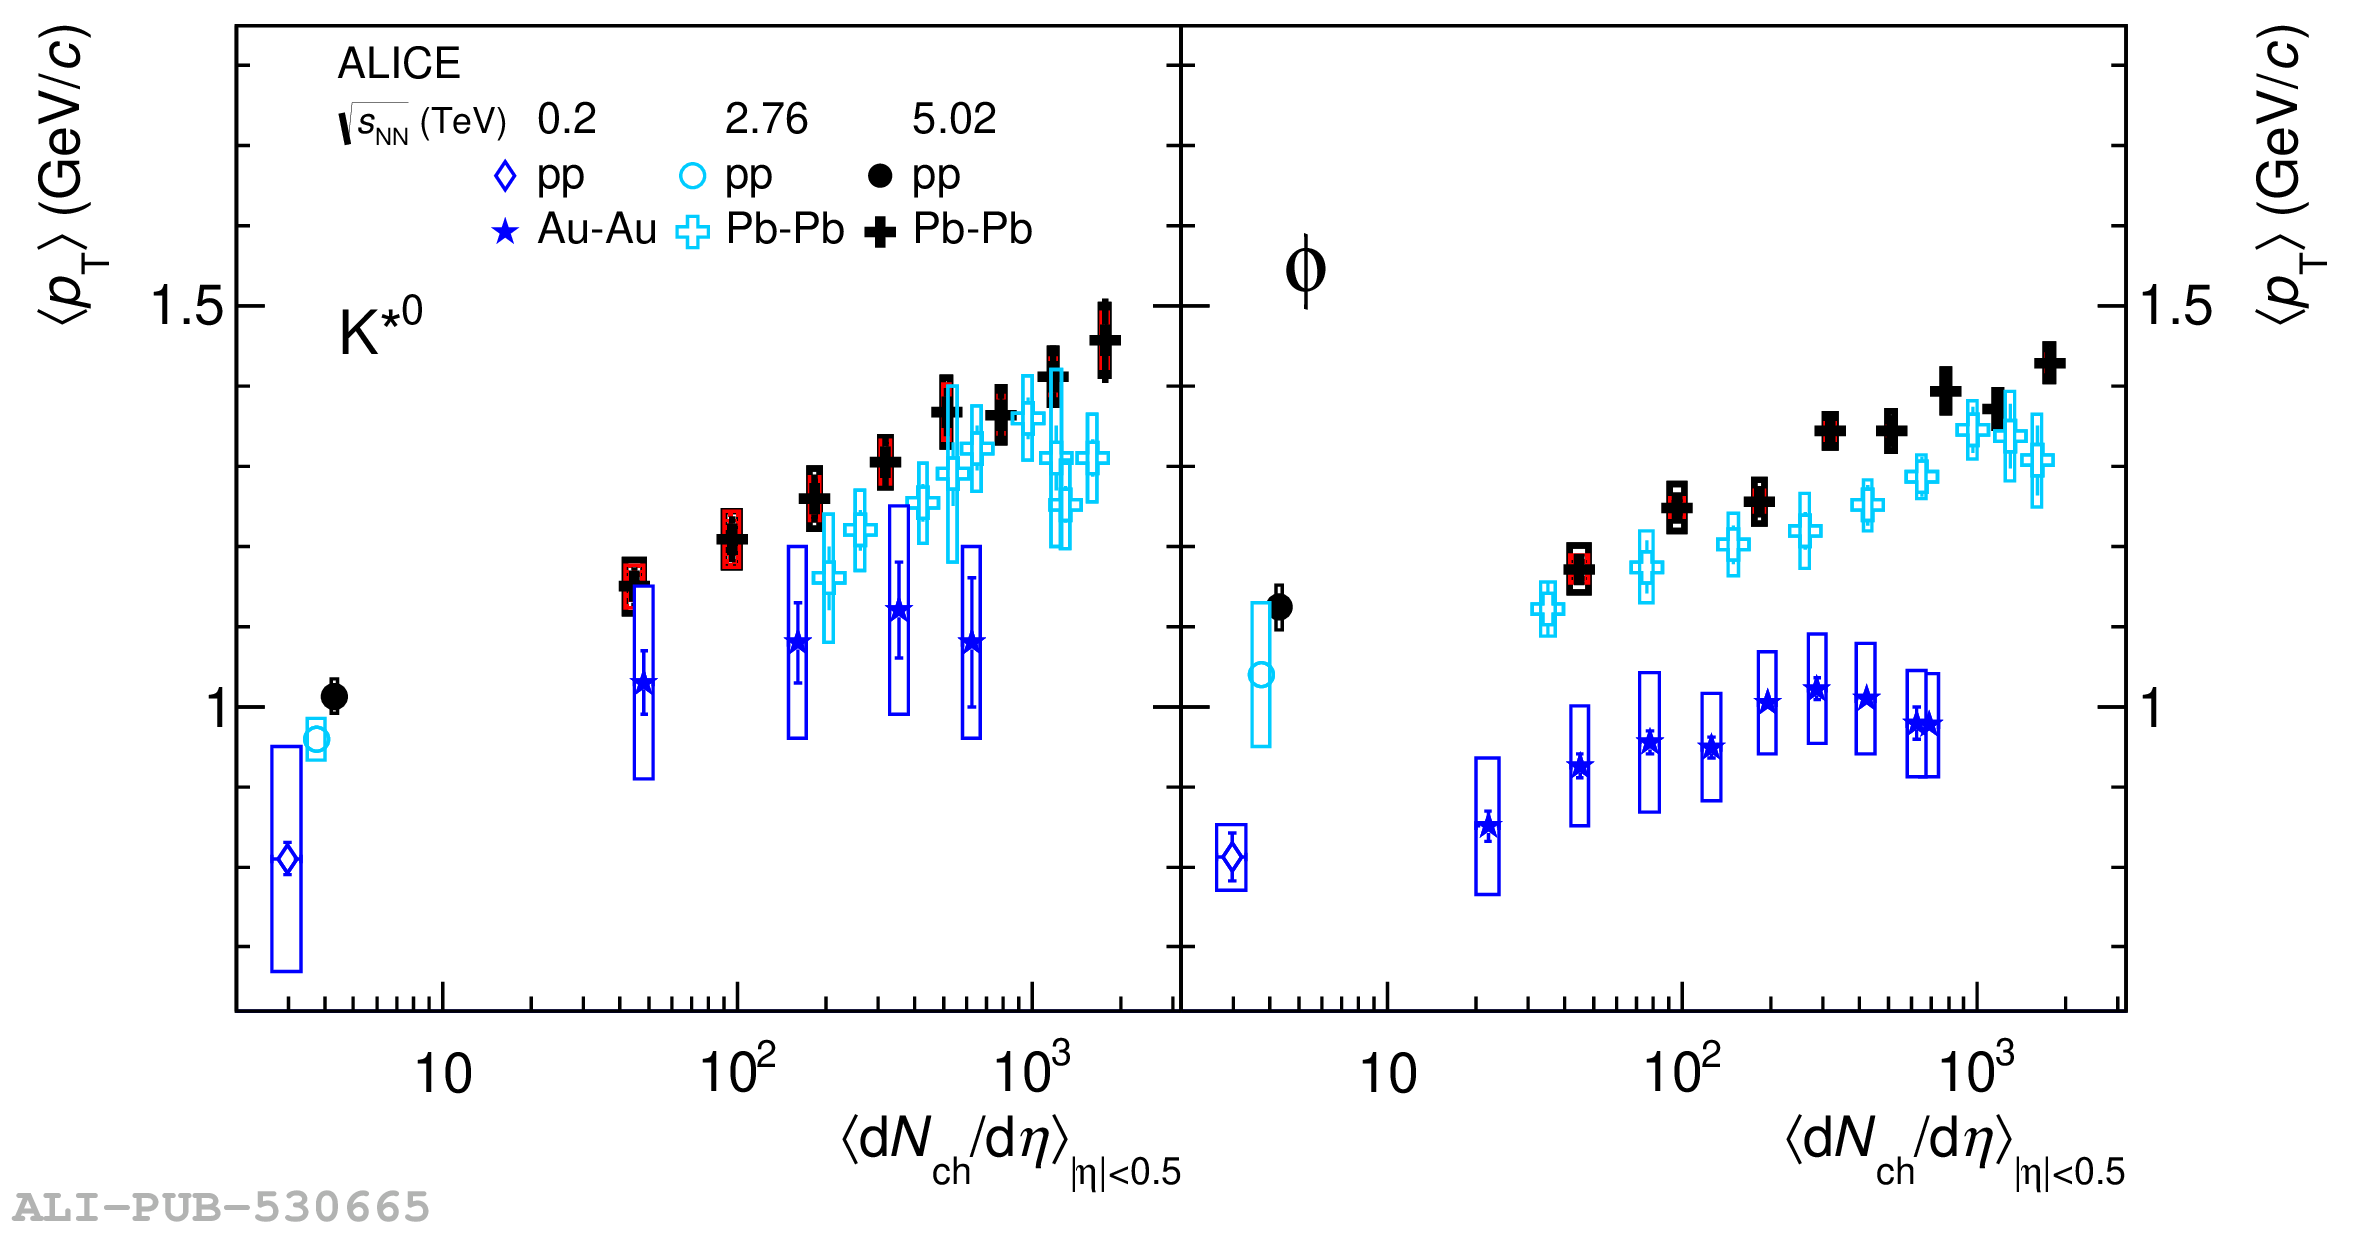 |
Figure 10
Mean transverse momentum of \kstar and \phim as a function of the averaged charged particle density (\avdndeta$_{|\eta|\textless0.5}$) in \PbPb collisions at \snn $=$ 5.02 \TeV compared with the corresponding values for other identified particles such as $\pi^{\pm}$, K$^{\pm}$, and p($\bar {\rm p}$) . The statistical uncertainties on the data are shown by bars and the systematic uncertainties by boxes. The shaded boxes show the uncorrelated systematic uncertainties. | 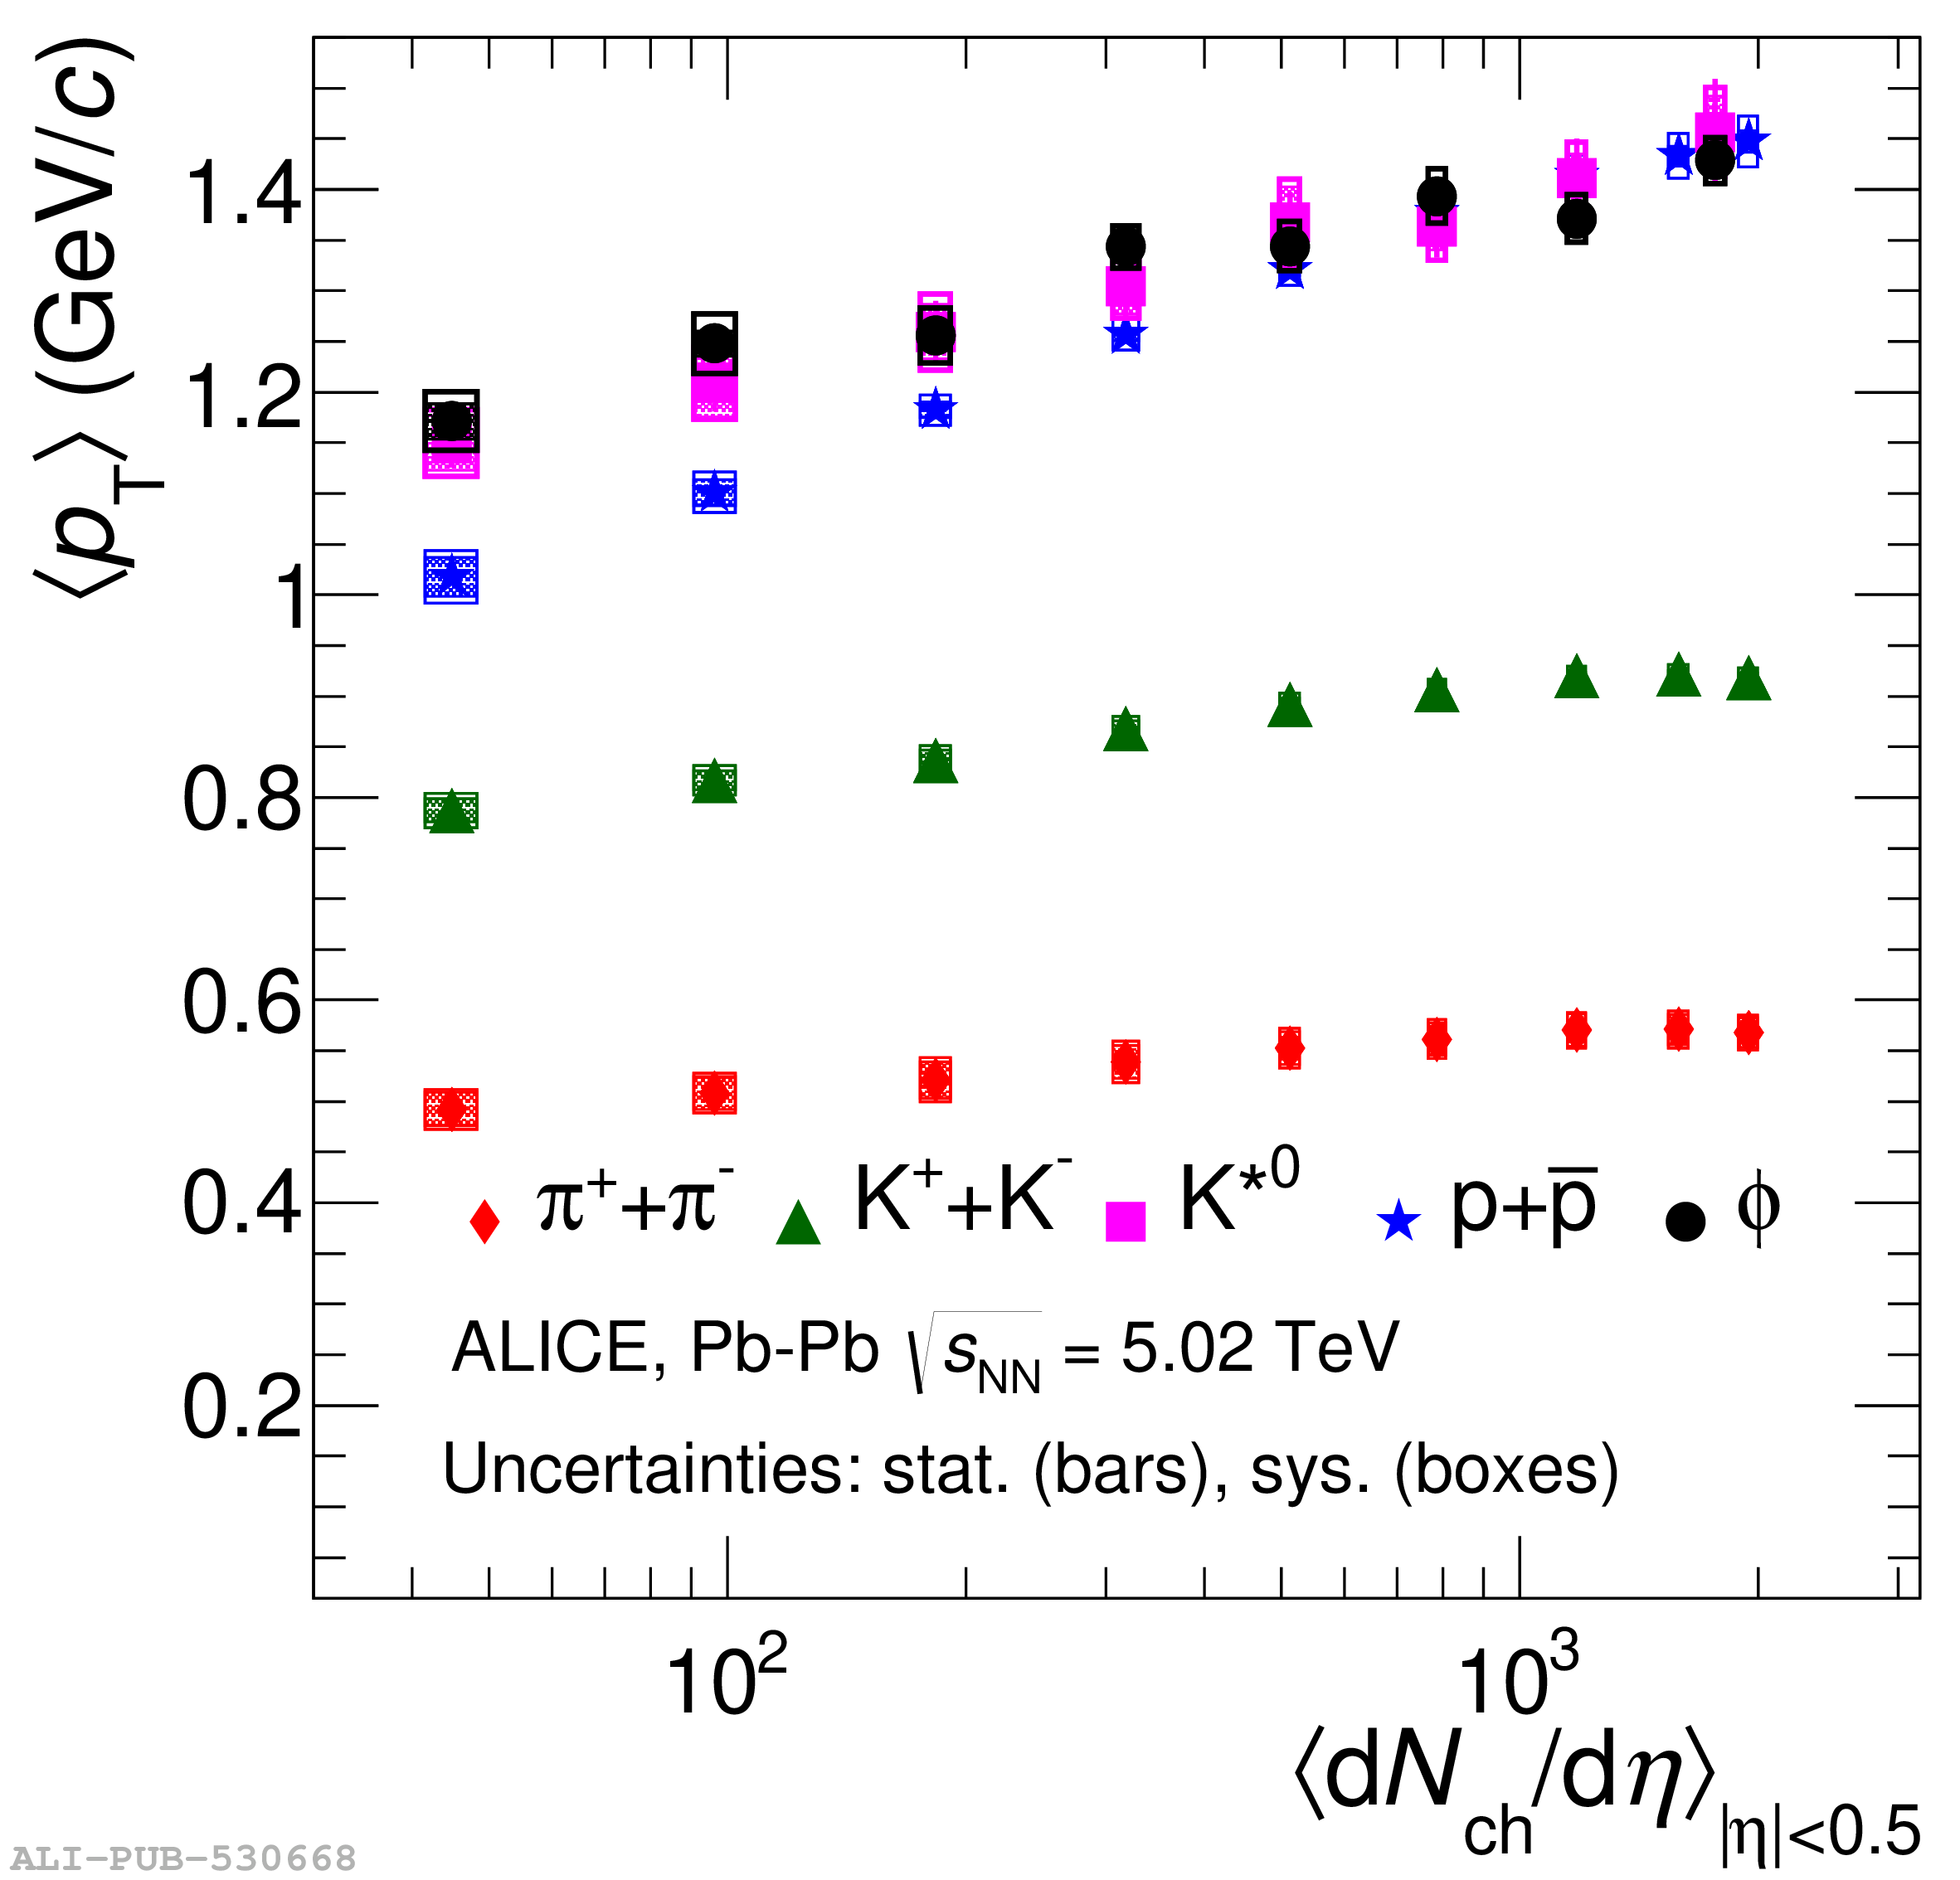 |
Figure 11
Particle ratios $\mathrm{K^{*0}/K}$ [panels (a) and (b)] and $\mathrm{\phi/K}$ [panels (c) and (d)] in \pp, \dAu, \pPb, \CuCu, \AuAu, and \PbPb collisions . In panels (a) and (c) these ratios are presented as a function of \avdndeta$^{1/3}$. These ratios are measured as \kskm and \phikm in \PbPb collisions at \snn $=$ 2.76 TeV and in STAR experiment. The values of \avdndeta$_{|\eta|\textless0.5}$ were measured at midrapidity In panels (b) and (d), these ratios are presented for \pp, central \dAu, \pPb, and heavy-ion collisions as a function of \snn. The values given by a grand-canonical thermal model with a chemical freezeout temperature of 156 MeV are also shown . For quantities marked ``*", boxes represent the total uncertainty (separate uncertainties are not reported). Otherwise, bars represent the statistical uncertainties and boxes represent the systematic uncertainties (including centrality-uncorrelated and centrality-correlated components). EPOS3 model predictions of $\mathrm{K^{*0}/K}$ and $\mathrm{\phi/K}$ ratios in \PbPb collisions are also shown as violet lines. |  |
Figure 12
The nuclear modification factor, \RAA, as a function of \pt for \kstar and \phim mesons at midrapidity ($|y| <$ 0.5) for different centrality classes in \PbPb collisions at \snn $=$ 5.02 \TeV. The statistical and systematic uncertainties are shown as bars and boxes, respectively. The boxes around unity indicate the uncertainty on the normalization of \RAA. |  |
Figure 13
The nuclear modification factor, \RAA, as a function of \pt for \kstar for different centrality classes in \PbPb collisions at \snn $=$ 5.02 \TeV compared with the results from \PbPb collisions at \snn $=$ 2.76 \TeV . The statistical and systematic uncertainties are shown as bars and boxes, respectively. The boxes around unity indicate the respective uncertainty on the normalization of \RAA. | 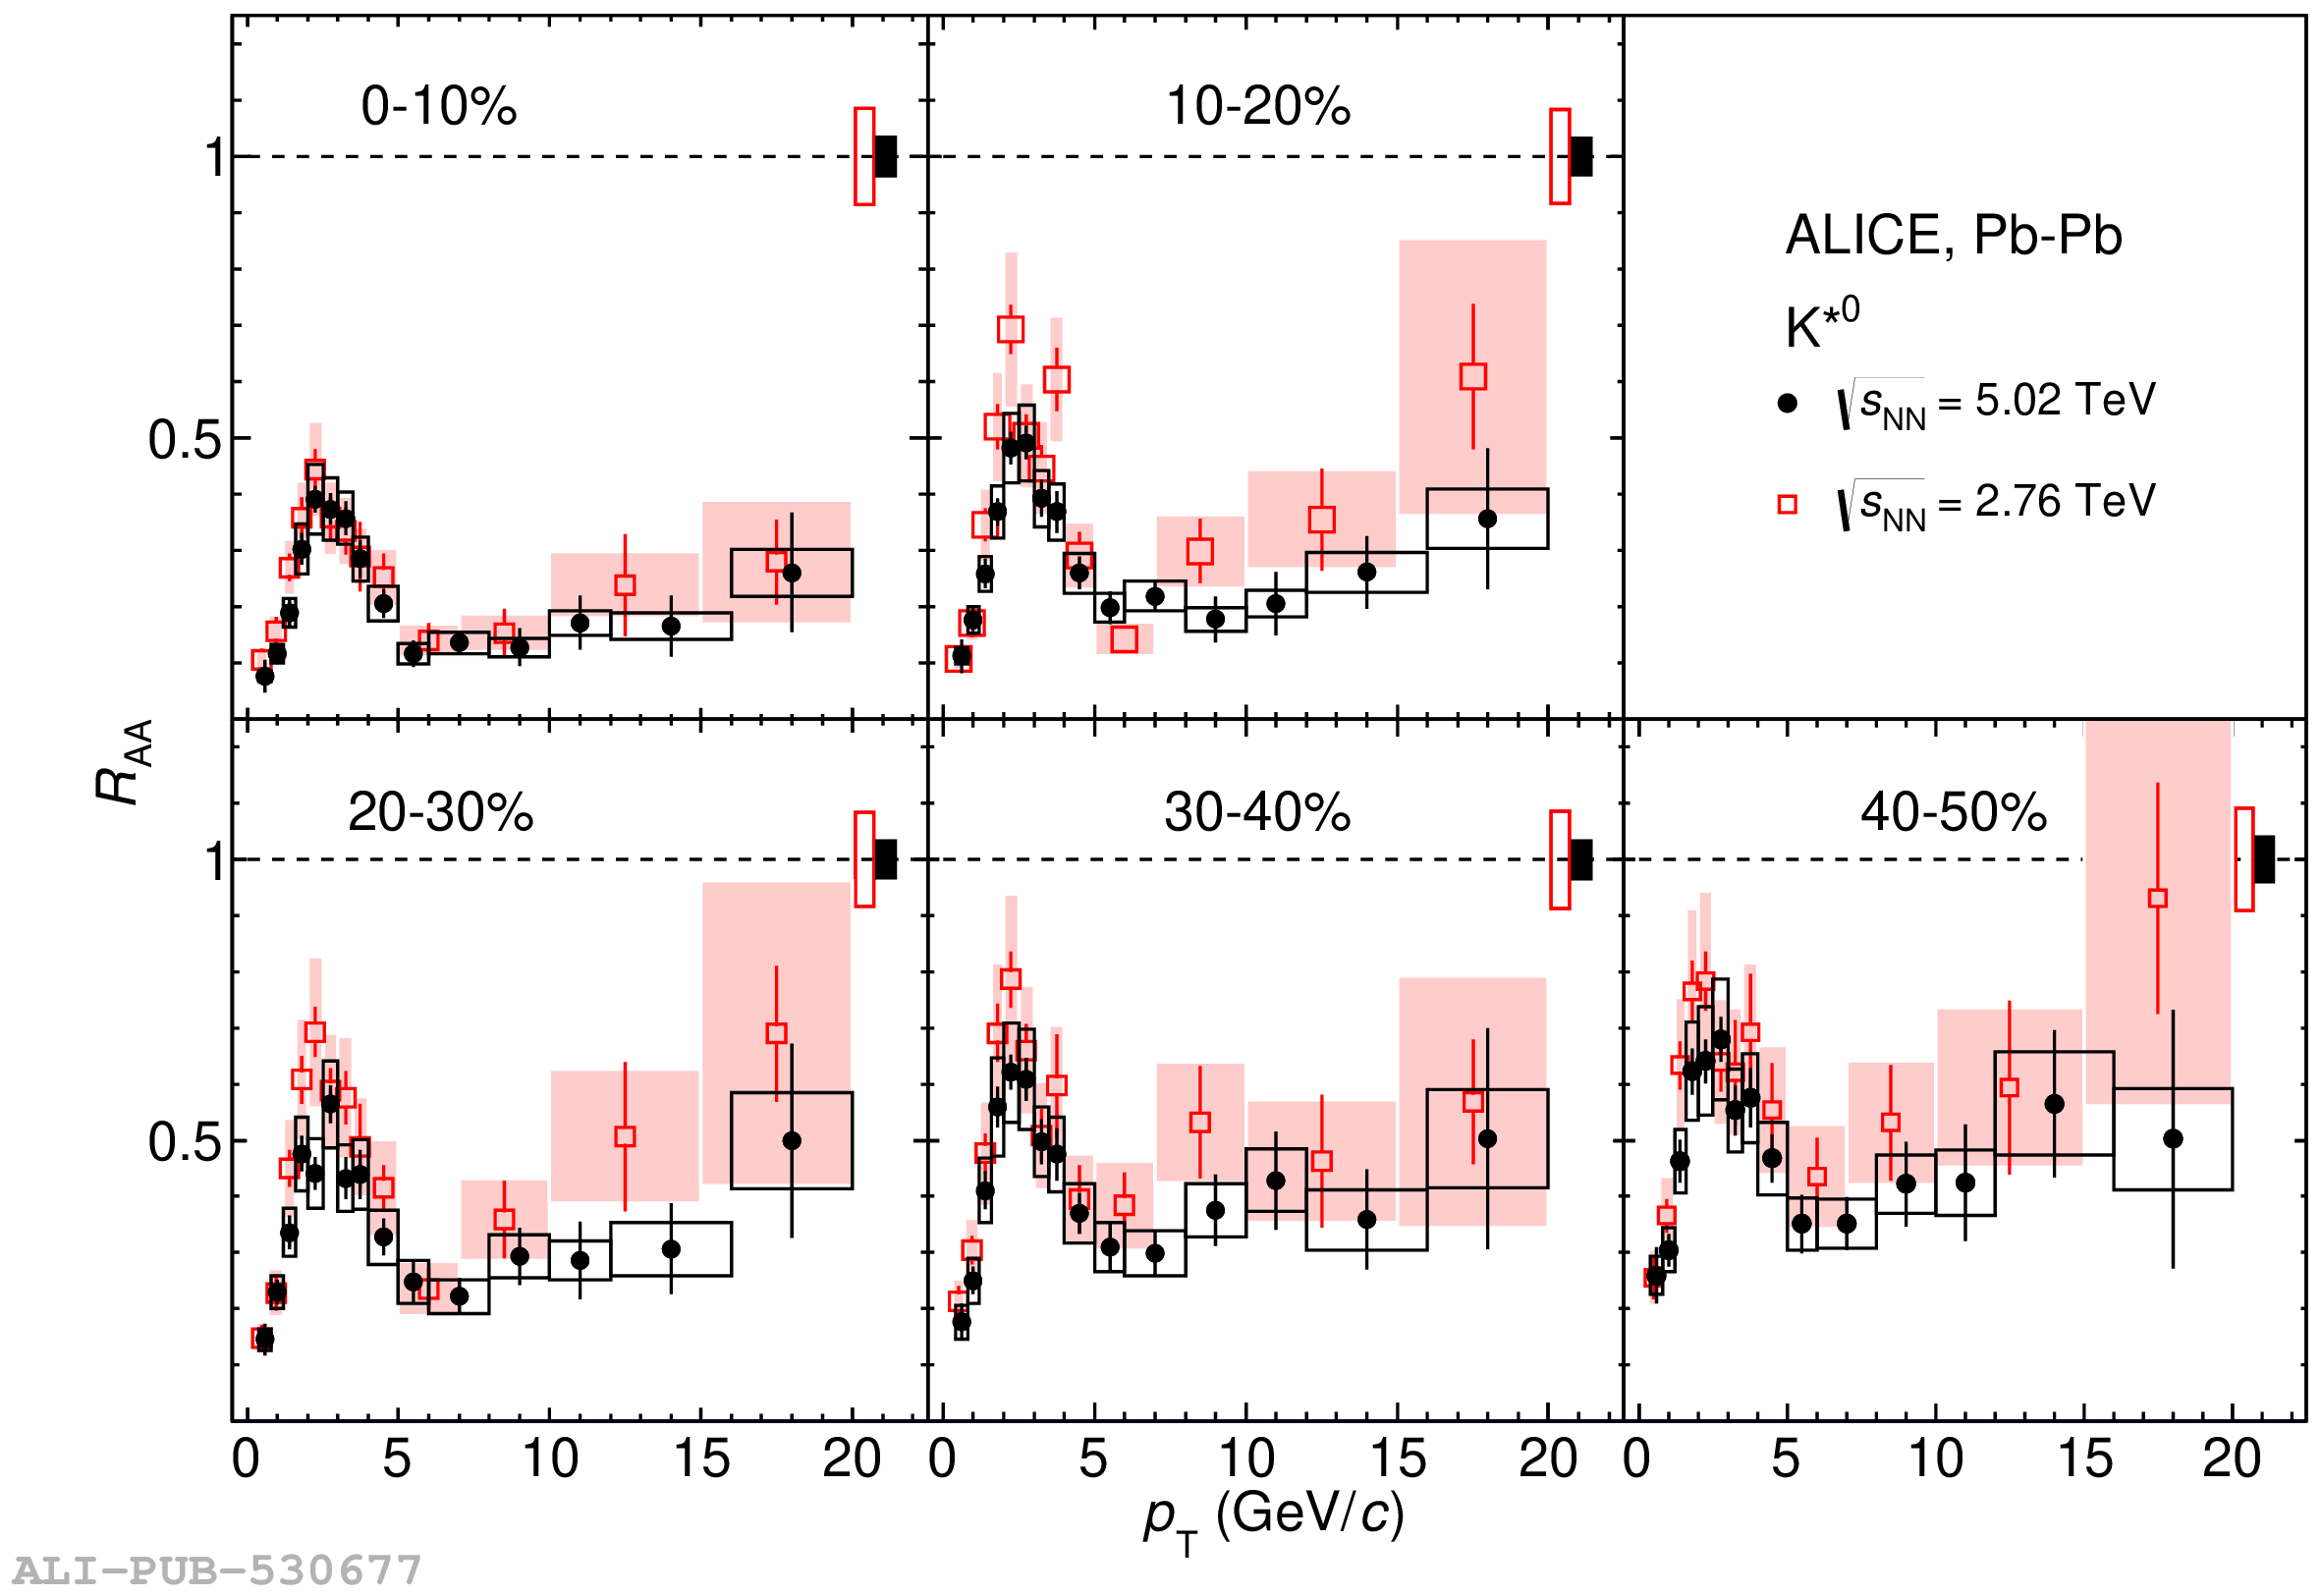 |
Figure 14
The nuclear modification factor, \RAA, as a function of \pt for \phim mesons in different centrality classes in \PbPb collisions at \snn $=$ 5.02 \TeV compared with the results in \PbPb collisions at \snn $=$ 2.76 \TeV . The statistical and systematic uncertainties are shown as bars and boxes, respectively. The boxes around unity indicate the uncertainty on the normalization of \RAA. | 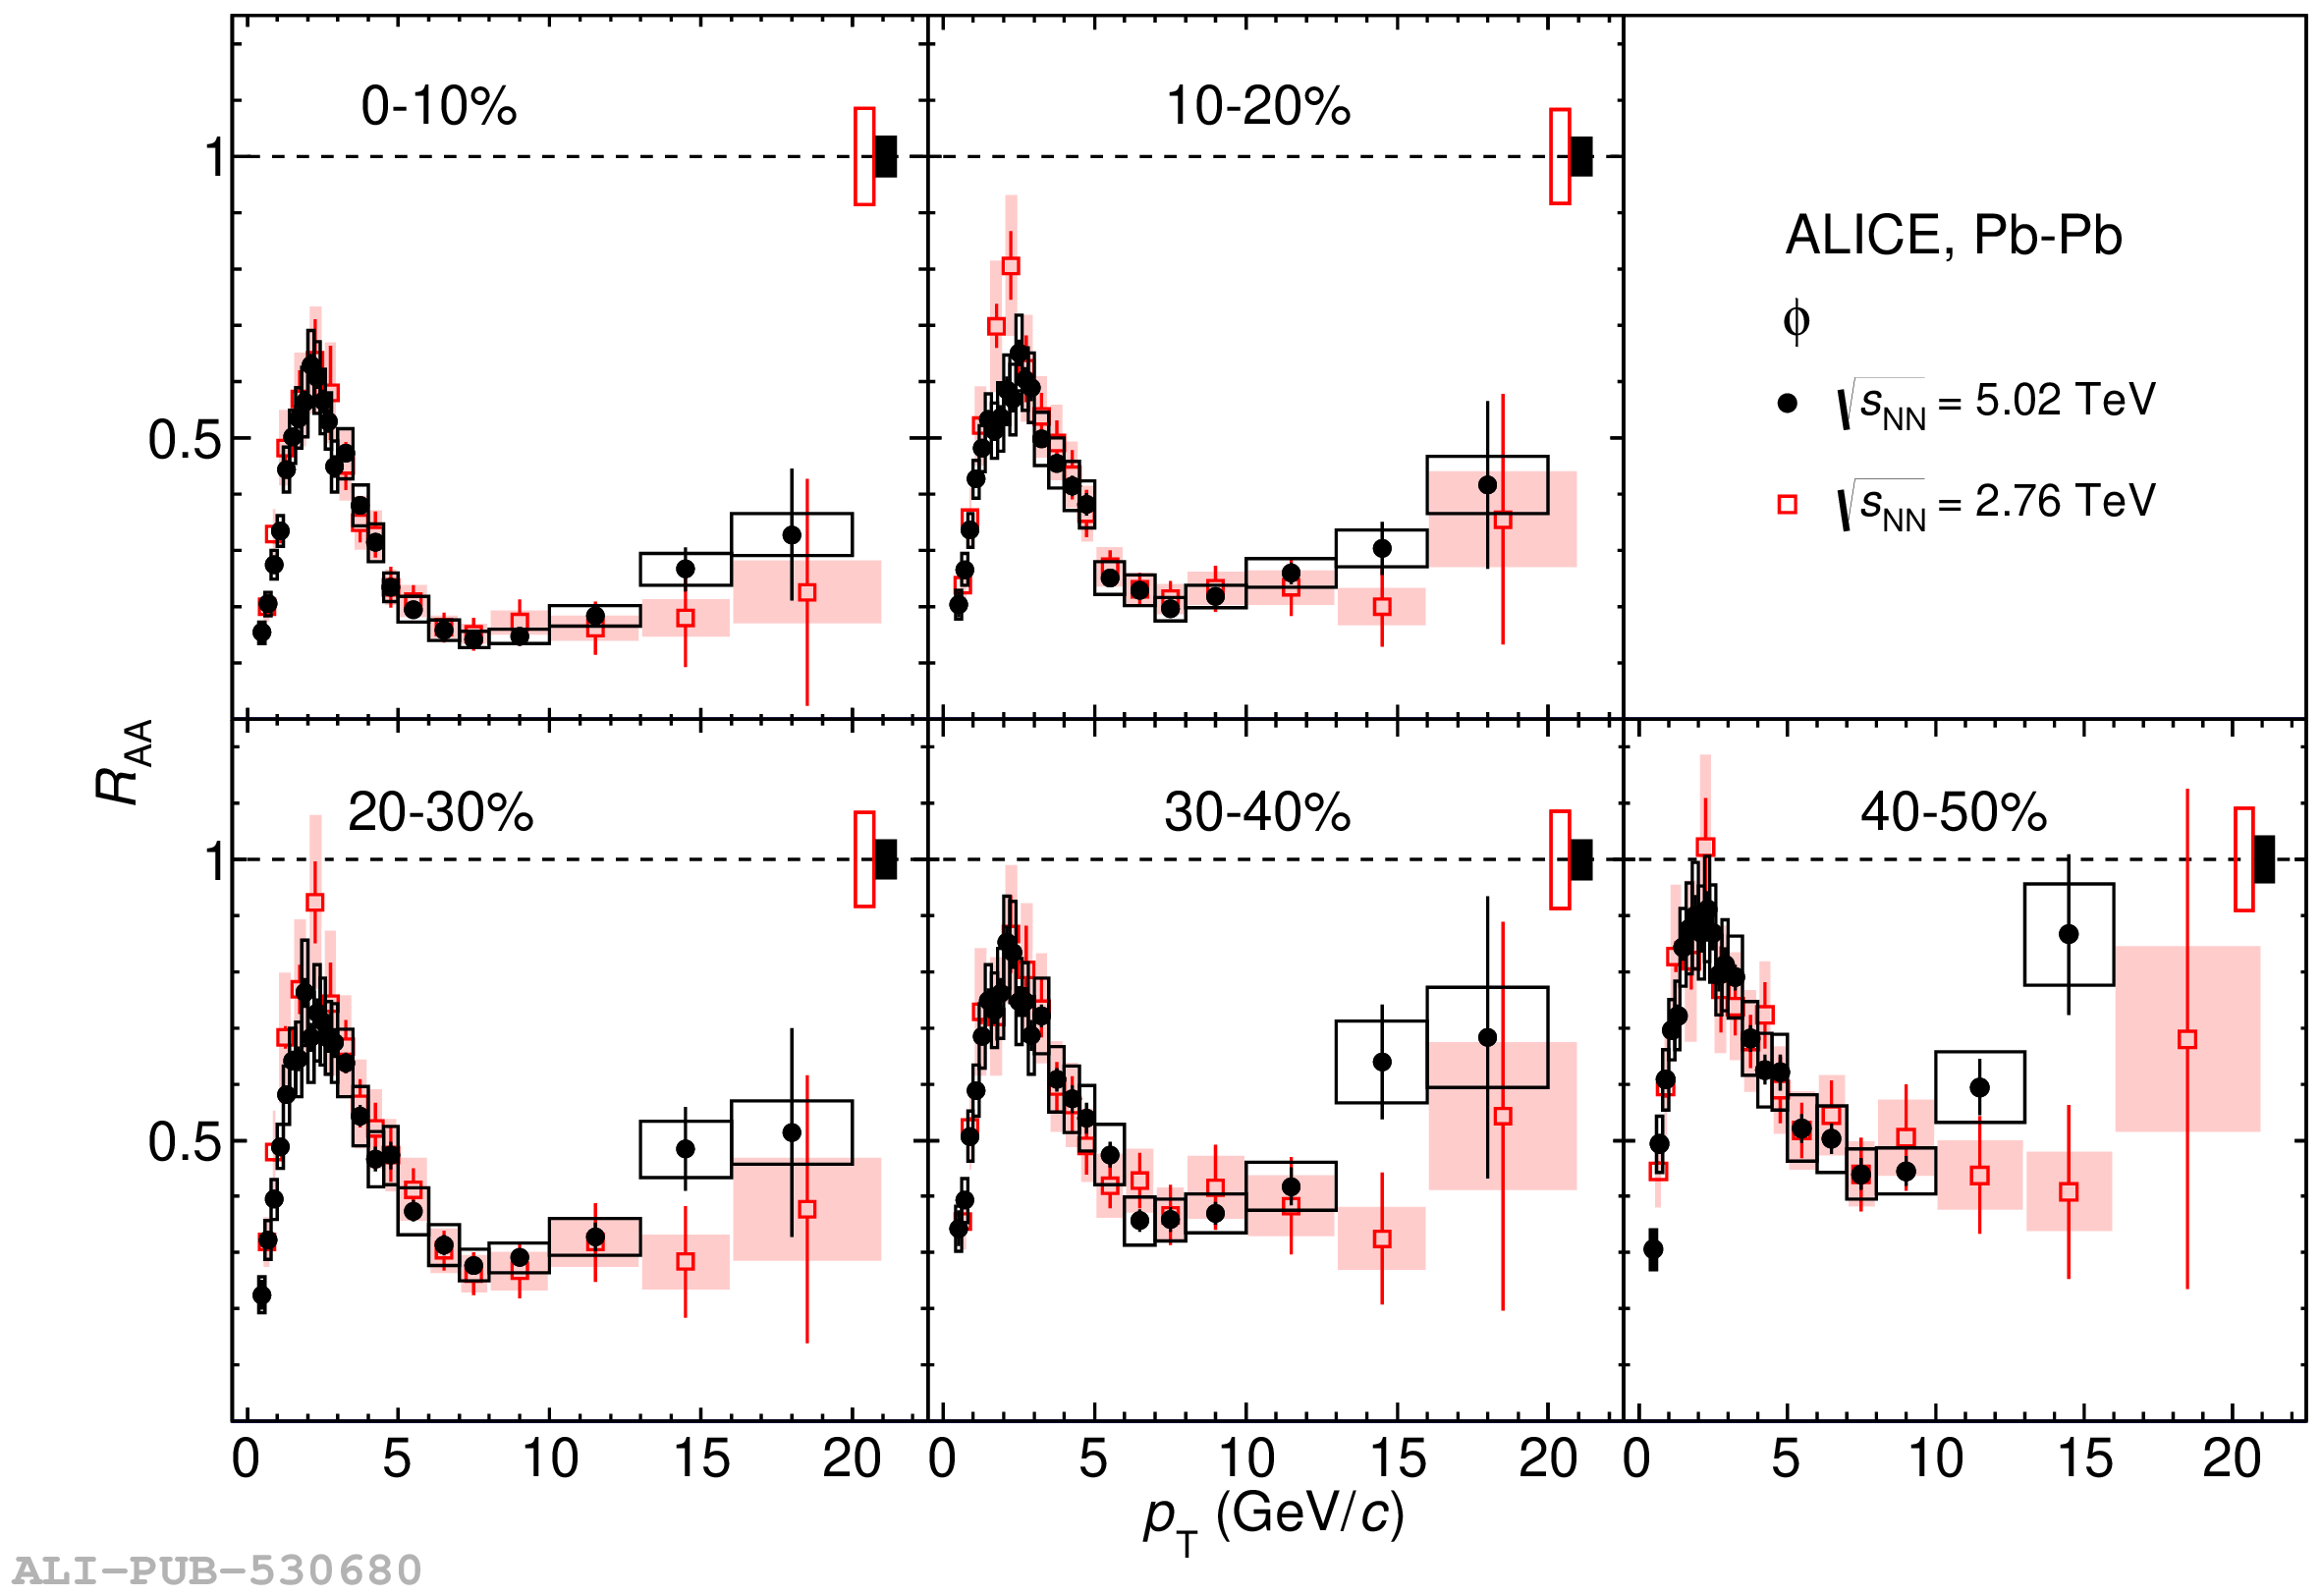 |
Figure 15
The nuclear modification factor, \RAA, as a function of \pt for \kstar and \phim mesons in \PbPb collisions for different centrality classes at \snn $=$ 5.02 \TeV. The results are compared with the \RAA values of $\pi$, K, and p measured by ALICE . The statistical and systematic uncertainties are shown as bars and boxes, respectively. The boxes around unity indicate the uncertainty on the normalization of \RAA. | 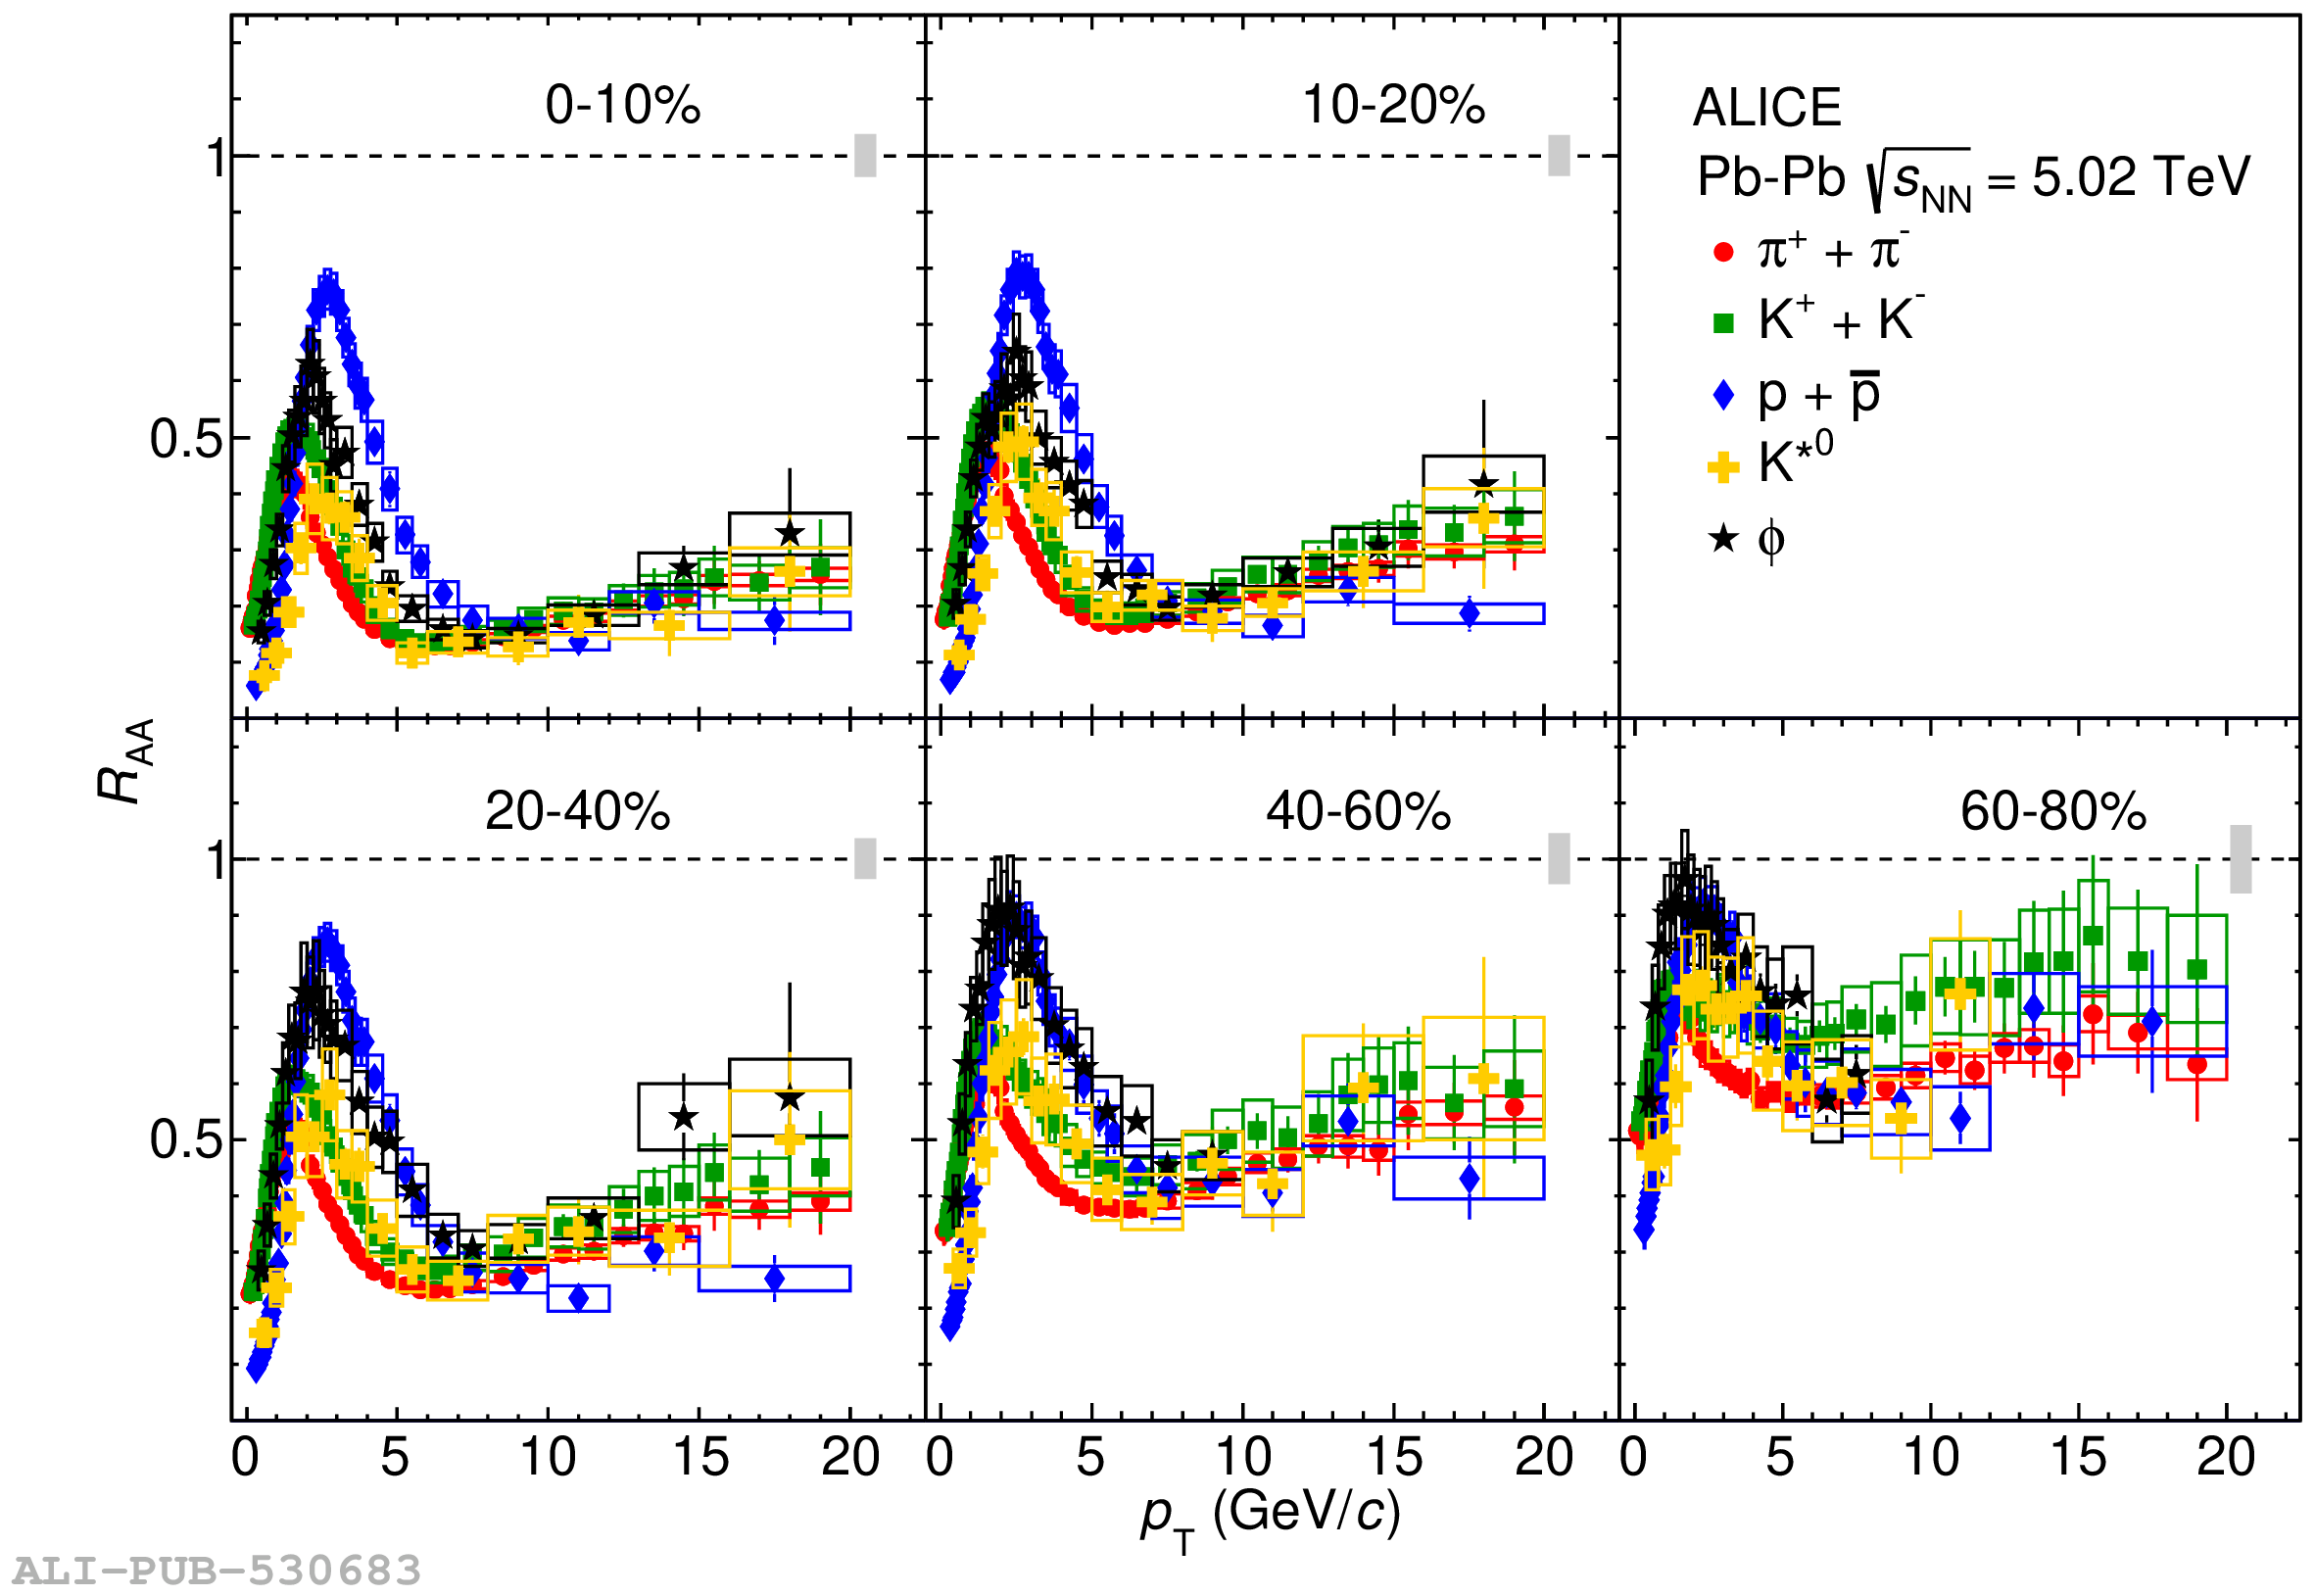 |