The first results on K$^{*}$(892)$^{\mathrm{\pm}}$ resonance production in inelastic pp collisions at LHC energies of $\sqrt{s} = 5.02$, 8, and 13 TeV are presented. The K$^{*}$(892)$^{\mathrm{\pm}}$ has been reconstructed via its hadronic decay channel K$^{*}$(892)$^{\mathrm{\pm}}$ $\rightarrow$ $\mathrm {K^0_S}$ $~+~\pi^{\pm}$ with the ALICE detector. Measurements of transverse momentum distributions, $p_{\mathrm{T}}$-integrated yields, and mean transverse momenta for charged K$^{*}$(892) are found to be consistent with previous ALICE measurements for neutral K$^{*}$(892) within uncertainties. For $p_{\mathrm{T}} > 1$ GeV/$c$ the K$^{*}$(892)$^{\mathrm{\pm}}$ transverse momentum spectra become harder with increasing centre-of-mass energy from 5.02 to 13 TeV, similar to what previously observed for charged kaons and pions. For $p_{\mathrm{T}} <~ 1$ GeV/$c$ the K$^{*}$(892)$^{\mathrm{\pm}}$ yield does not evolve significantly and the abundance of K$^{*}$(892)$^{\mathrm{\pm}}$ relative to K is rather independent of the collision energy. The transverse momentum spectra, measured for K$^{*}$(892)$^{\mathrm{\pm}}$ at midrapidity in the interval $0 <~ p_{\mathrm{T}} <~ 15$ GeV/$c$, are not well described by predictions of different versions of PYTHIA 6, PYTHIA 8 and EPOS-LHC event generators. These generators reproduce the measured $p_{\mathrm{T}}$-integrated K$^{*\mathrm{\pm}}$/K ratios and describe well the momentum dependence for $p_{\mathrm{T}} <~ 2$ GeV/$c$.
Phys. Lett. B 828 (2022) 137013
HEP Data
e-Print: arXiv:2105.05760 | PDF | inSPIRE
CERN-EP-2021-086
Figure group
Figure 1
(Left panels) The \kshort\ppm invariant mass distributions at \modrap $<$ 0.5 in pp collisions at \sqrtS = 5.02, 8, and 13 TeV. The background shape estimated by the event-mixing technique is shown with empty red circles. Statistical uncertainties are shown with error bars (Right panels) The \kshort\ppm invariant mass distributions in pp collisions at \sqrtS = 5.02, 8, and 13 TeV after background subtraction. The solid red curve is the result of the fit with Eq. \ref{eqn1}; the dashed red line describes the residual background distribution given by Eq. \ref{eqn2}. Statistical uncertainties are shown with error bars. |  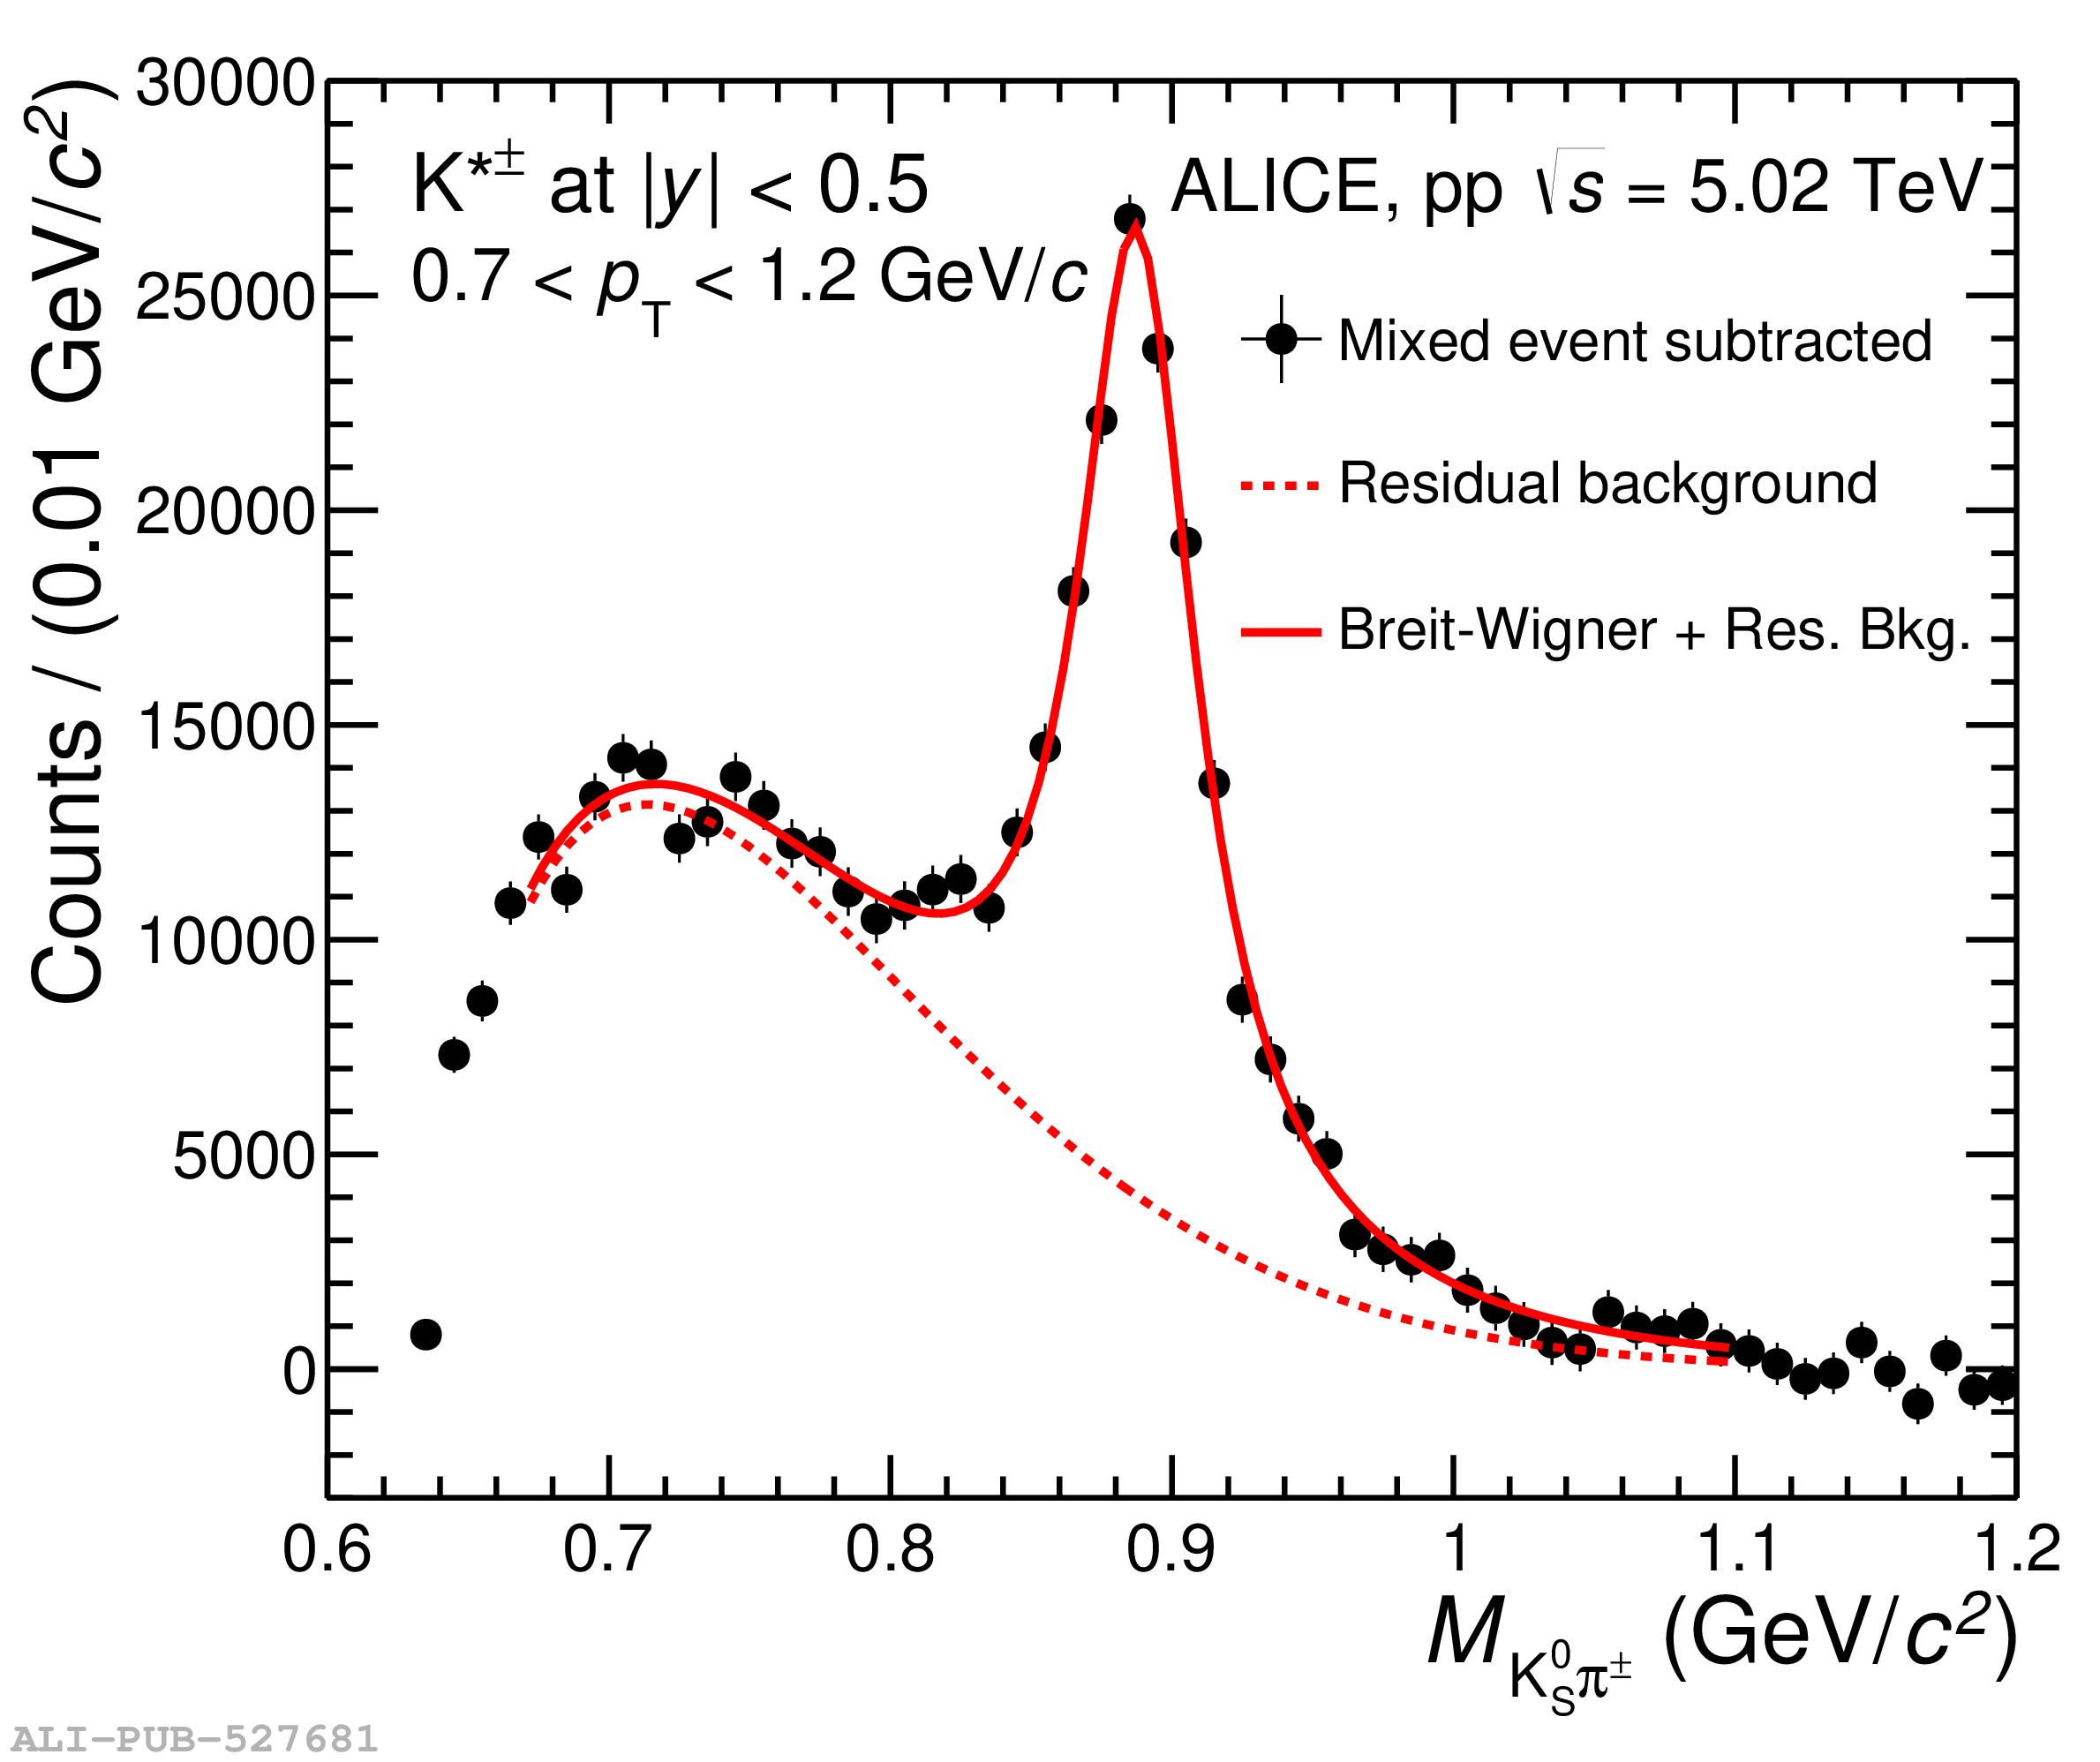 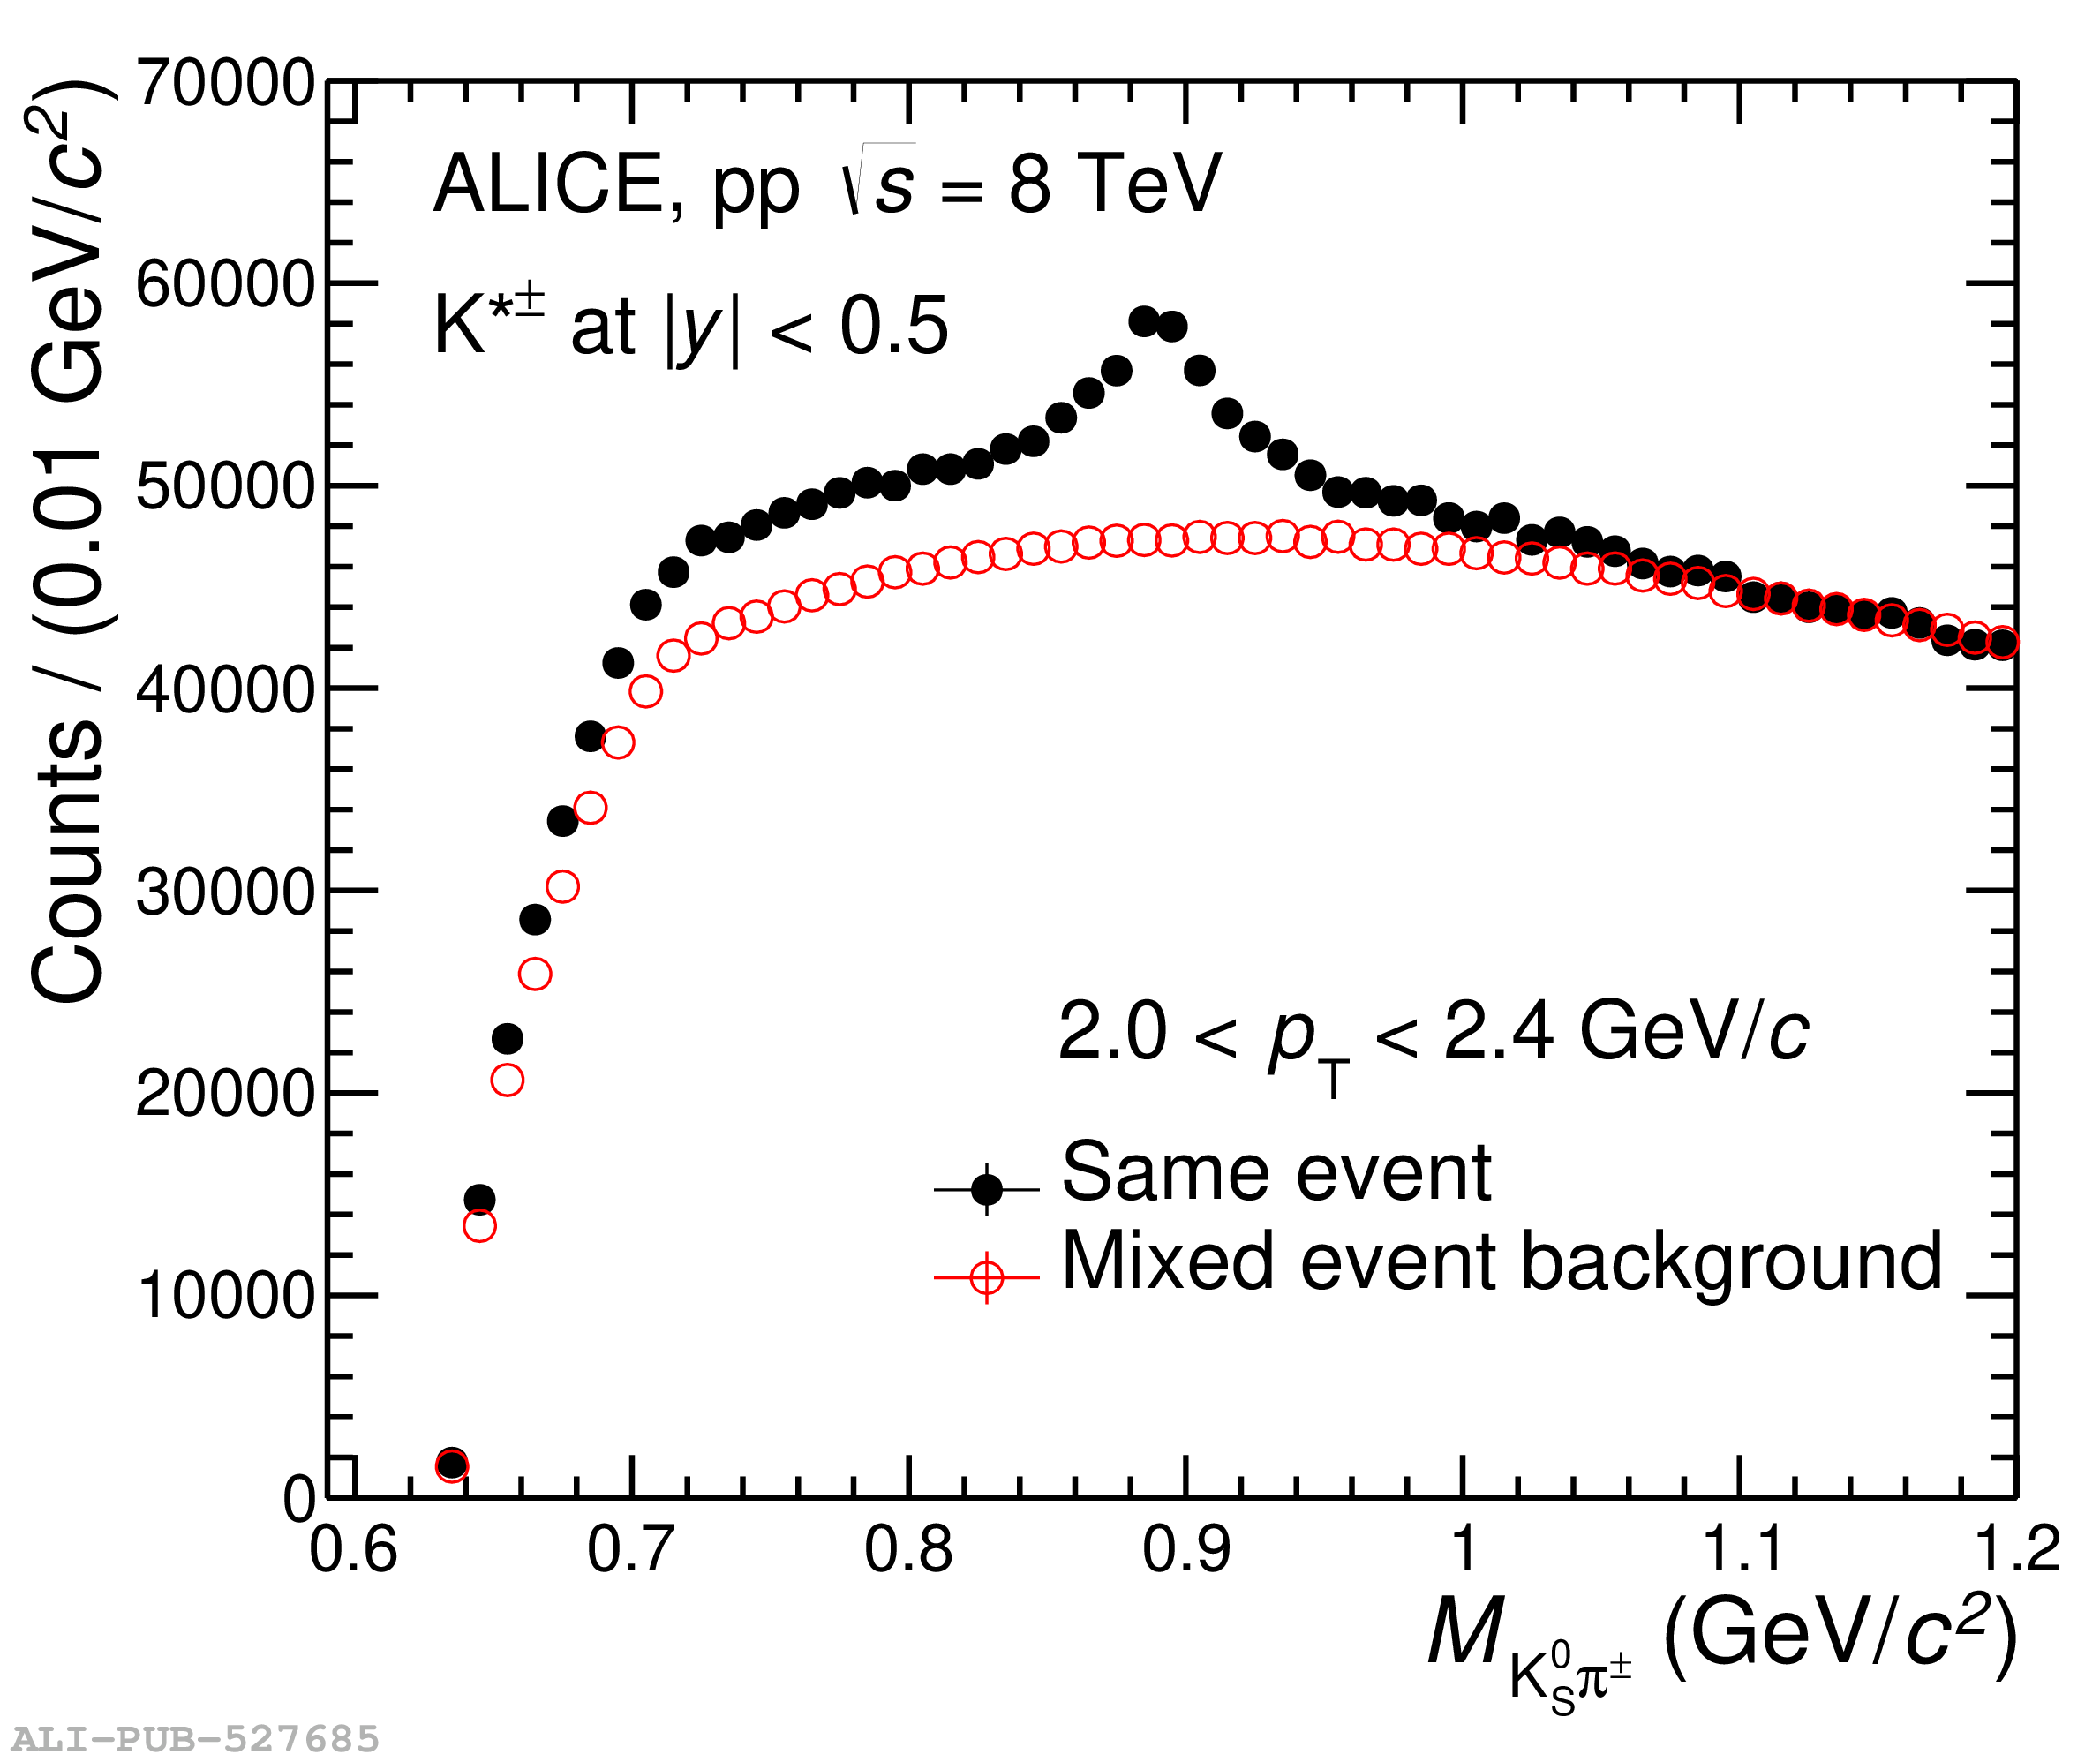 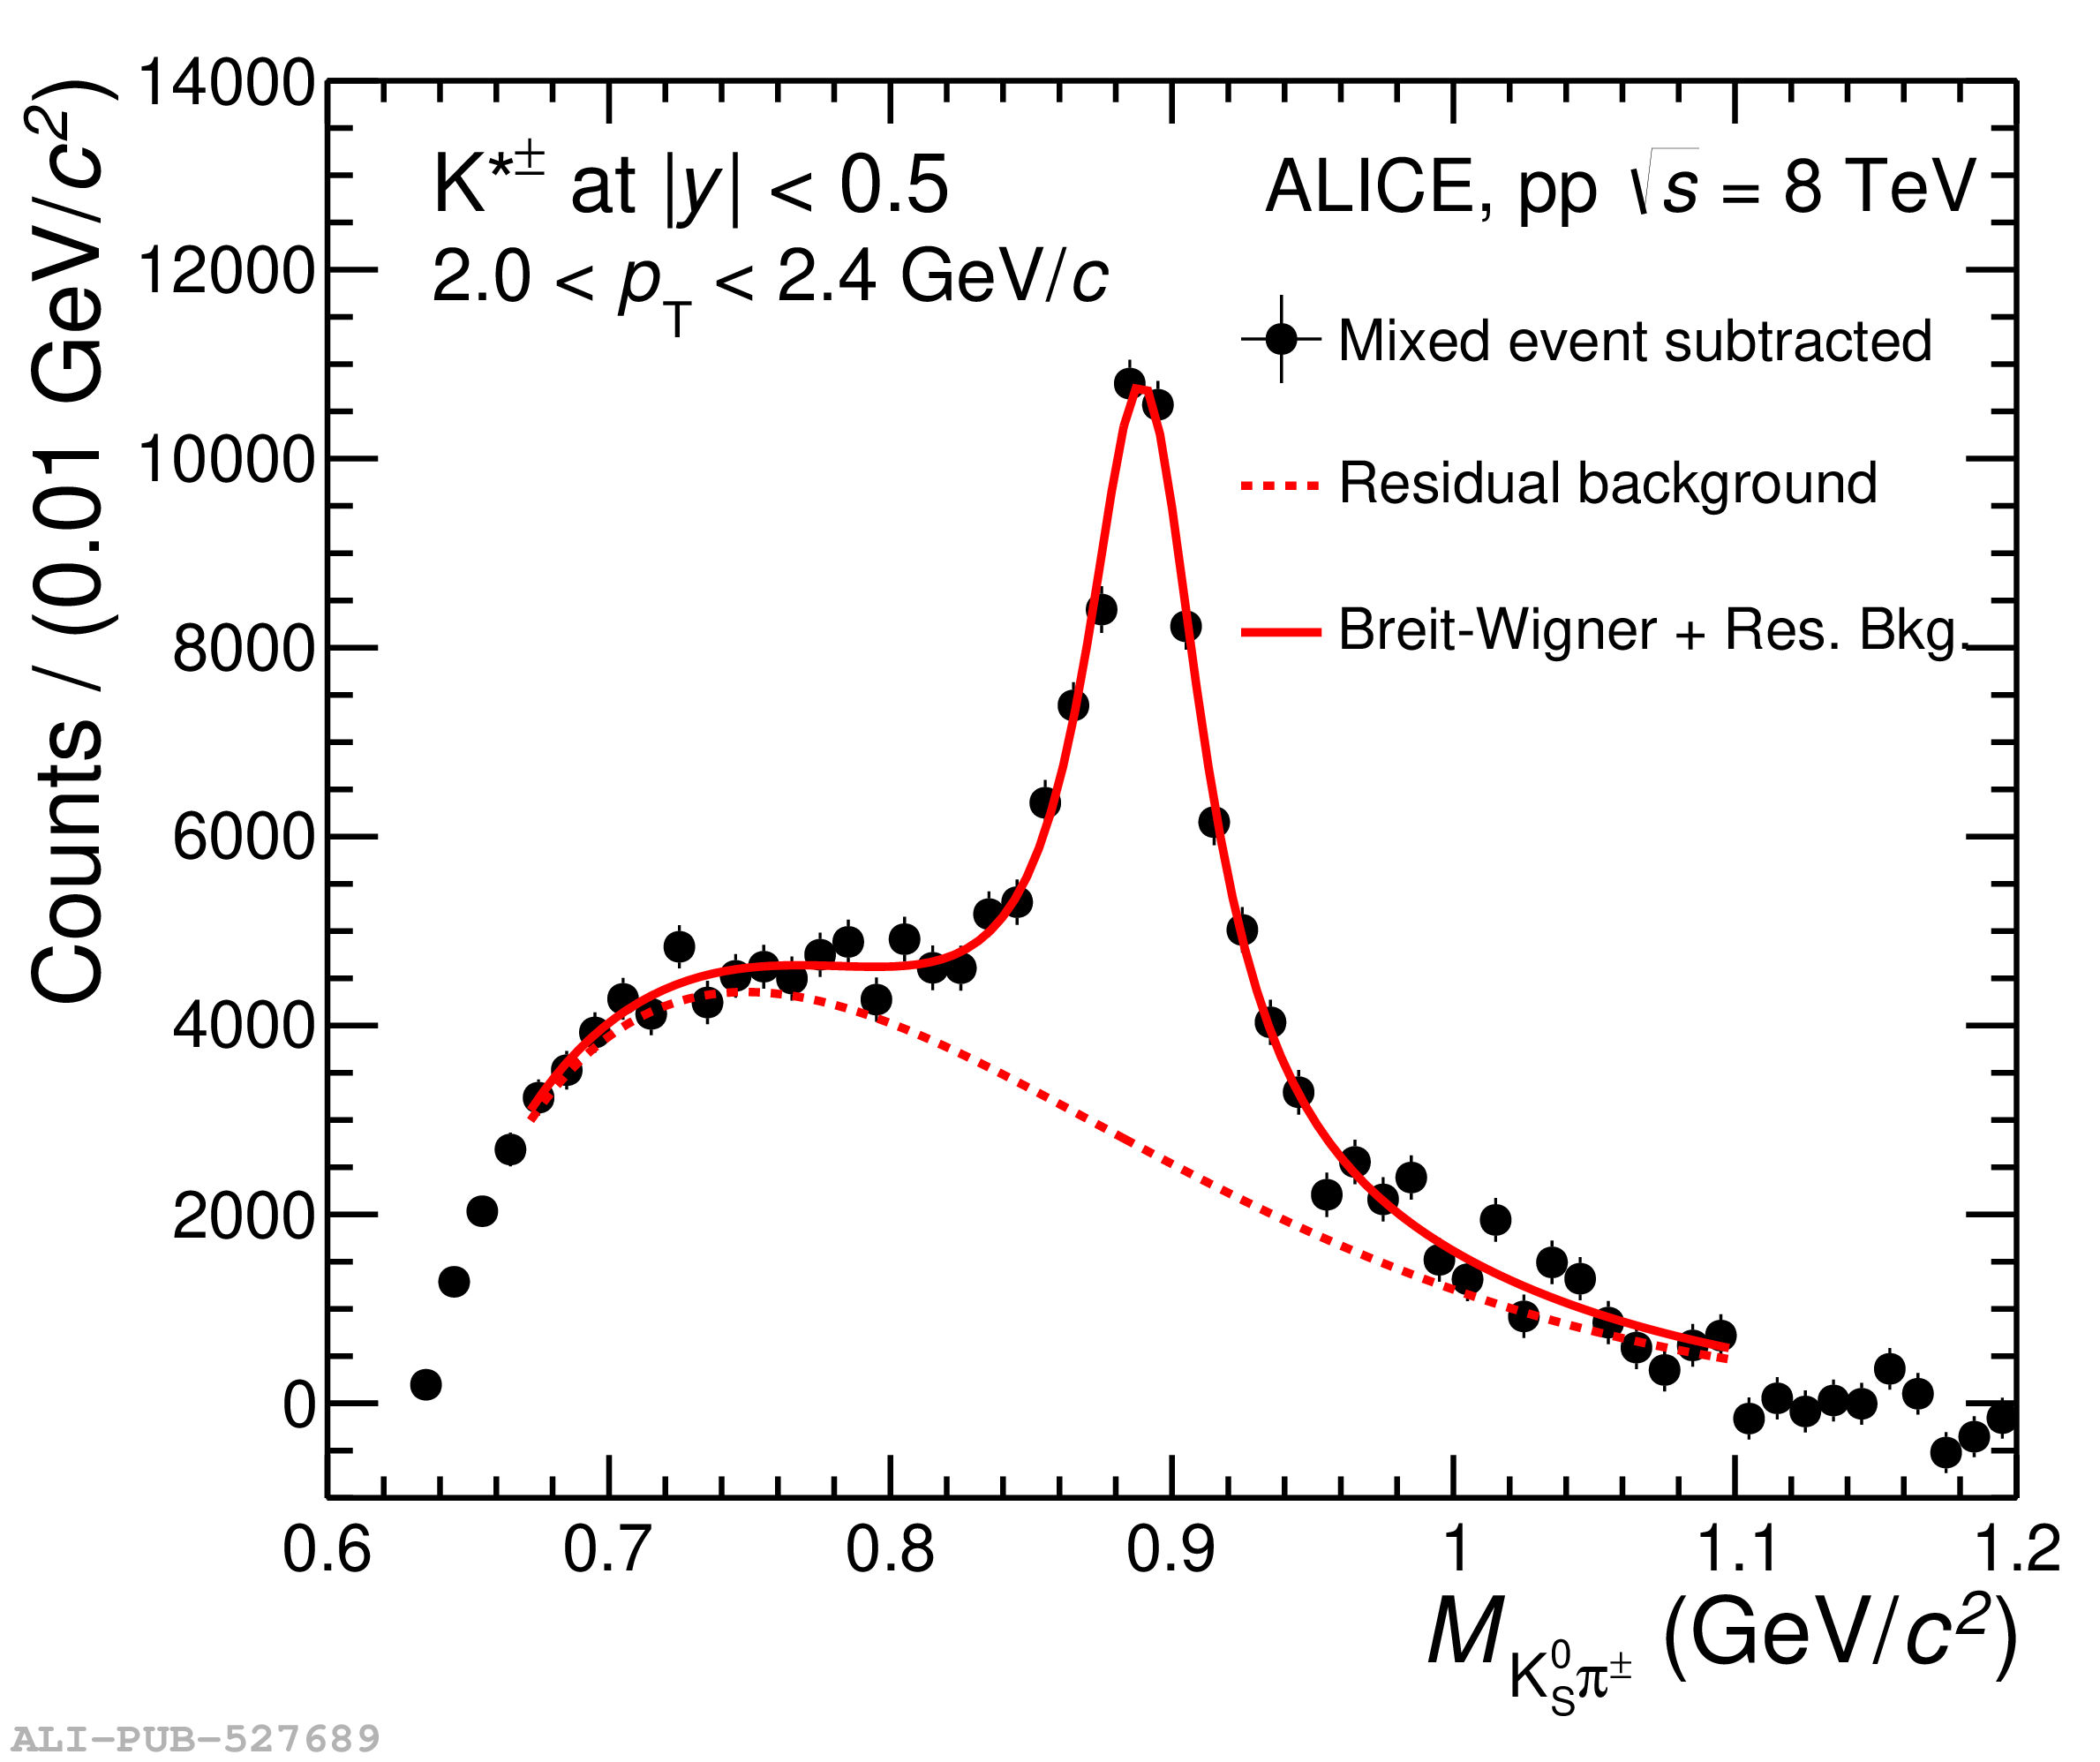  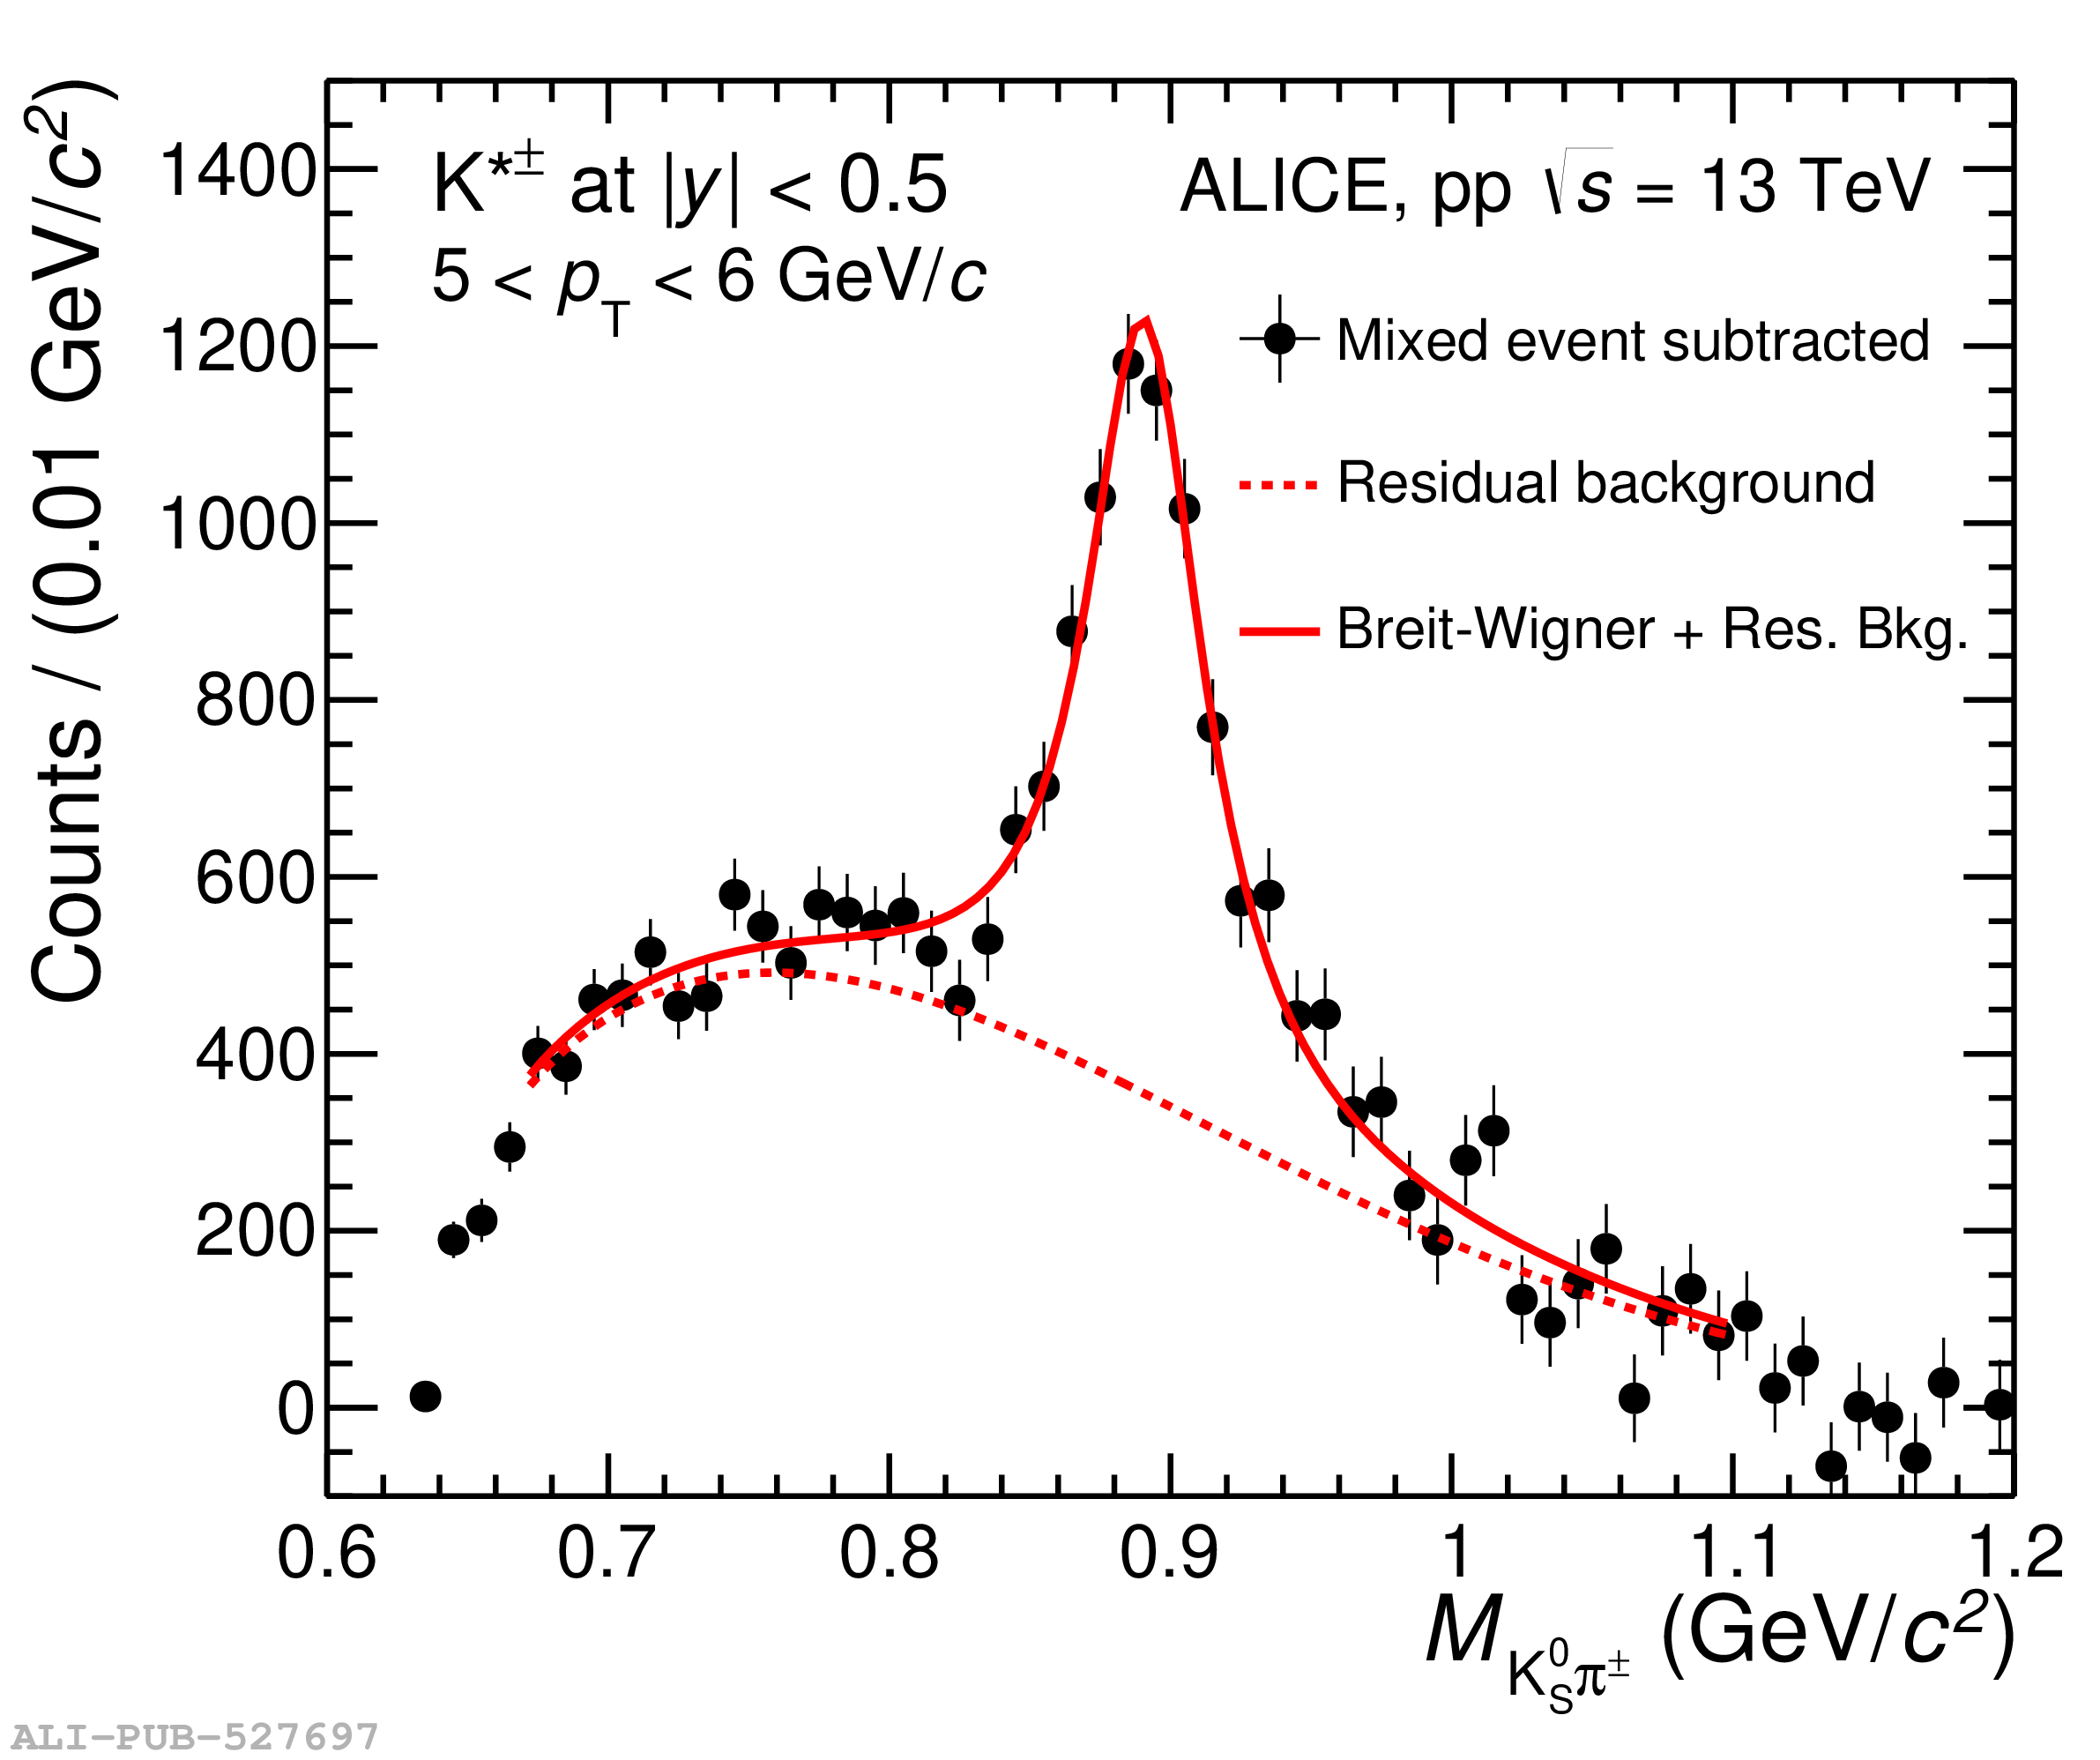 |
Figure 2
Acceptance$\times$Efficiency as a function of \pT for \simplekstarch mesons, detected by their decay to\kshort + \ppm, with \kshort reconstructed by their decay to \pip + \pim. The \kshort $\rightarrow$ \pip + \pim branching ratio is included in the efficiency estimation. Statistical uncertainties are shown with error bars. |  |
Figure 3
The \pT spectra of \simplekstarch in inelastic pp collisions at \sqrtS = 5.02, 8, and 13 TeV (full symbols) are compared to the \pT spectra of \simplekstarZ mesons (open symbols) at the same energies . Statistical and systematic uncertainties are reported as error bars and boxes, respectively. The normalization uncertainties (2.51\%, 2.72\%, and 2.55\% for 5.02, 8, and 13 TeV, respectively, see Tab. \ref{Statistic}) are indicated as coloured boxes and are not included in the point-to-point uncertainties. The ratio of each measured \pT distribution for \simplekstarch mesons at \sqrtS = 5.02 (red points), 8 (blue points) and 13 TeV (black points) to the \simplekstarZ spectrum at the same collision energy is reported in the bottom panels. The systematic uncertainty due to global tracking,material budget and hadronic interaction cross section of primary pions are equal for charged and neutral \rsimplekstar, thus they cancel out in the propagation of the uncertainty to the final ratio. | 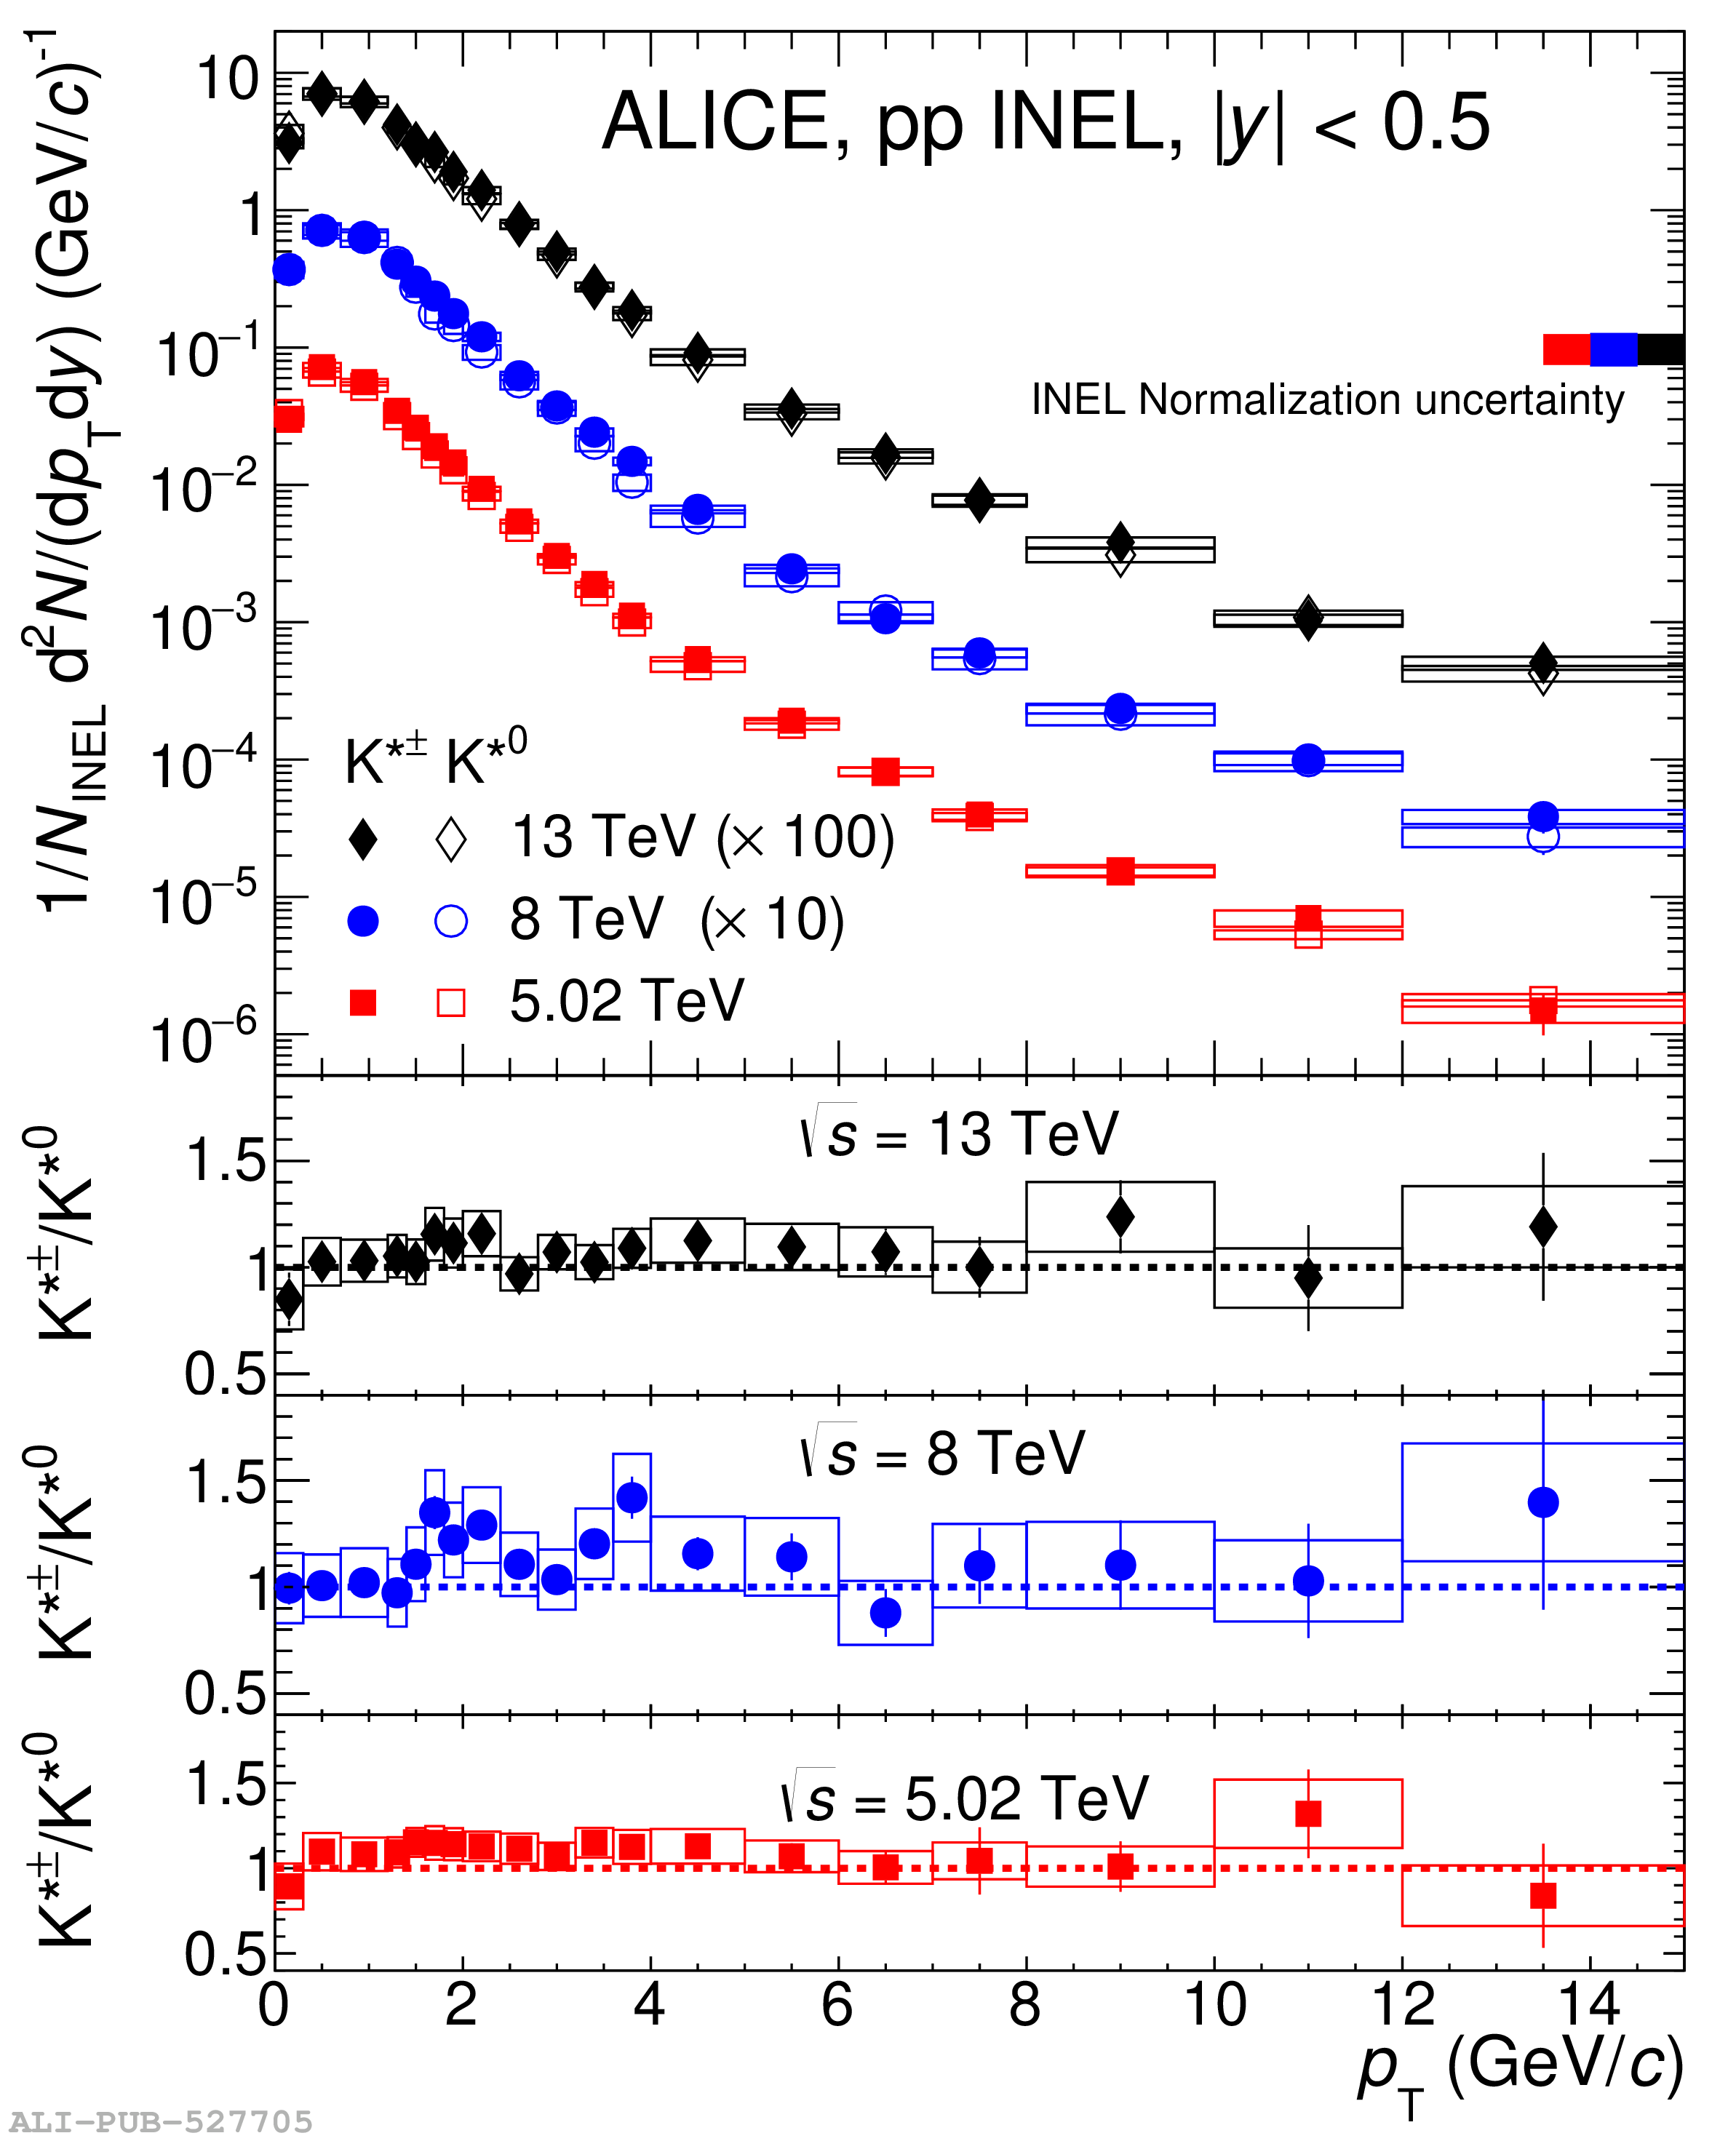 |
Figure 4
The \simplekstarch \pT spectra (black dots) measured in inelastic pp collisions at (a)\sqrtS = 5.02 TeV, (b) 8 TeV, and (c) 13 TeV are compared to the distributions predicted by PYTHIA8-Monash 2013 (blue lines), PYTHIA6-Perugia 2011 (red lines), and EPOS-LHC (black lines). Statistical and systematic uncertainties are shown with error bars and empty boxes, respectively. The ratios of the rebinned predictions to the measured distributions are reported in the bottom panels. The shaded bands represent the fractional uncertainties of the data points. |  |
Figure 5
(Left panel) Ratios of transverse momentum spectra of \simplekstarch in inelastic pp events at \sqrtS = 8 and 13 TeV to corresponding spectra at 5.02 TeV. Statistical and systematic uncertainties are shown with error bars and empty boxes, respectively. The normalization uncertainties are shown as coloured boxes around 1 and they are not included in the point-to-point uncertainties. Blue and red histograms represent the predictions for the same ratios from PYTHIA6 Perugia 2011, PYTHIA8 Monash 2013, and EPOS-LHC (Right panel) Ratios of transverse momentum spectra of \simplekstarch, $\Kp +\Km$ and $\pionp + \pionm$ in inelastic pp events at \sqrtS = 13 TeV to corresponding spectra at 5.02 TeV . Statistical and systematic uncertainties are shown with error bars and empty boxes, respectively. |  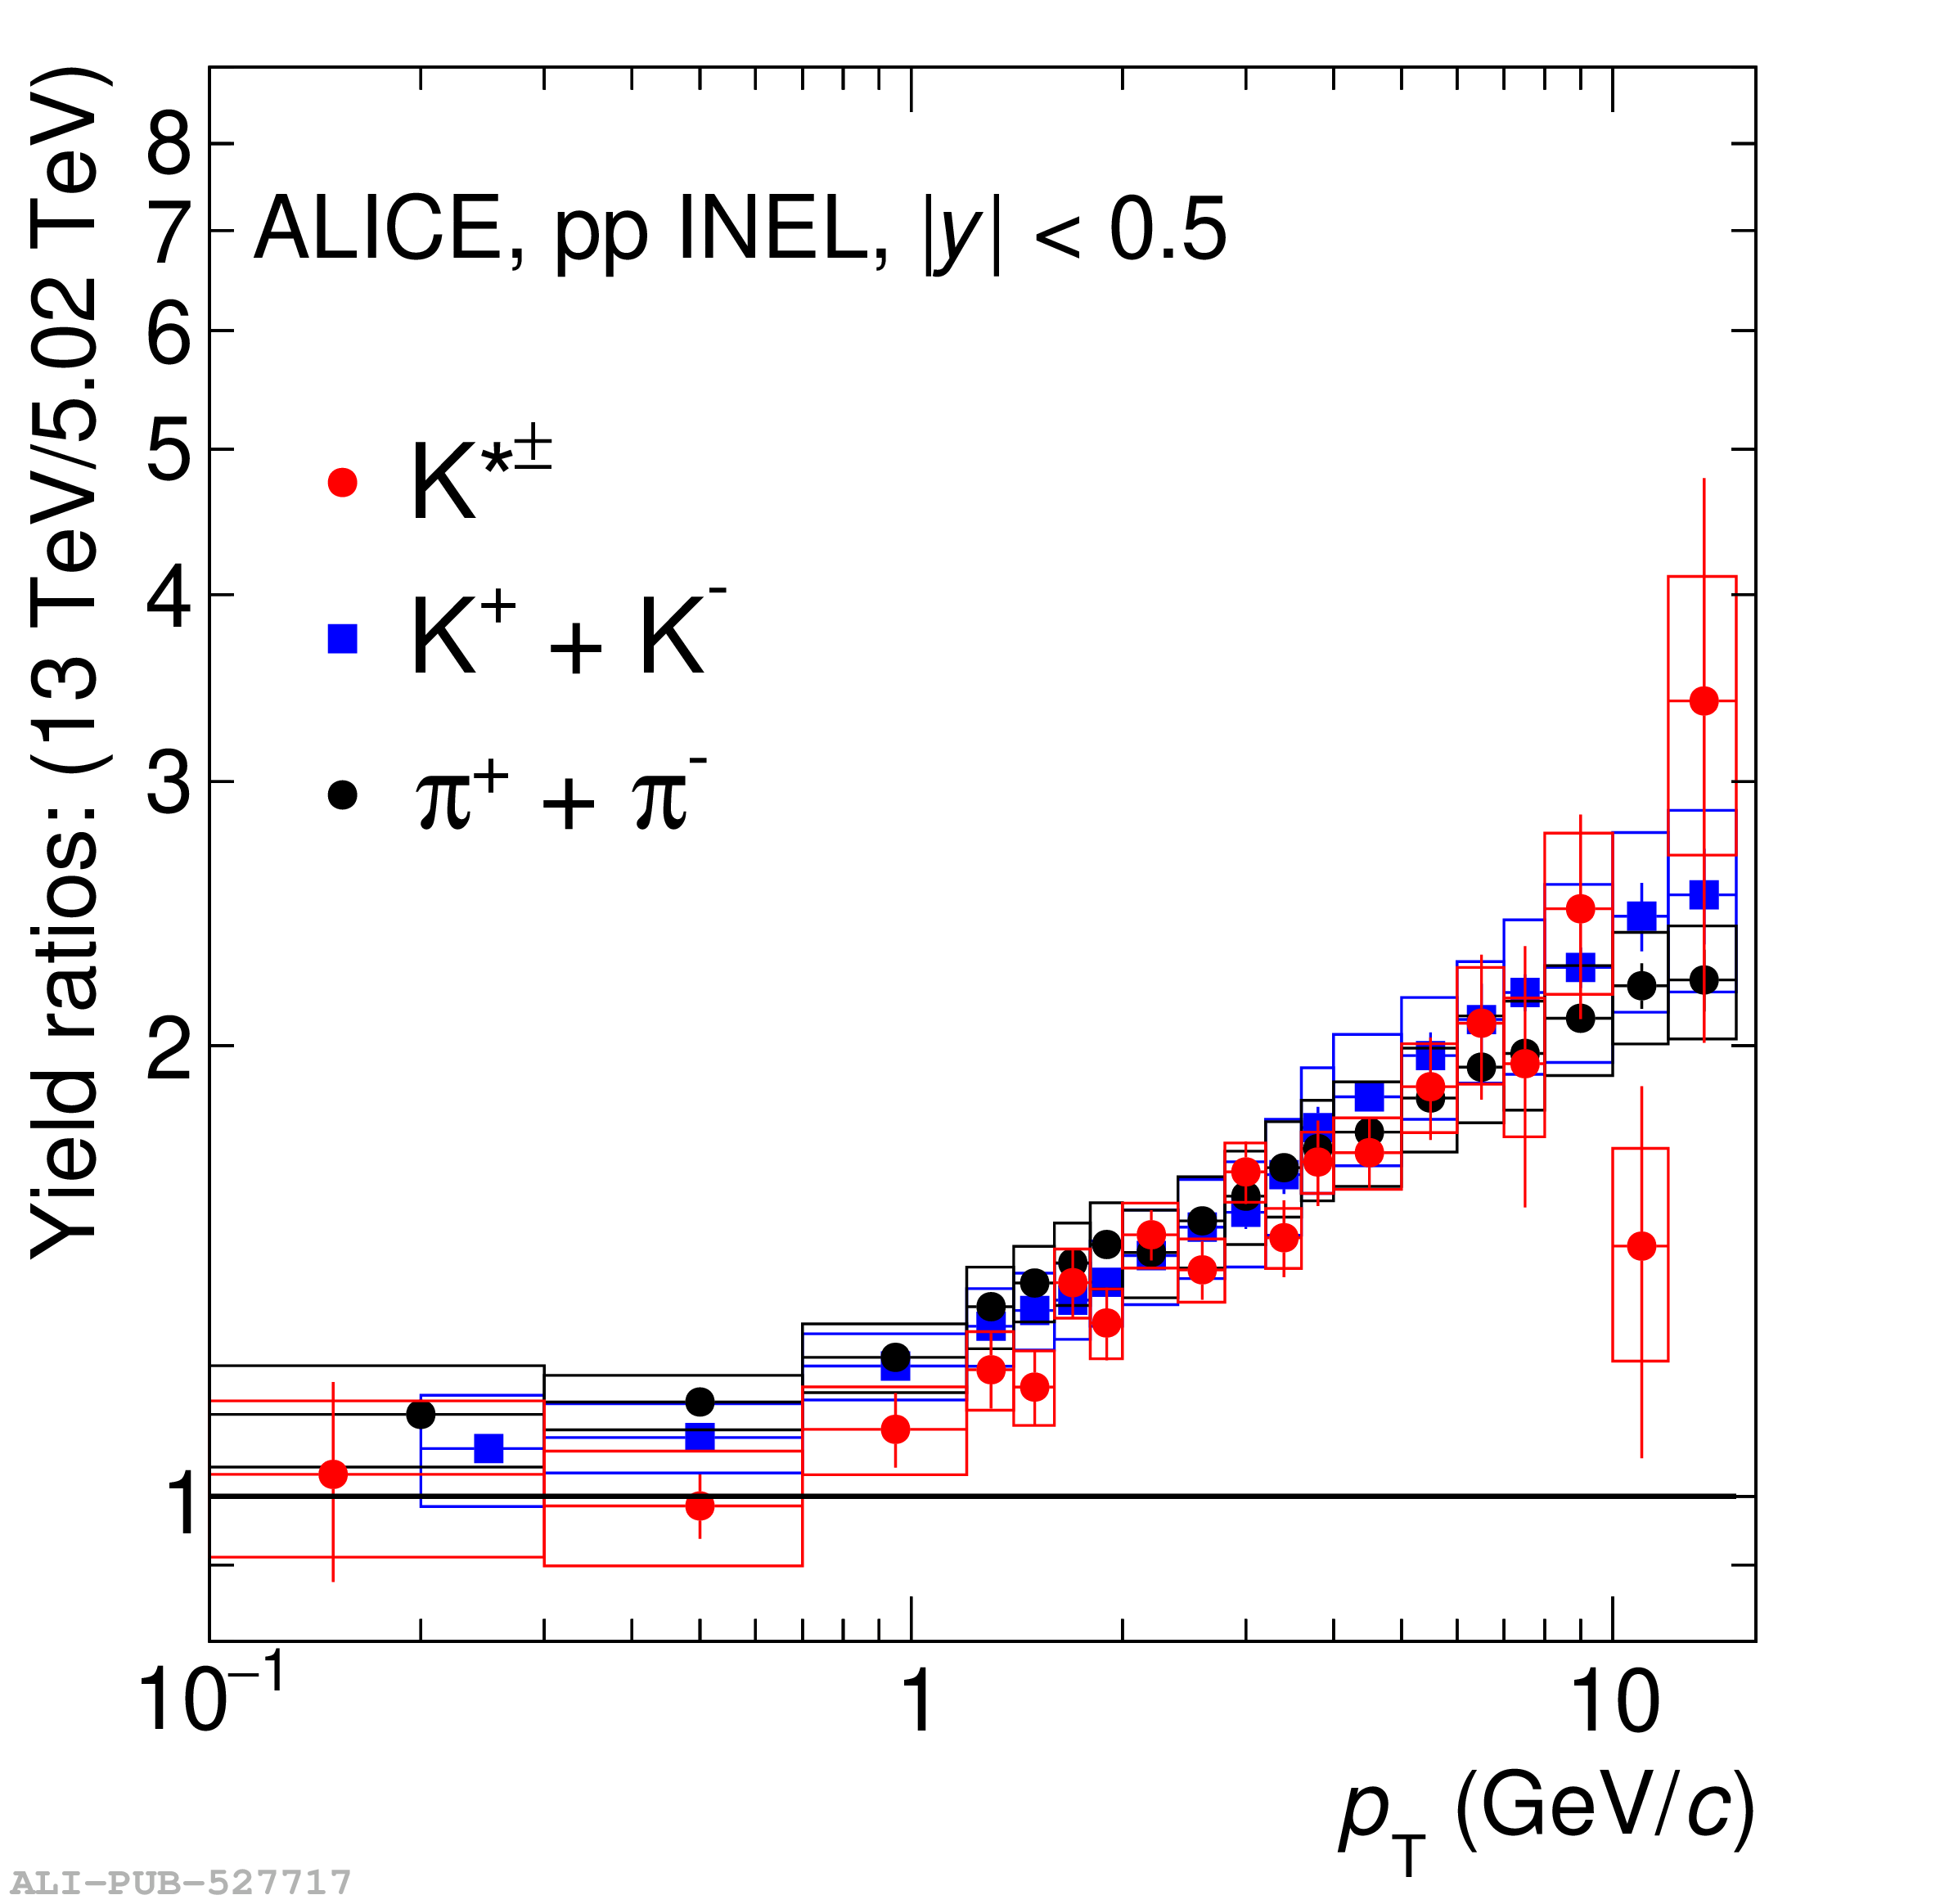 |
Figure 6
Particle ratios \simplekstarch/K and \simplekstarZ/K, depicted as \rsimplekstar/K, in pp , central \mbox{d--Au} , central \mbox{p--Pb} and central \mbox{A--A} collisions as a function of \sqrtSnn. For the \mbox{d--Au} data, the numerator yield is derived from a combination of \simplekstarZ and \simplekstarch states. Bars represent the statistical uncertainties and boxes represent the systematic uncertainties. The points for \simplekstarZ for \mbox{d--Au},\mbox{Cu--Cu} and \mbox{p--Pb} collisions and for \simplekstarch for pp collisions have been shifted horizontally for visibility. Red, blue and black lines represent the \simplekstarch/K ratio predicted with PYTHIA6-Perugia 2011 , PYTHIA8-Monash 2013 and EPOS-LHC , respectively. | 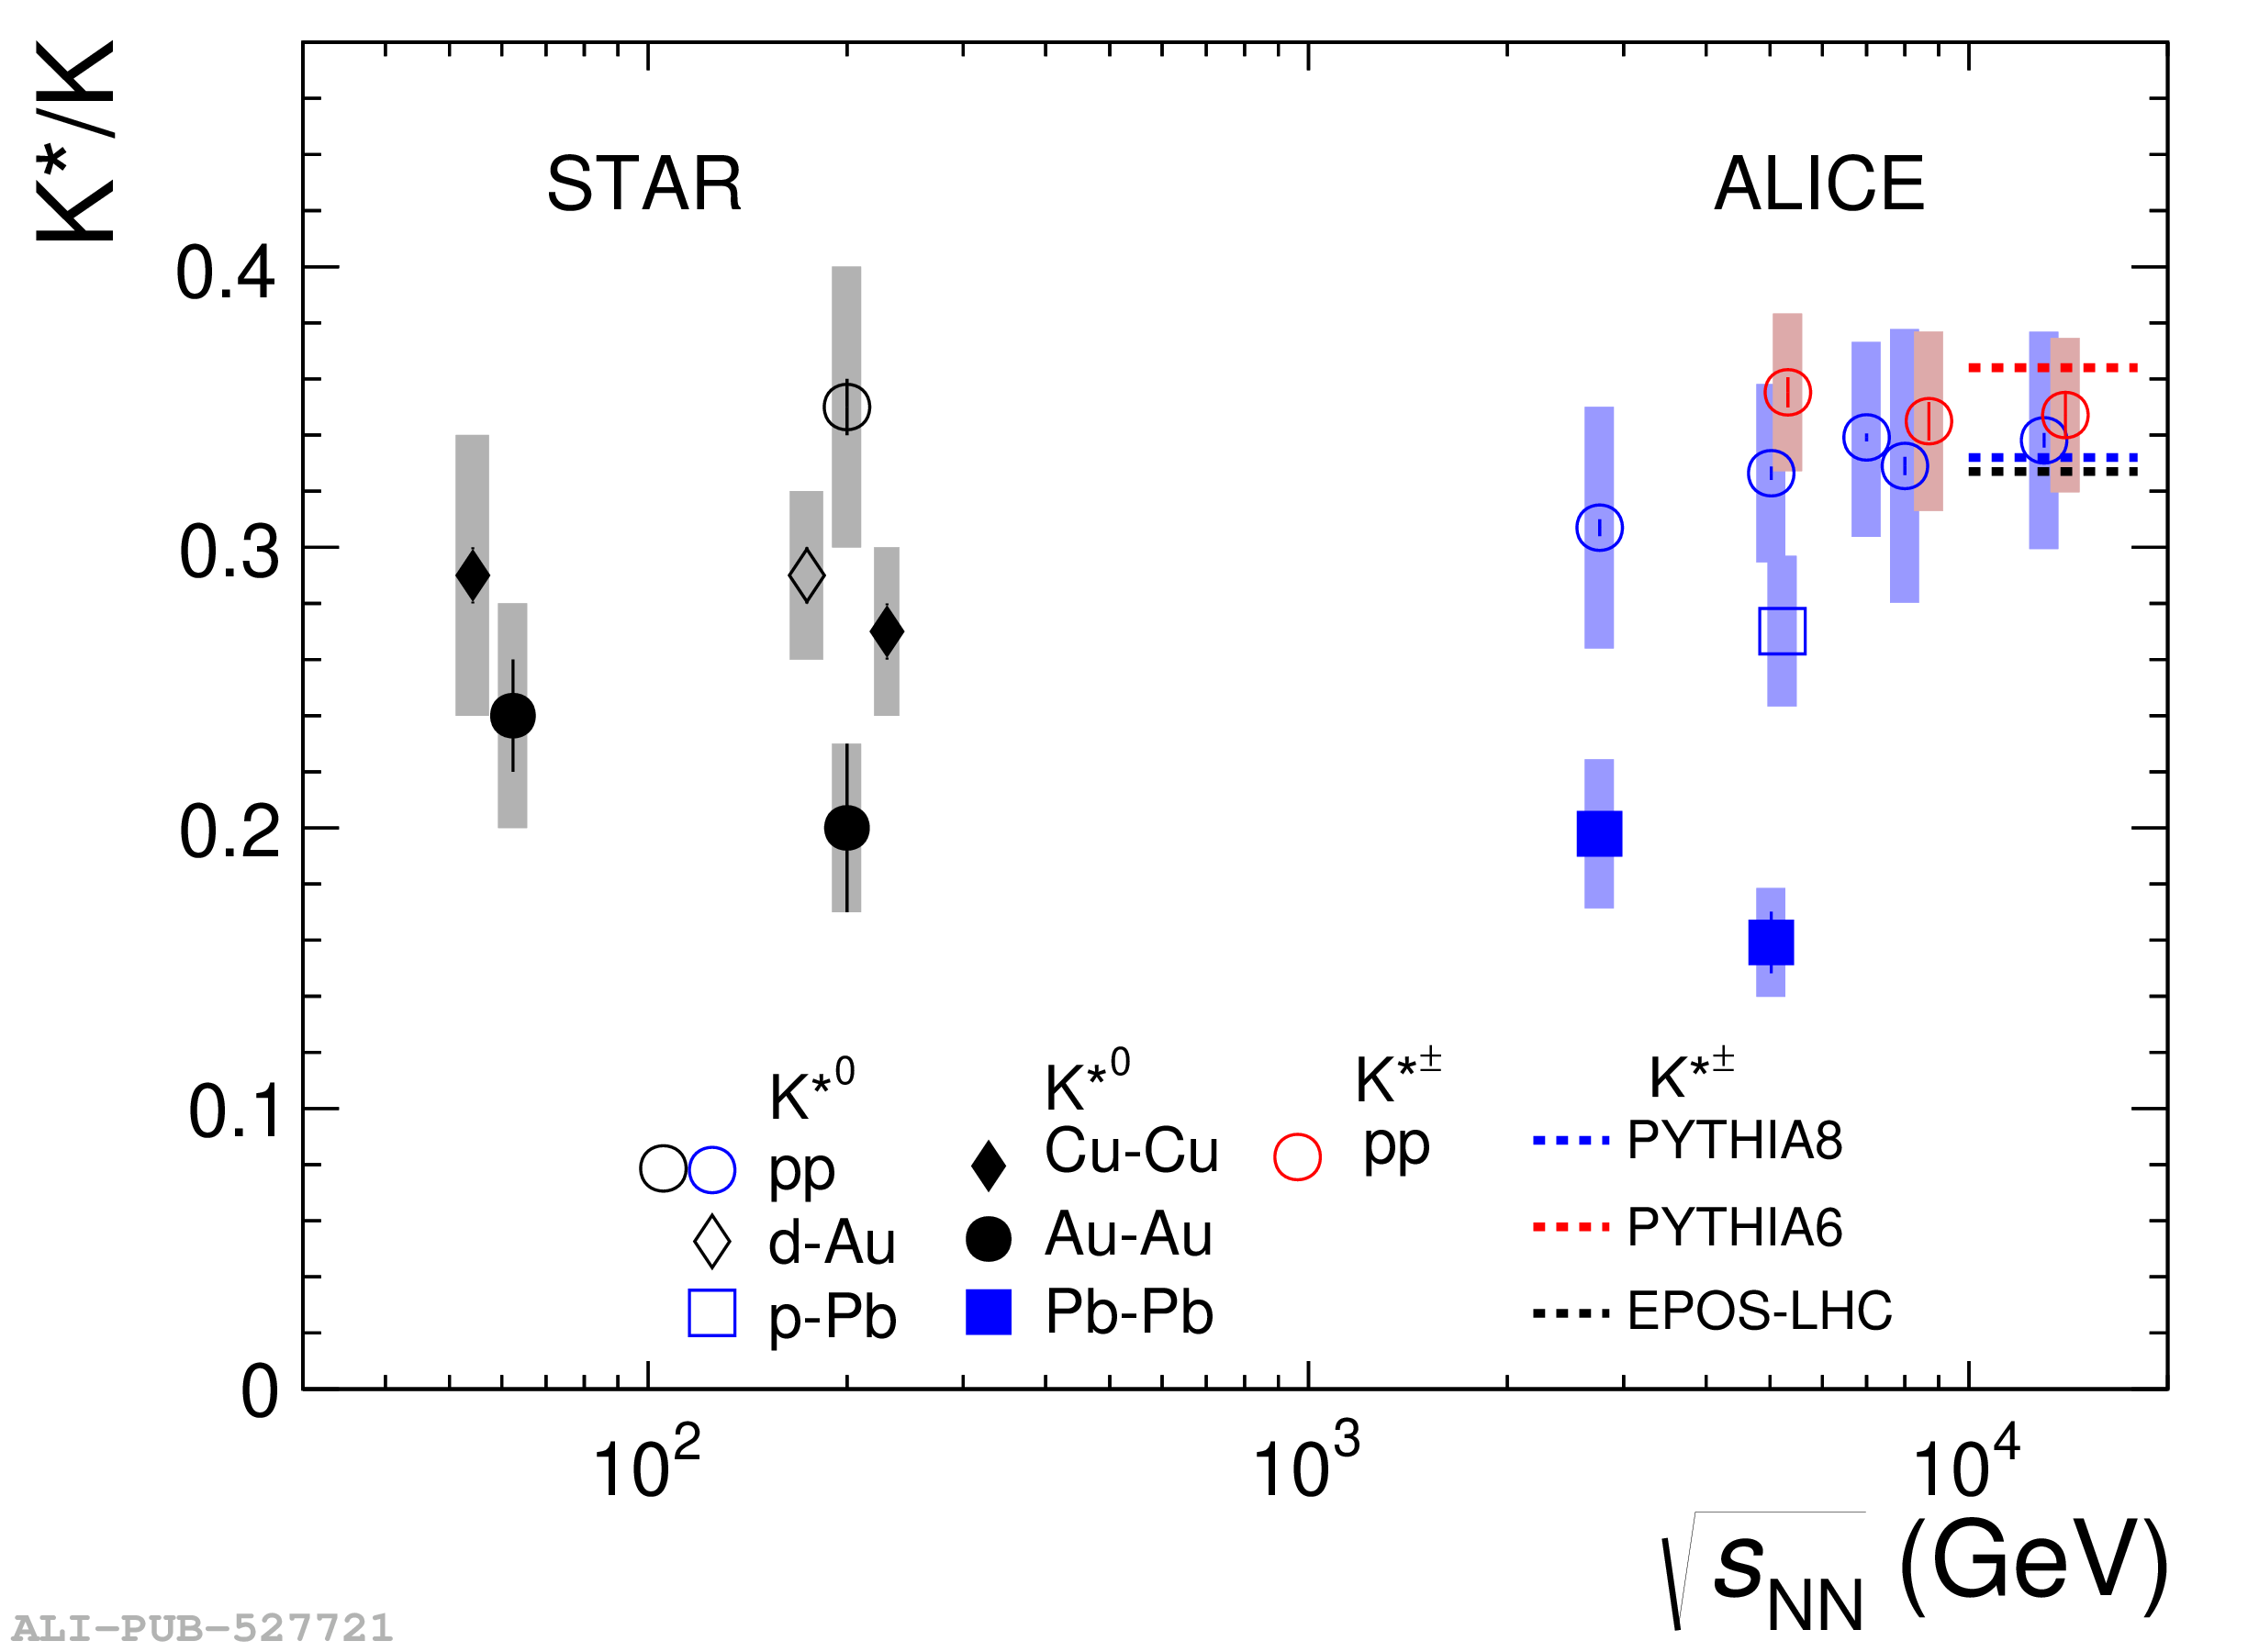 |
Figure 7
(Upper panel) The \pT spectra of \simplekstarch in inelastic pp collisions at \sqrtS = 5.02 and 13 TeV (full symbols) are compared to the \pT spectra of \Kpm mesons (open symbols) at the same energies . Statistical and systematic uncertainties are reported as error bars and boxes, respectively. Red, blue and black lines represent the \K spectra predicted with PYTHIA6-Perugia 2011 , PYTHIA8-Monash 2013 and EPOS-LHC , respectively. (Middle panels) The ratios of the rebinned predictions to the measured \pT distributions for \Kpm are reported in the two middle panels. The shaded bands represent the fractional uncertainties of the data points. (Bottom panels) The ratio of each measured \pT distribution for \simplekstarch mesons at \sqrtS = 5.02 (red points) and 13 TeV (black points) to the \K spectrum at the same collision energy is reported in the bottom panels. Red, blue and black lines represent the \simplekstarch/K ratio predicted with PYTHIA6-Perugia 2011 , PYTHIA8-Monash 2013 and EPOS-LHC , respectively. | 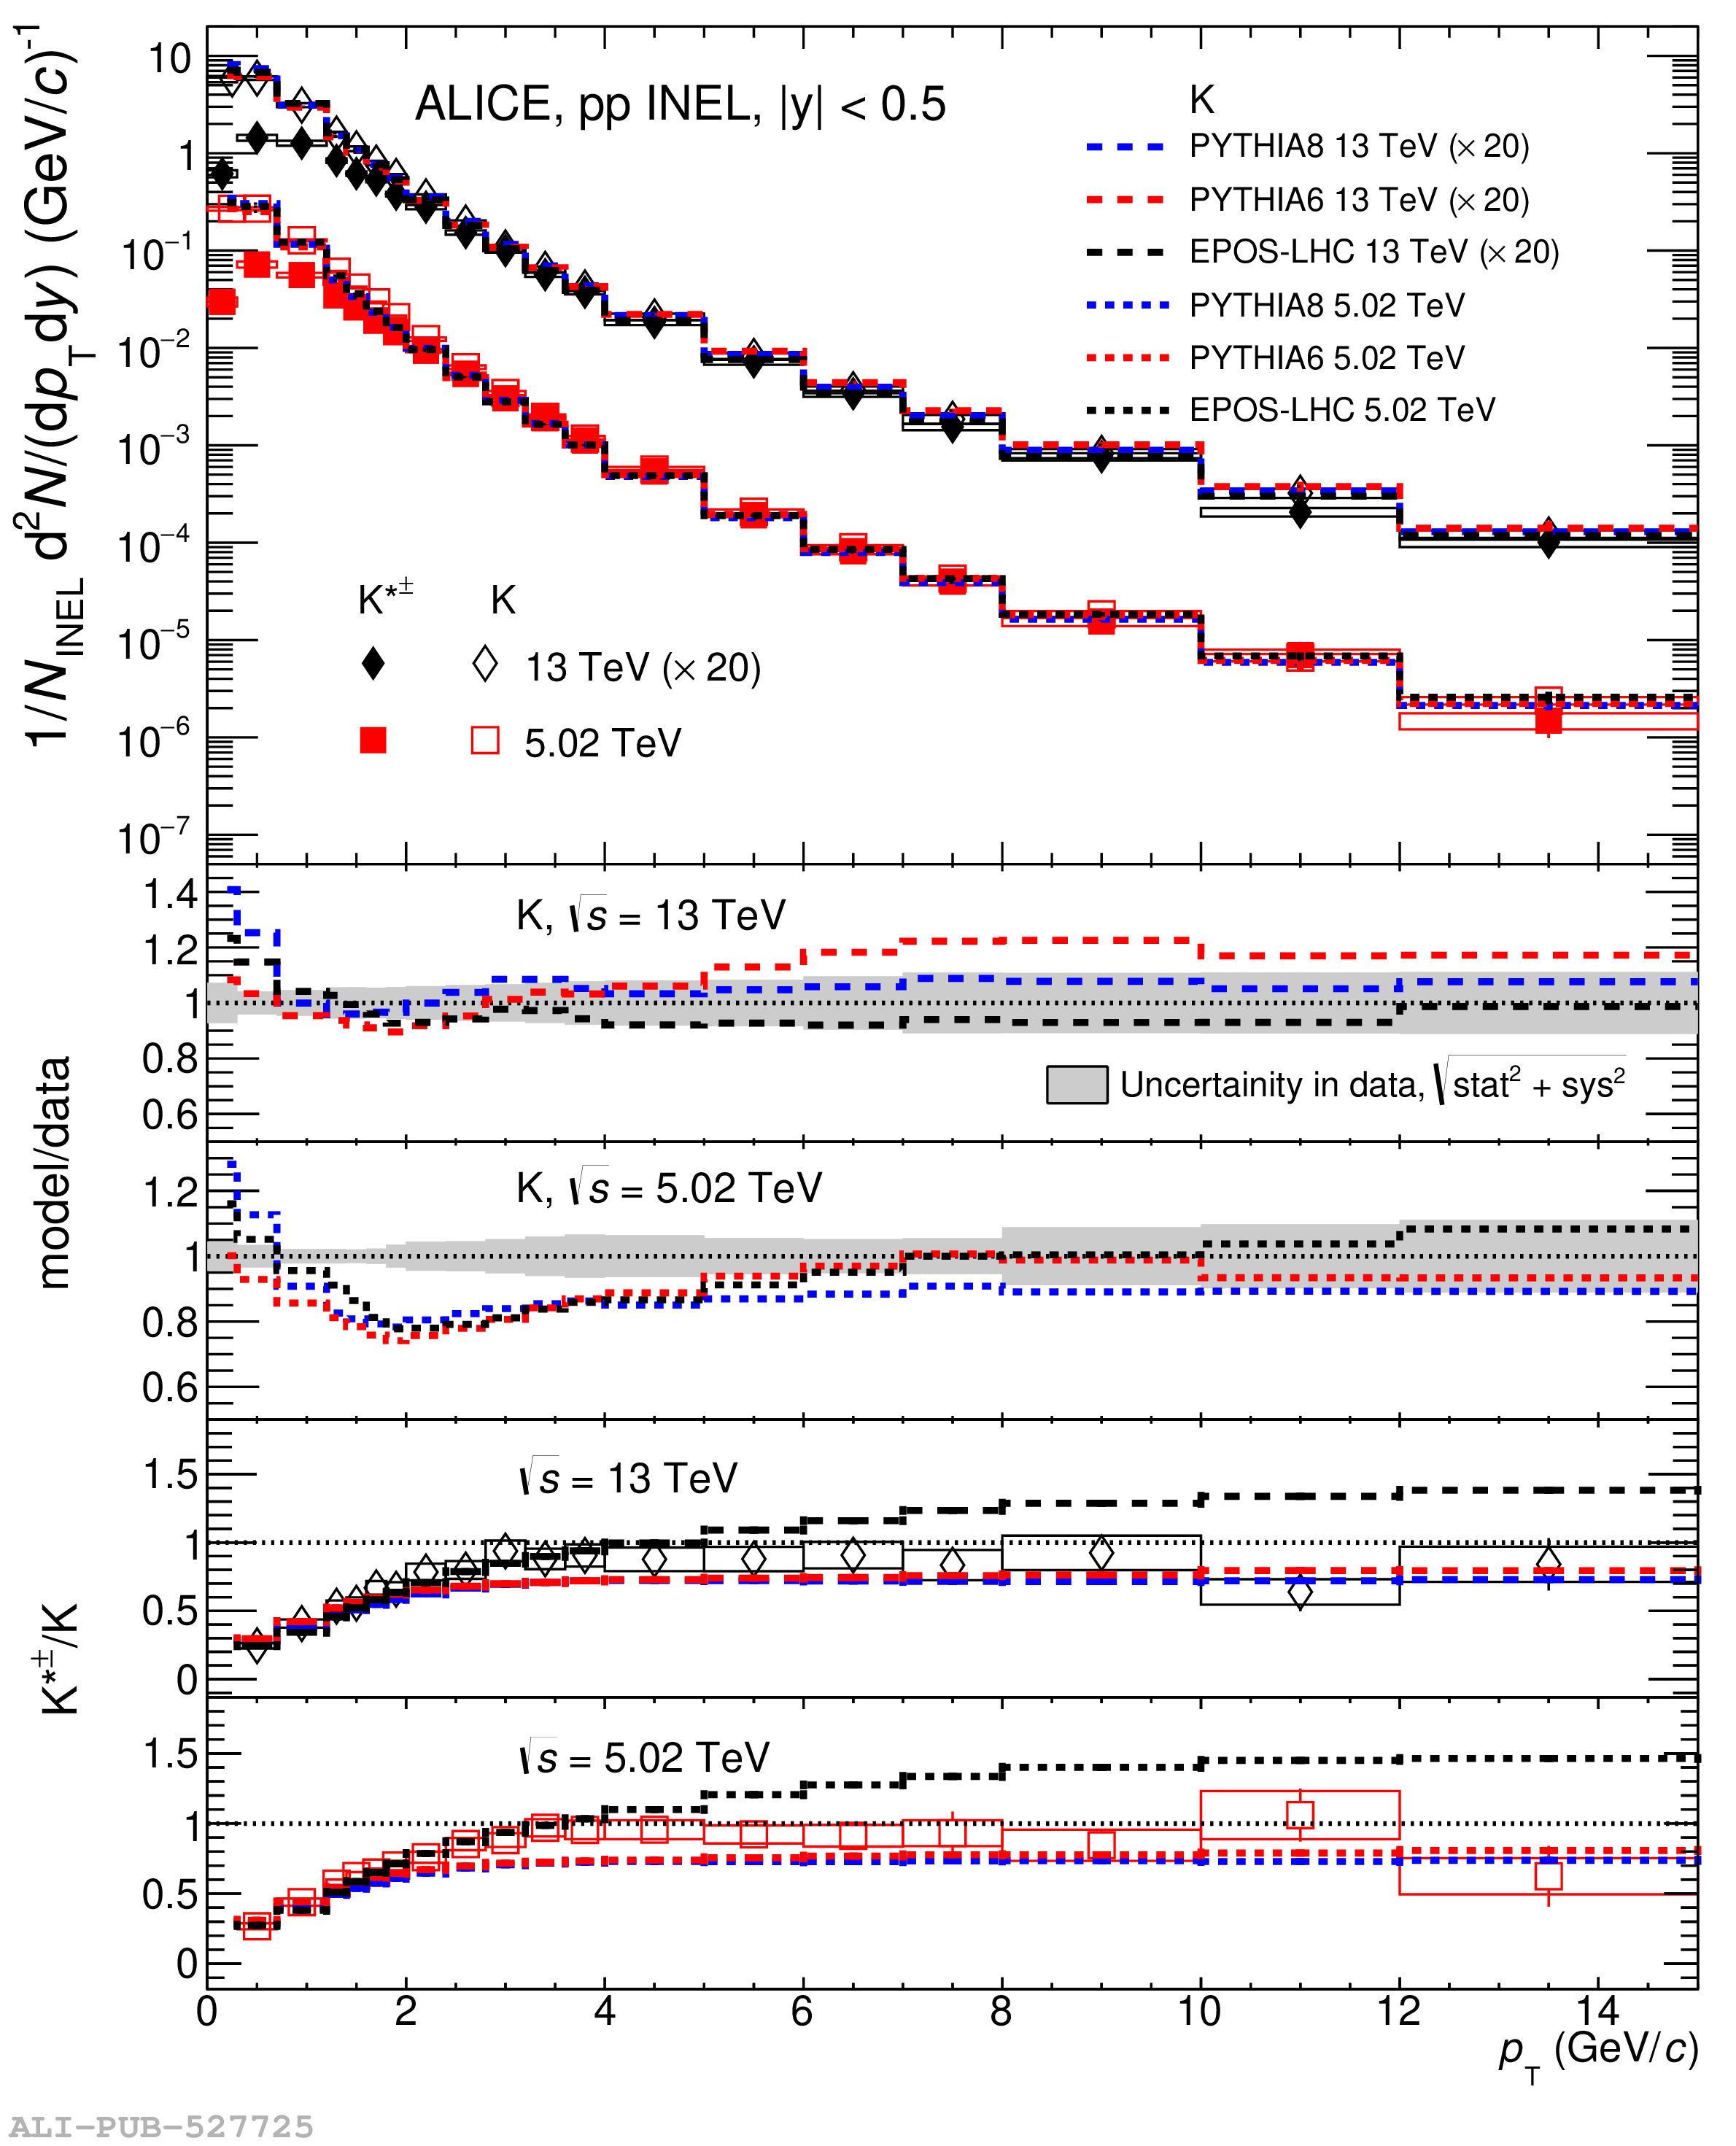 |