A measurement of inclusive, prompt, and non-prompt ${\rm J}/\psi$ production in p$-$Pb collisions at a nucleon$-$nucleon centre-of-mass energy $\sqrt{s_{\mathrm{NN}}} = 5.02$ TeV is presented. The inclusive ${\rm J}/\psi$ mesons are reconstructed in the dielectron decay channel at midrapidity down to a transverse momentum $p_{\rm T} = 0$. The inclusive ${\rm J}/\psi$ nuclear modification factor $R_{\rm pPb}$ is calculated by comparing the new results in p$-$Pb collisions to a recently measured proton$-$proton reference at the same centre-of-mass energy. Non-prompt ${\rm J}/\psi$ mesons, which originate from the decay of beauty hadrons, are separated from promptly produced ${\rm J}/\psi$ on a statistical basis for $p_{\rm T}$ larger than 1.0 GeV/$c$. These results are based on the data sample collected by the ALICE detector during the 2016 LHC p$-$Pb run, corresponding to an integrated luminosity ${\cal L}_{\rm int} = 292 \pm 11 \; {\rm \mu b}^{-1}$, which is six times larger than the previous publications. The total uncertainty on the $p_{\rm T}$-integrated inclusive ${\rm J}/\psi$ and non-prompt ${\rm J}/\psi$ cross section are reduced by a factor 1.7 and 2.2, respectively. The measured cross sections and $R_{\rm pPb}$ are compared with theoretical models that include various combinations of cold nuclear matter effects. From the non-prompt ${\rm J}/\psi$ production cross section, the ${\rm b\overline{b}}$ production cross section at midrapidity, $\mathrm{d}\sigma_{\rm b\overline{b}}/\mathrm{d}y$, and the total cross section extrapolated over full phase space, $\sigma_{\rm b\overline{b}}$, are derived.
JHEP06 (2022) 011
HEP Data
e-Print: arXiv:2105.04957 | PDF | inSPIRE
CERN-EP-2021-077
Figure group
Figure 1
Opposite-sign dielectron invariant mass distributions for the \pt-intervals used for this analysis. The signal plus total background (blue), the combinatorial background (red), and the correlated background (green), evaluated as described in the text, are shown separately in each panel The $\chi^2/{\rm ndf}$ values of the signal template plus the total background function are also reported along with the raw yields in the range $2.92 < m_{\rm e^+e^-} < 3.16$ GeV/$c^2$. |  |
Figure 2
Invariant mass (left panel) and pseudoproper decay length (right panel) distributions for \PJpsi candidates with $\pt > 1$ GeV/$c$. The latter distribution is limited to the \PJpsi candidates under the signal peak region $2.92 < m_{\rm e^+e^-} < 3.16$ GeV/$c^2$. The projections of the maximum likelihood fit functions are shown superimposed and the $\chi^2$ values of these projections are also reported for both distributions. | 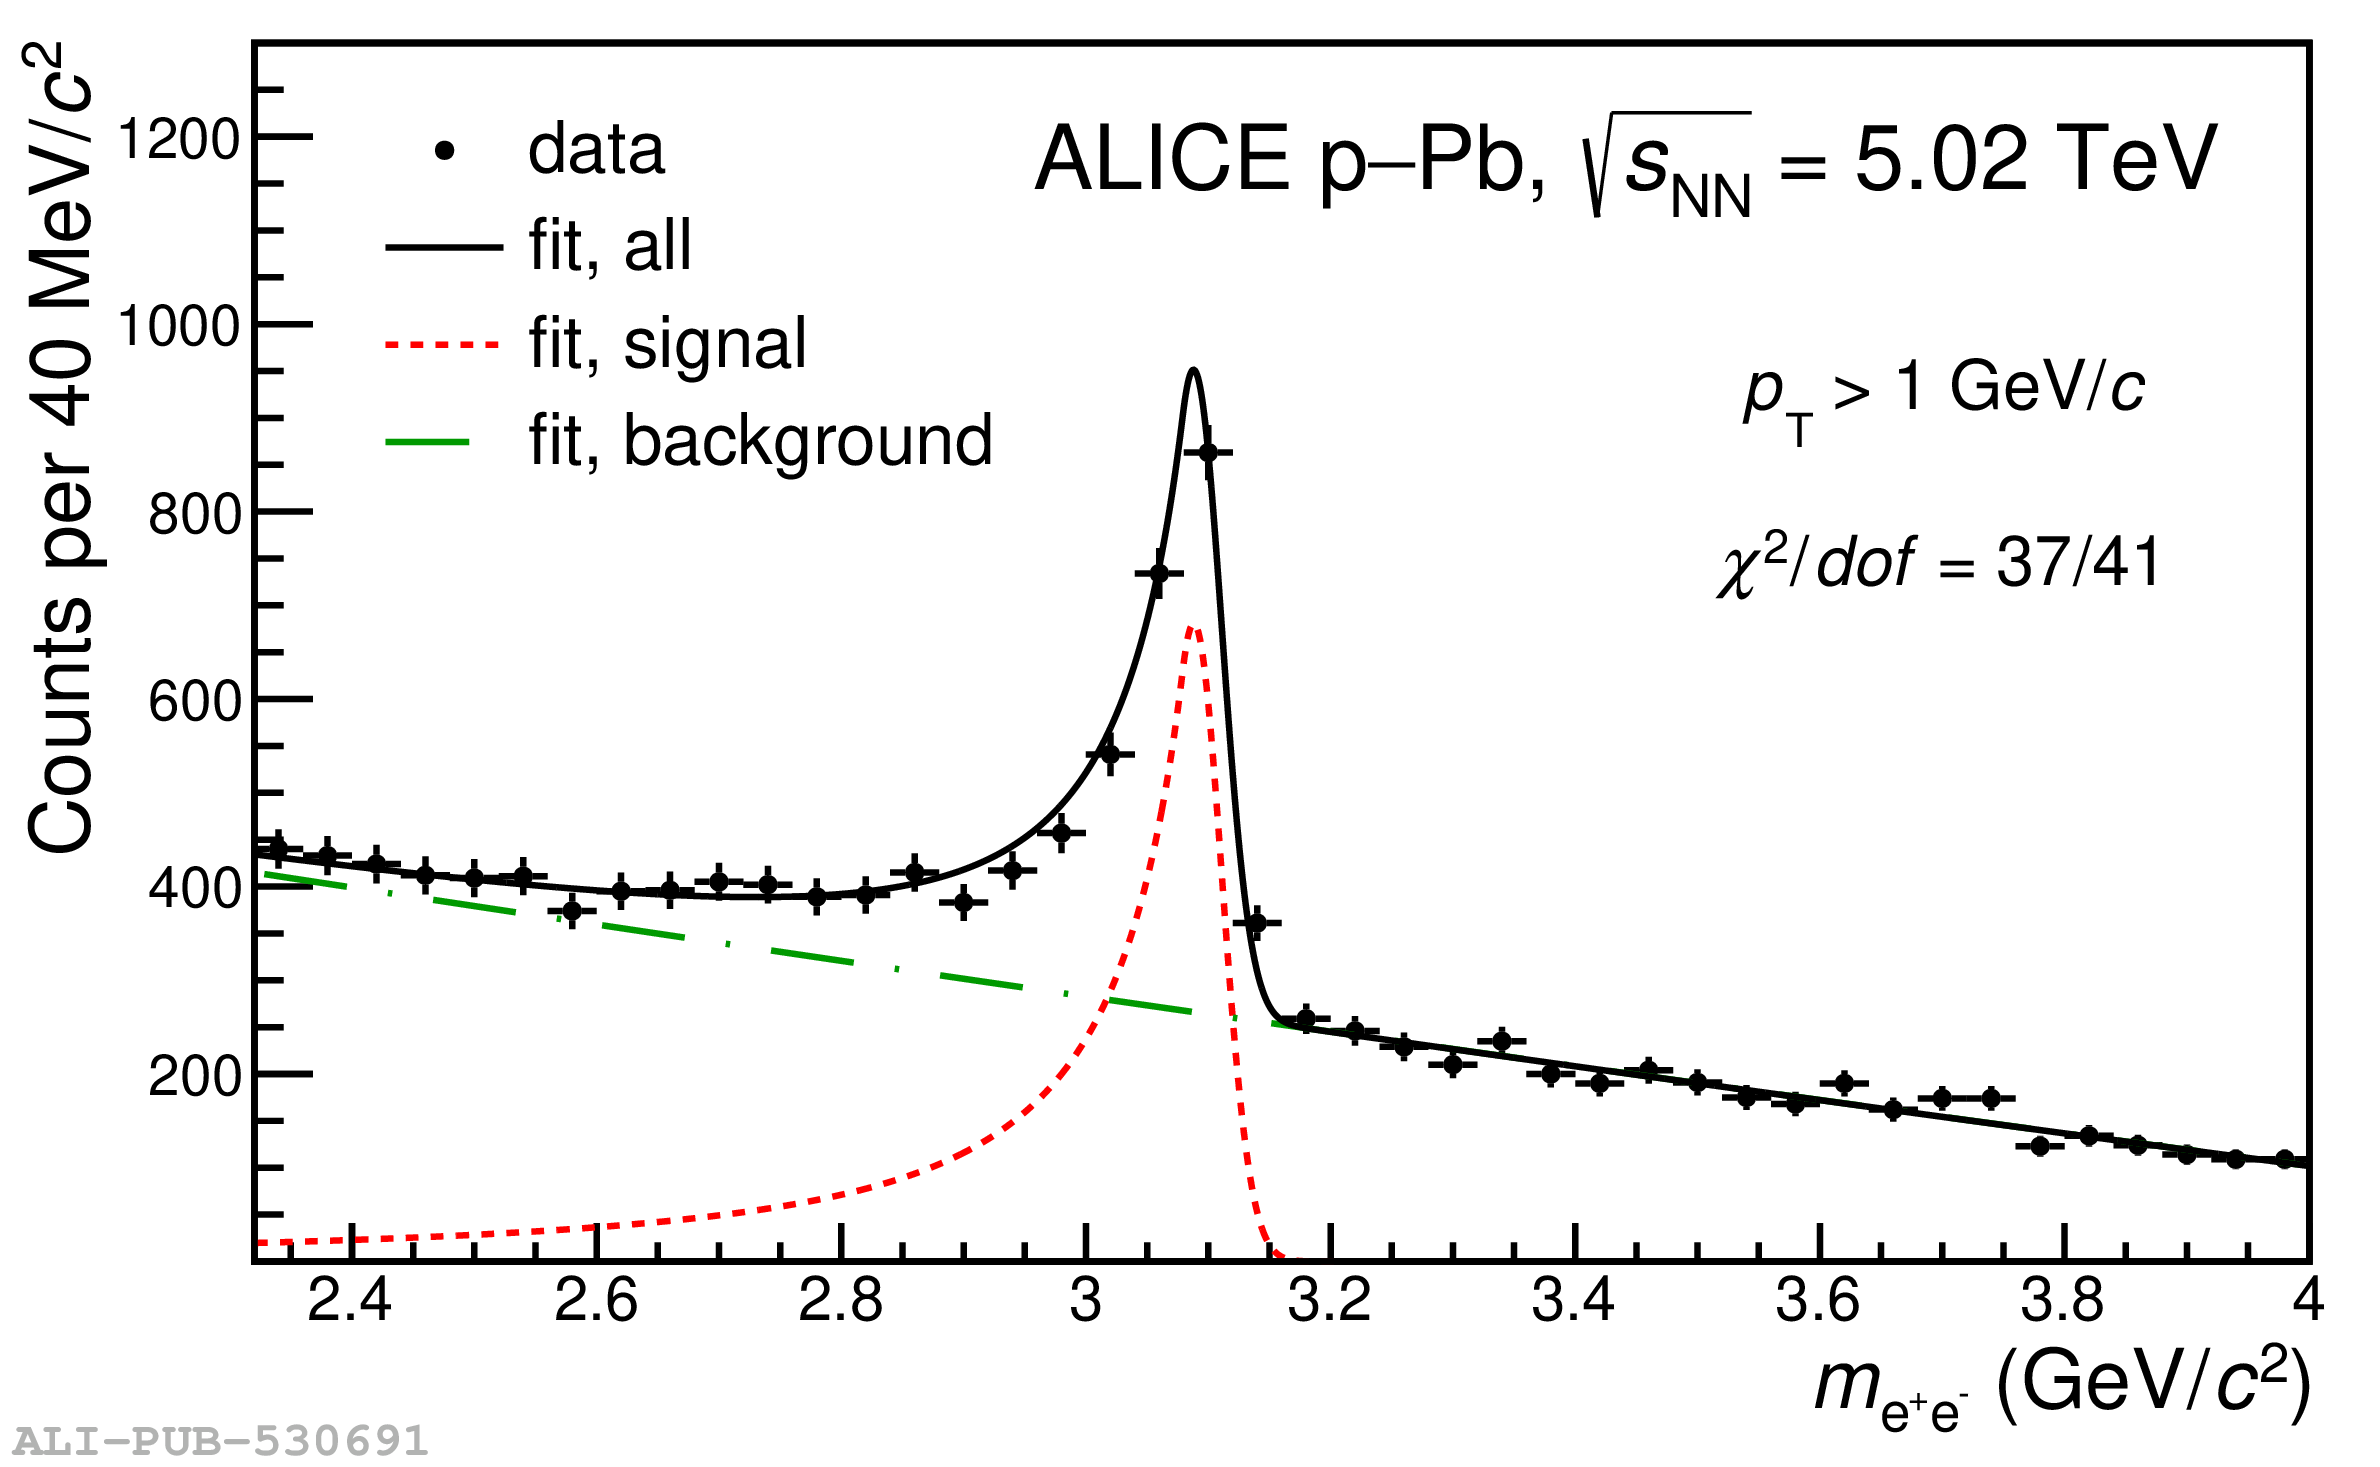 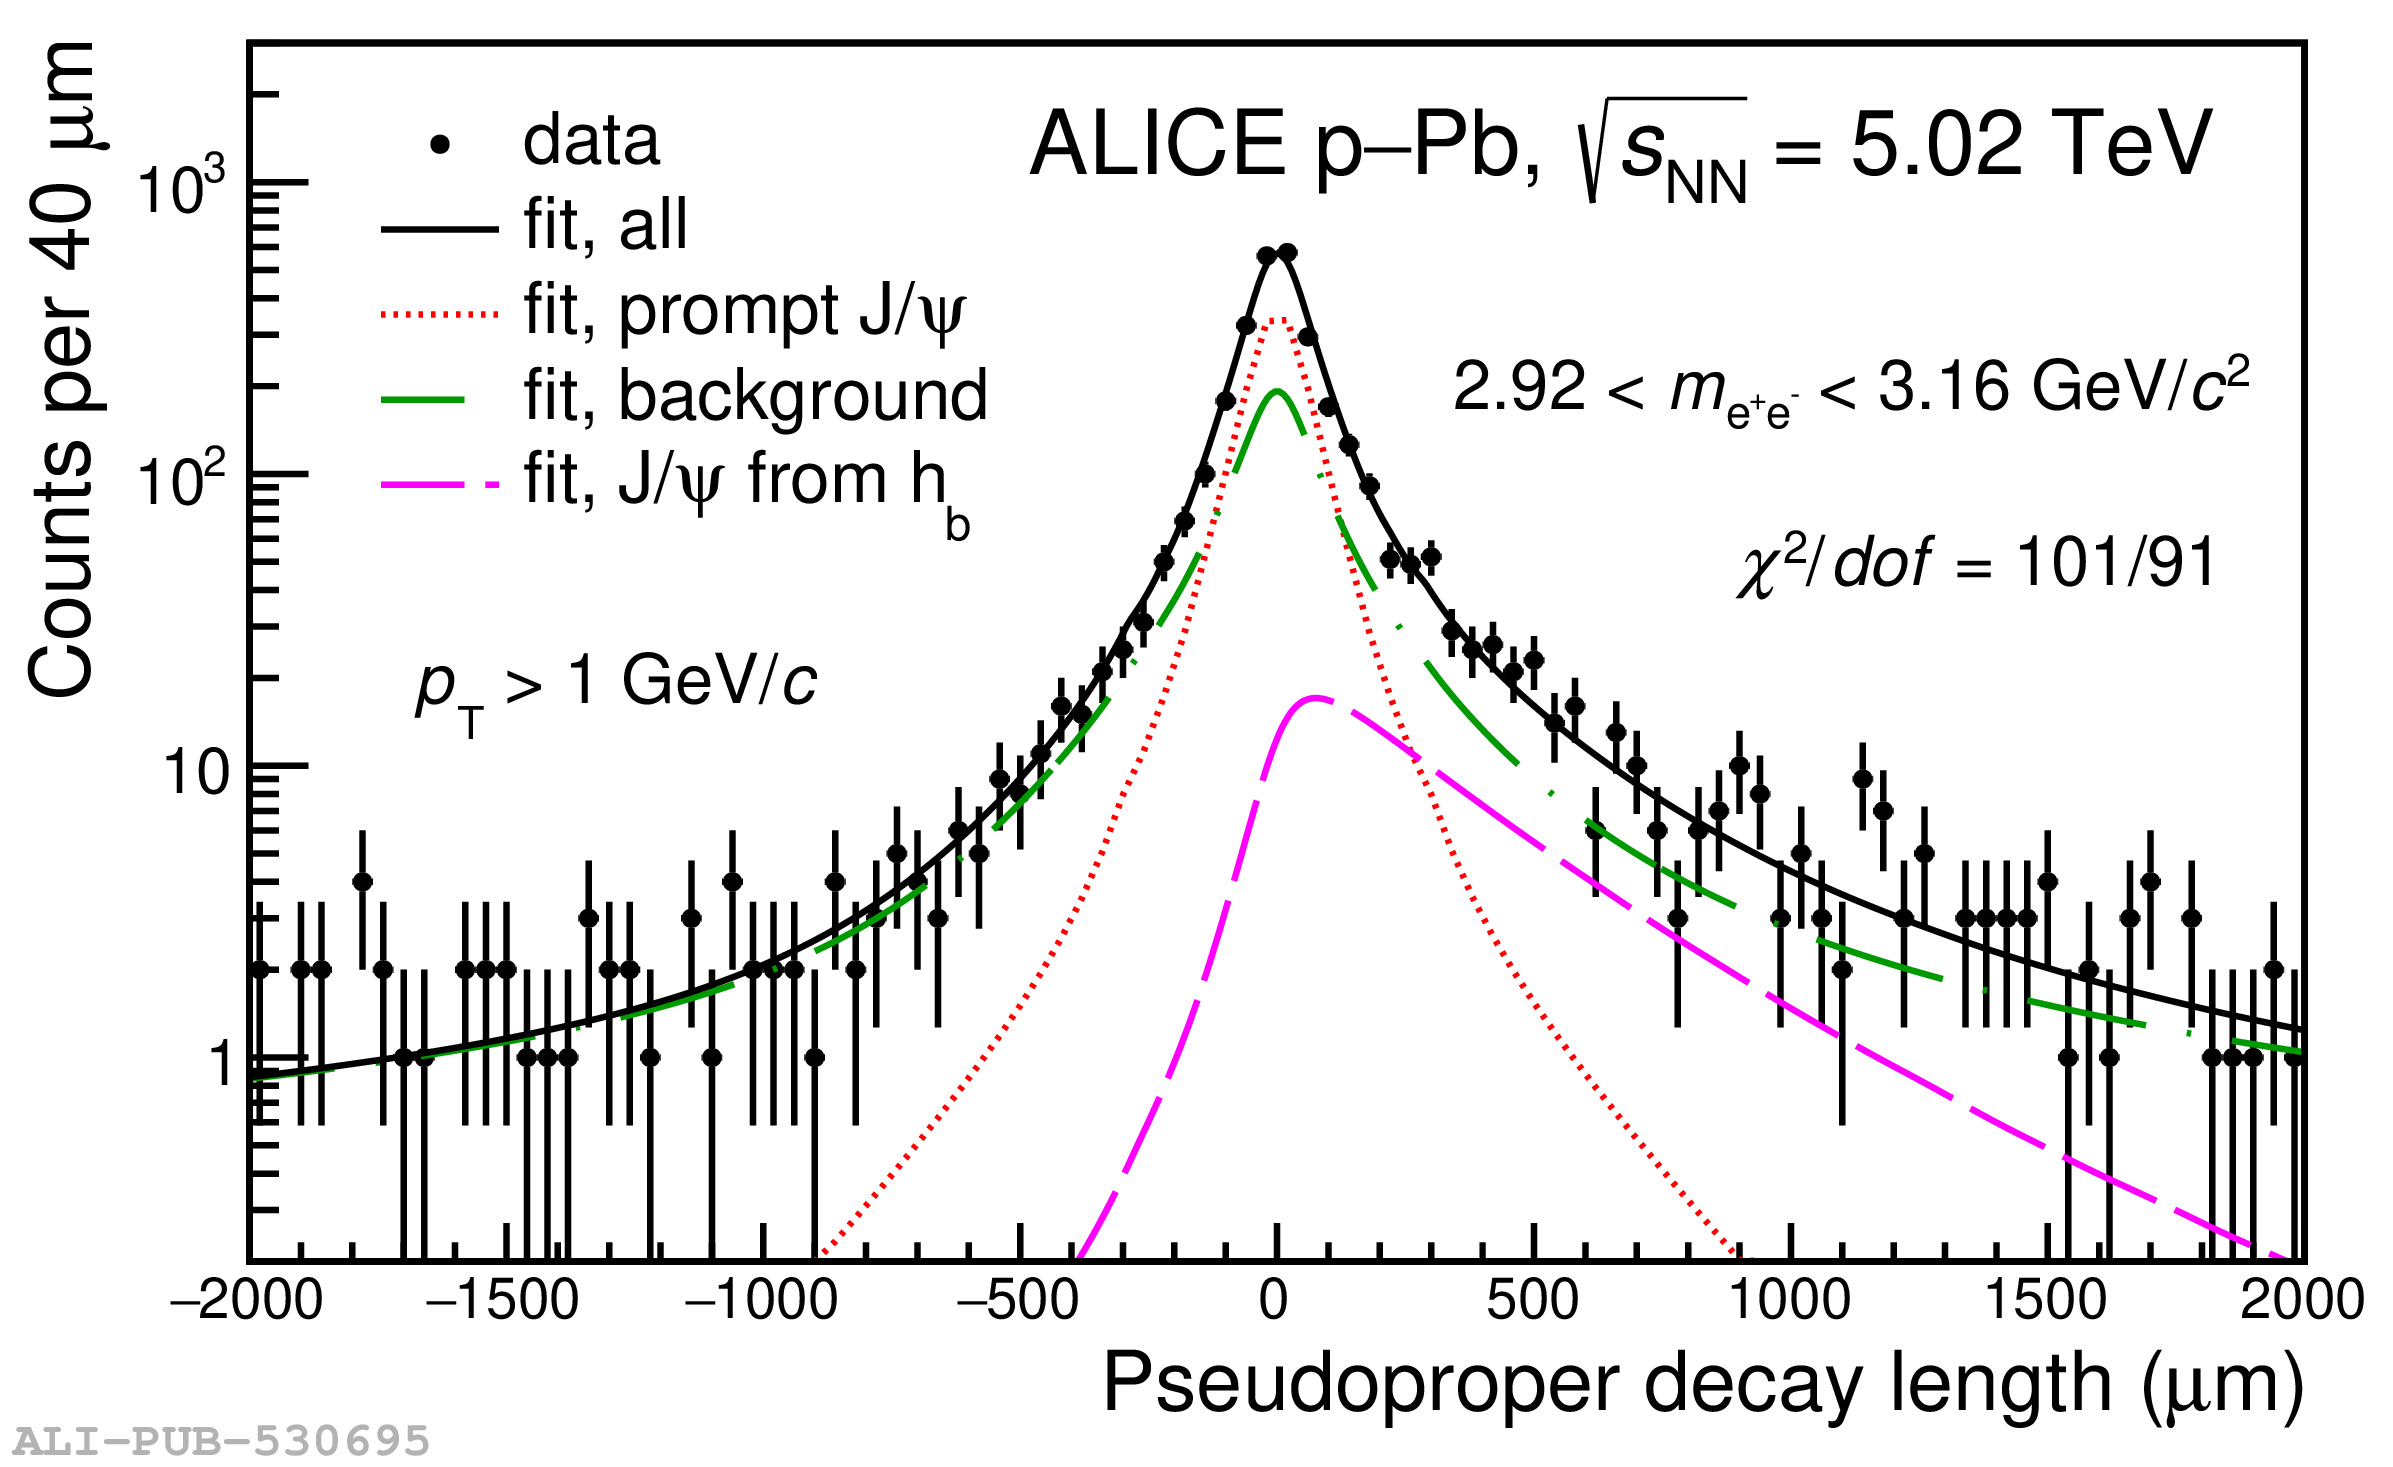 |
Figure 3
The \pt-differential inclusive \PJpsi\ cross section per unit of rapidity, $\textup{d}^2\sigma_{\rm incl.\,\PJpsi}/\textup{d}y\textup{d}p_{\rm T}$, as a function of \pt in p--Pb collisions (red circles) compared with the analogous cross section measured in pp collisions at $\sqrt{s}=5.02$ TeV multiplied by the Pb mass number (${\rm A}=208$) (black closed squares, shifted horizontally by 150 MeV/$c$ for better visibility). The vertical error bar and the box on top of each point represent the statistical and systematic uncertainty, respectively. The open square symbol (also shifted by 150 MeV/$c$) shows the value for pp collisions in the \pt interval 10-14 GeV/$c$, which was obtained with the interpolation procedure. In this case the error bar corresponds to the total uncertainty. | 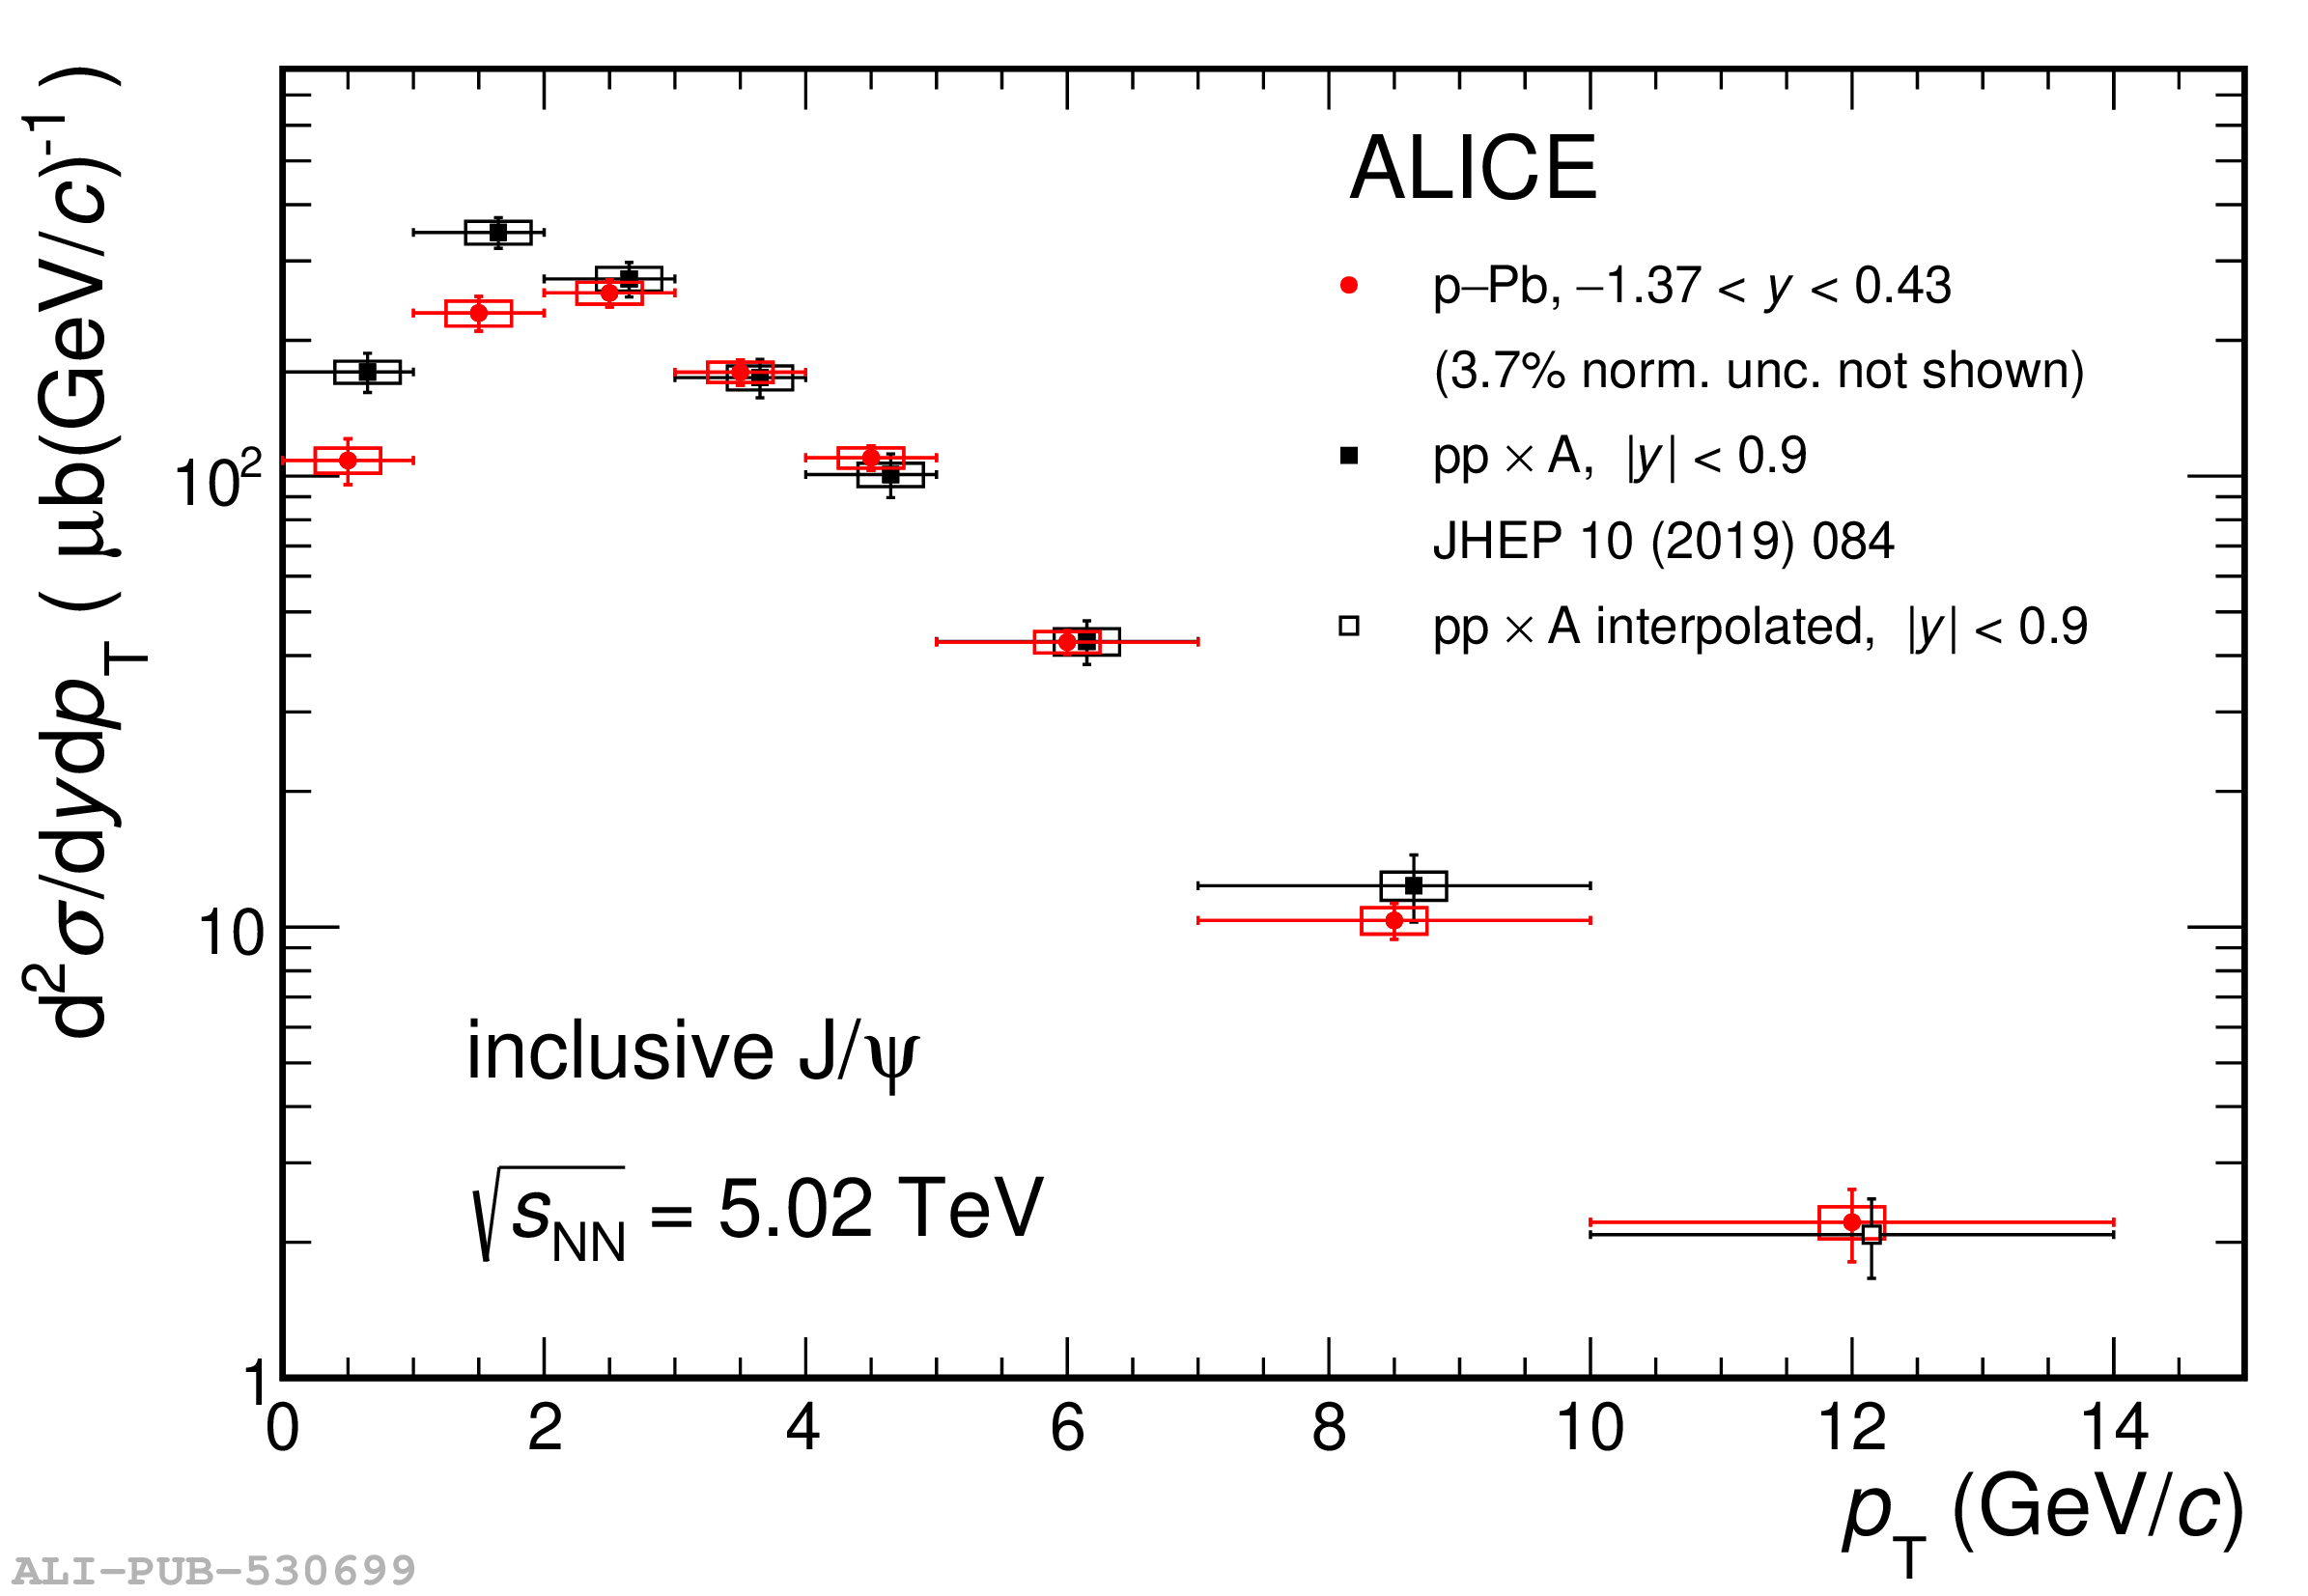 |
Figure 4
Fraction of \PJpsi from b-hadron decays at midrapidity as a function of the \PJpsi \pt in p--Pb collisions at $\snn = 5.02$ TeV (red closed circles) compared with results from the ALICE and ATLAS collaborations in the same collision system (blue and green closed circles, and the blue arrow that shows an upper limit at 95\% CL in the range $1.3<\pt<3$ GeV/$c$). The results from CDF in p$\rm \overline{p}$ collisions at $\sqrt{s} = 1.96$ TeV and those of the ALICE , ATLAS , and CMS collaborations in pp collisions at $\sqrt{s} = 7$ TeV or $\sqrt{s} = 8$ TeV are also shown (black symbols) For all experiments, vertical error bars represent the quadratic sum of the statistical and systematic uncertainties The data points of ALICE are placed horizontally at the mean value of the \pt distribution within each \pt-interval, determined from the MC simulations described in the text. |  |
Figure 5
$\textup{d}\sigma_{\rm prompt\ \PJpsi}/\textup{d}y$ as a function of the rapidity in the centre-of-mass frame (left panel) as obtained in this work at midrapidity and by the LHCb collaboration in the forward and backward rapidity regions , and $\textup{d}^2\sigma_{\rm prompt\ \PJpsi}/\textup{d}y\textup{d}p_{\rm T}$ as a function of \pt (right panel) compared with ATLAS results (reported up to $\pt = 20$ GeV/$c$). The vertical error bars and the boxes on top of each point represent the statistical and systematic uncertainties. In the left panel, the systematic uncertainty of the ALICE data point includes also the contribution from the extrapolation procedure to go from the visible region ($\pt>1$ GeV/$c$) to $\pt>0$, as described in the text For the measurements as a function of \pt, the data symbols are placed within each bin at the mean of the \pt distribution determined from MC simulations. The results of a model including nuclear shadowing based on the EPPS16 and nCTEQ15 nPDFs are shown superimposed on both panels (see text for details). In the right panel, the computations refer only to the ALICE rapidity range. |   |
Figure 6
${\rm d}\sigma_{\rm \PJpsi\ from\ h_{\rm b}}/{\rm d}y$ as a function of rapidity (left panel) as obtained at midrapidity in this work for $\pt>0$ and by the LHCb collaboration in the forward and backward rapidity regions for $0<\pt<14$ GeV/$c$, and ${\rm d}^2\sigma_{\rm \PJpsi\ from\ h_{\rm b}}/{\rm d}y{\rm d}p_{\rm T}$ as a function of $\pt$ (right panel) compared with ATLAS measurements (shown up to $\pt = 20$ GeV/$c$). The statistical and systematic uncertainties are shown as vertical error bars and hollow boxes, respectively. The extrapolation uncertainty related to the procedure to go from the visible region ($\pt > 1$ GeV/$c$) to $\pt > 0$ for the ALICE data point in the left panel is indicated with a dashed band. For the measurements as a function of $\pt$, data symbols are placed at the mean value of the $\pt$ distribution within each bin The results are compared to FONLL computations with EPPS16 nPDFs, highlighting the total theoretical uncertainty (empty band) and the contribution from EPPS16 (coloured band). In the right panel, model computations are obtained in the same rapidity range of the ALICE results, namely $-1.37< y< 0.43$. | 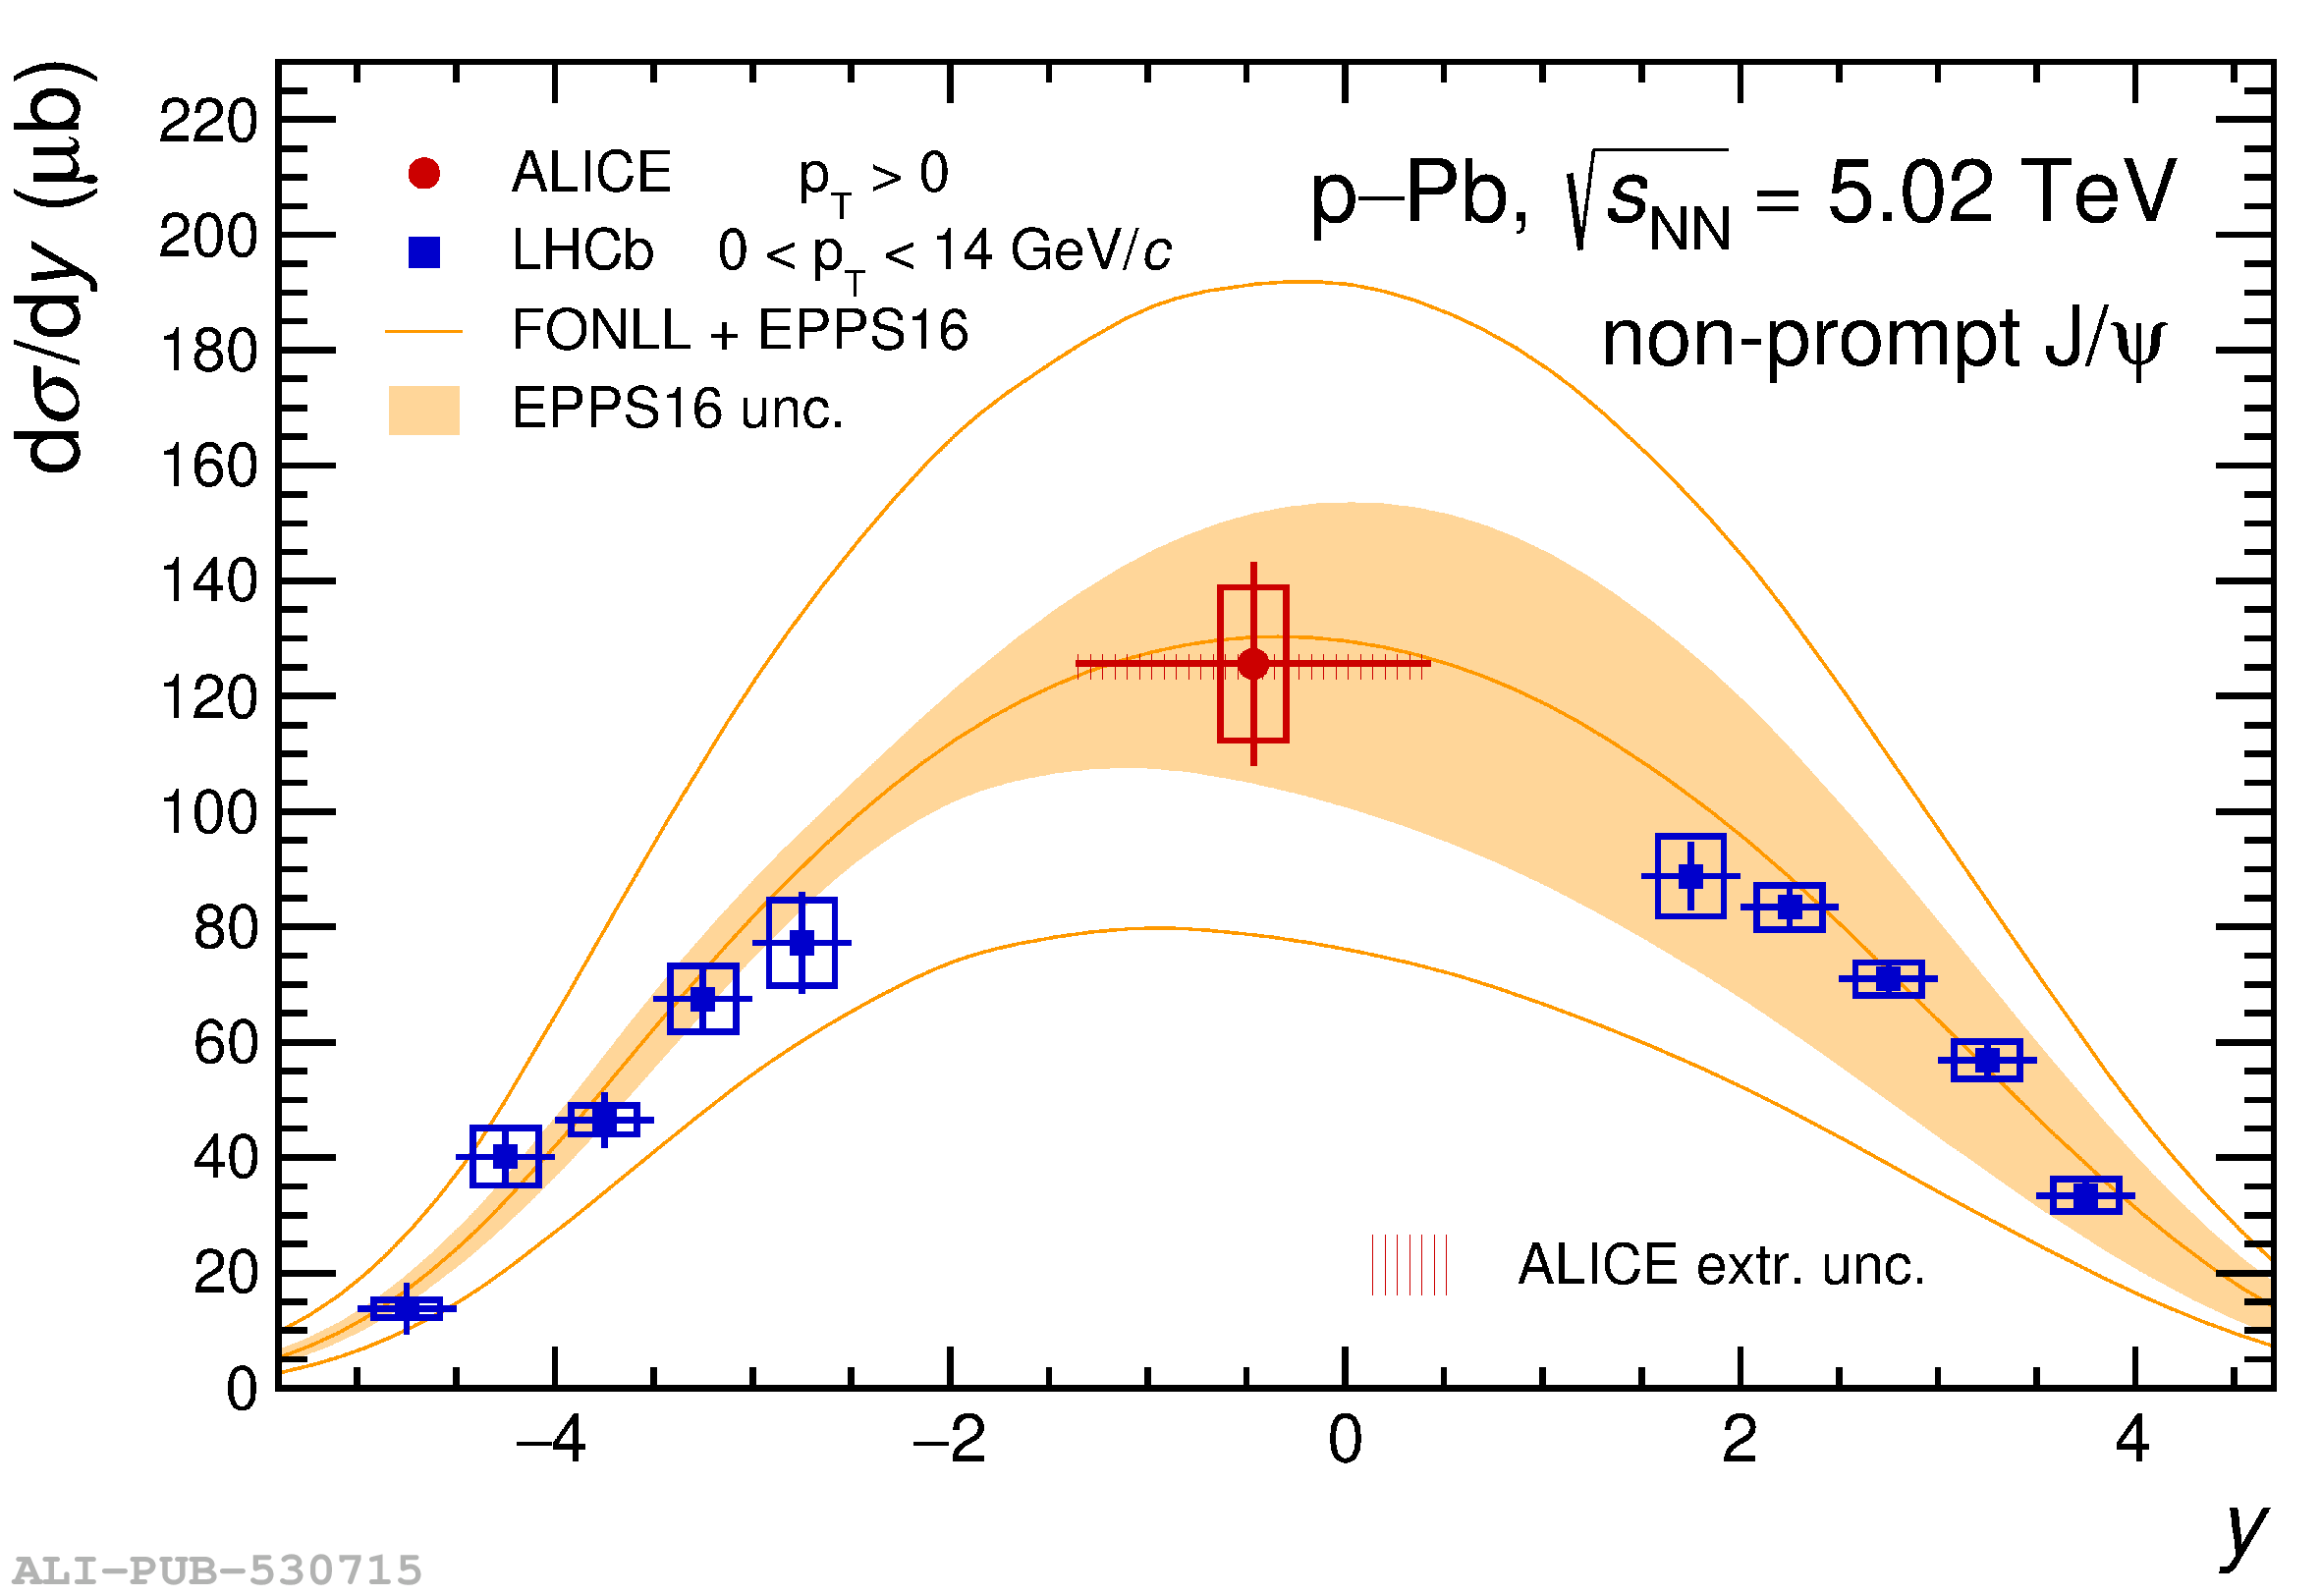 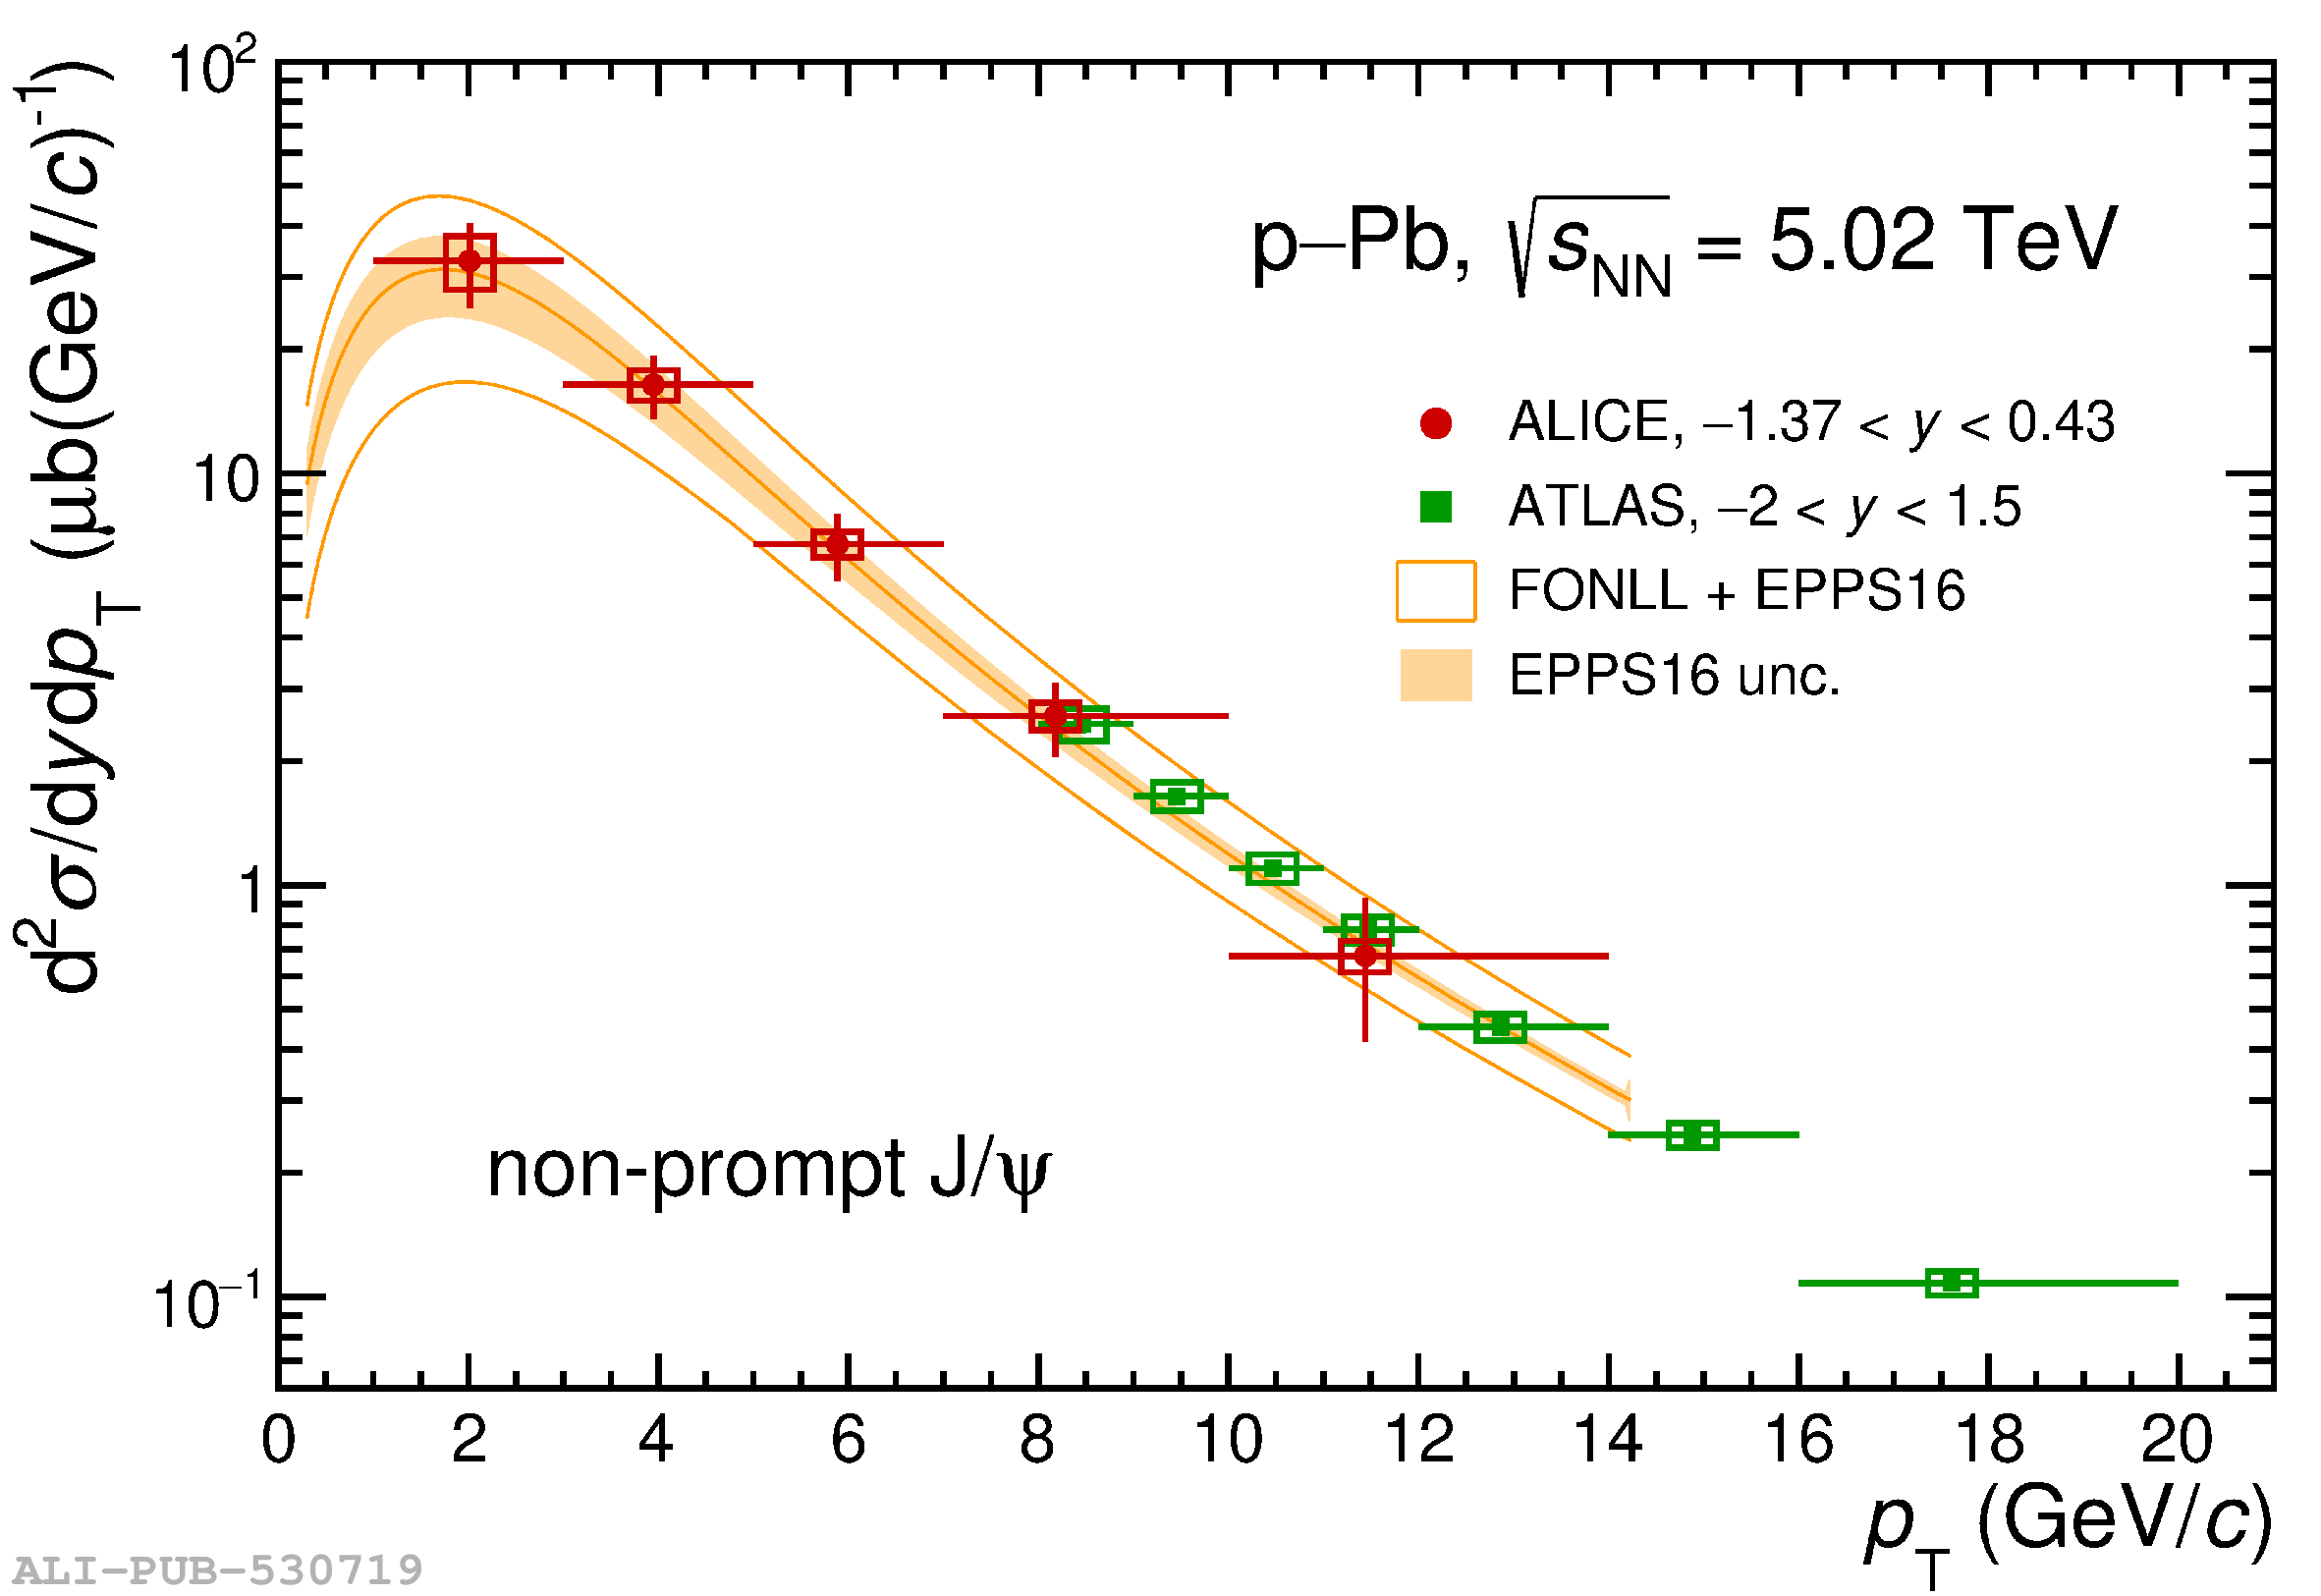 |
Figure 7
$R_{\rm pPb}$ of prompt \PJpsi as a function of rapidity (left panel) and as a function of \pt along with that of inclusive \PJpsi at midrapidity (right panel). Results are shown in comparison with LHCb measurements at backward and forward rapidity in the left panel and with ATLAS results (shown up to $\pt = 20$ GeV/$c$) in the right-hand panel Statistical uncertainties are represented by vertical error bars, while open boxes correspond to systematic uncertainties. In the left panel, the systematic uncertainty of the ALICE data point includes also the contribution from the extrapolation procedure to go from the visible region ($\pt>1$ GeV/$c$) to $\pt>0$. The filled box around $R_{\rm pPb} = 1$ in the right panel indicates the size of the global relative uncertainty of the ALICE measurements. The results of various model predictions for prompt \PJpsi implementing different CNM effects are also shown . |  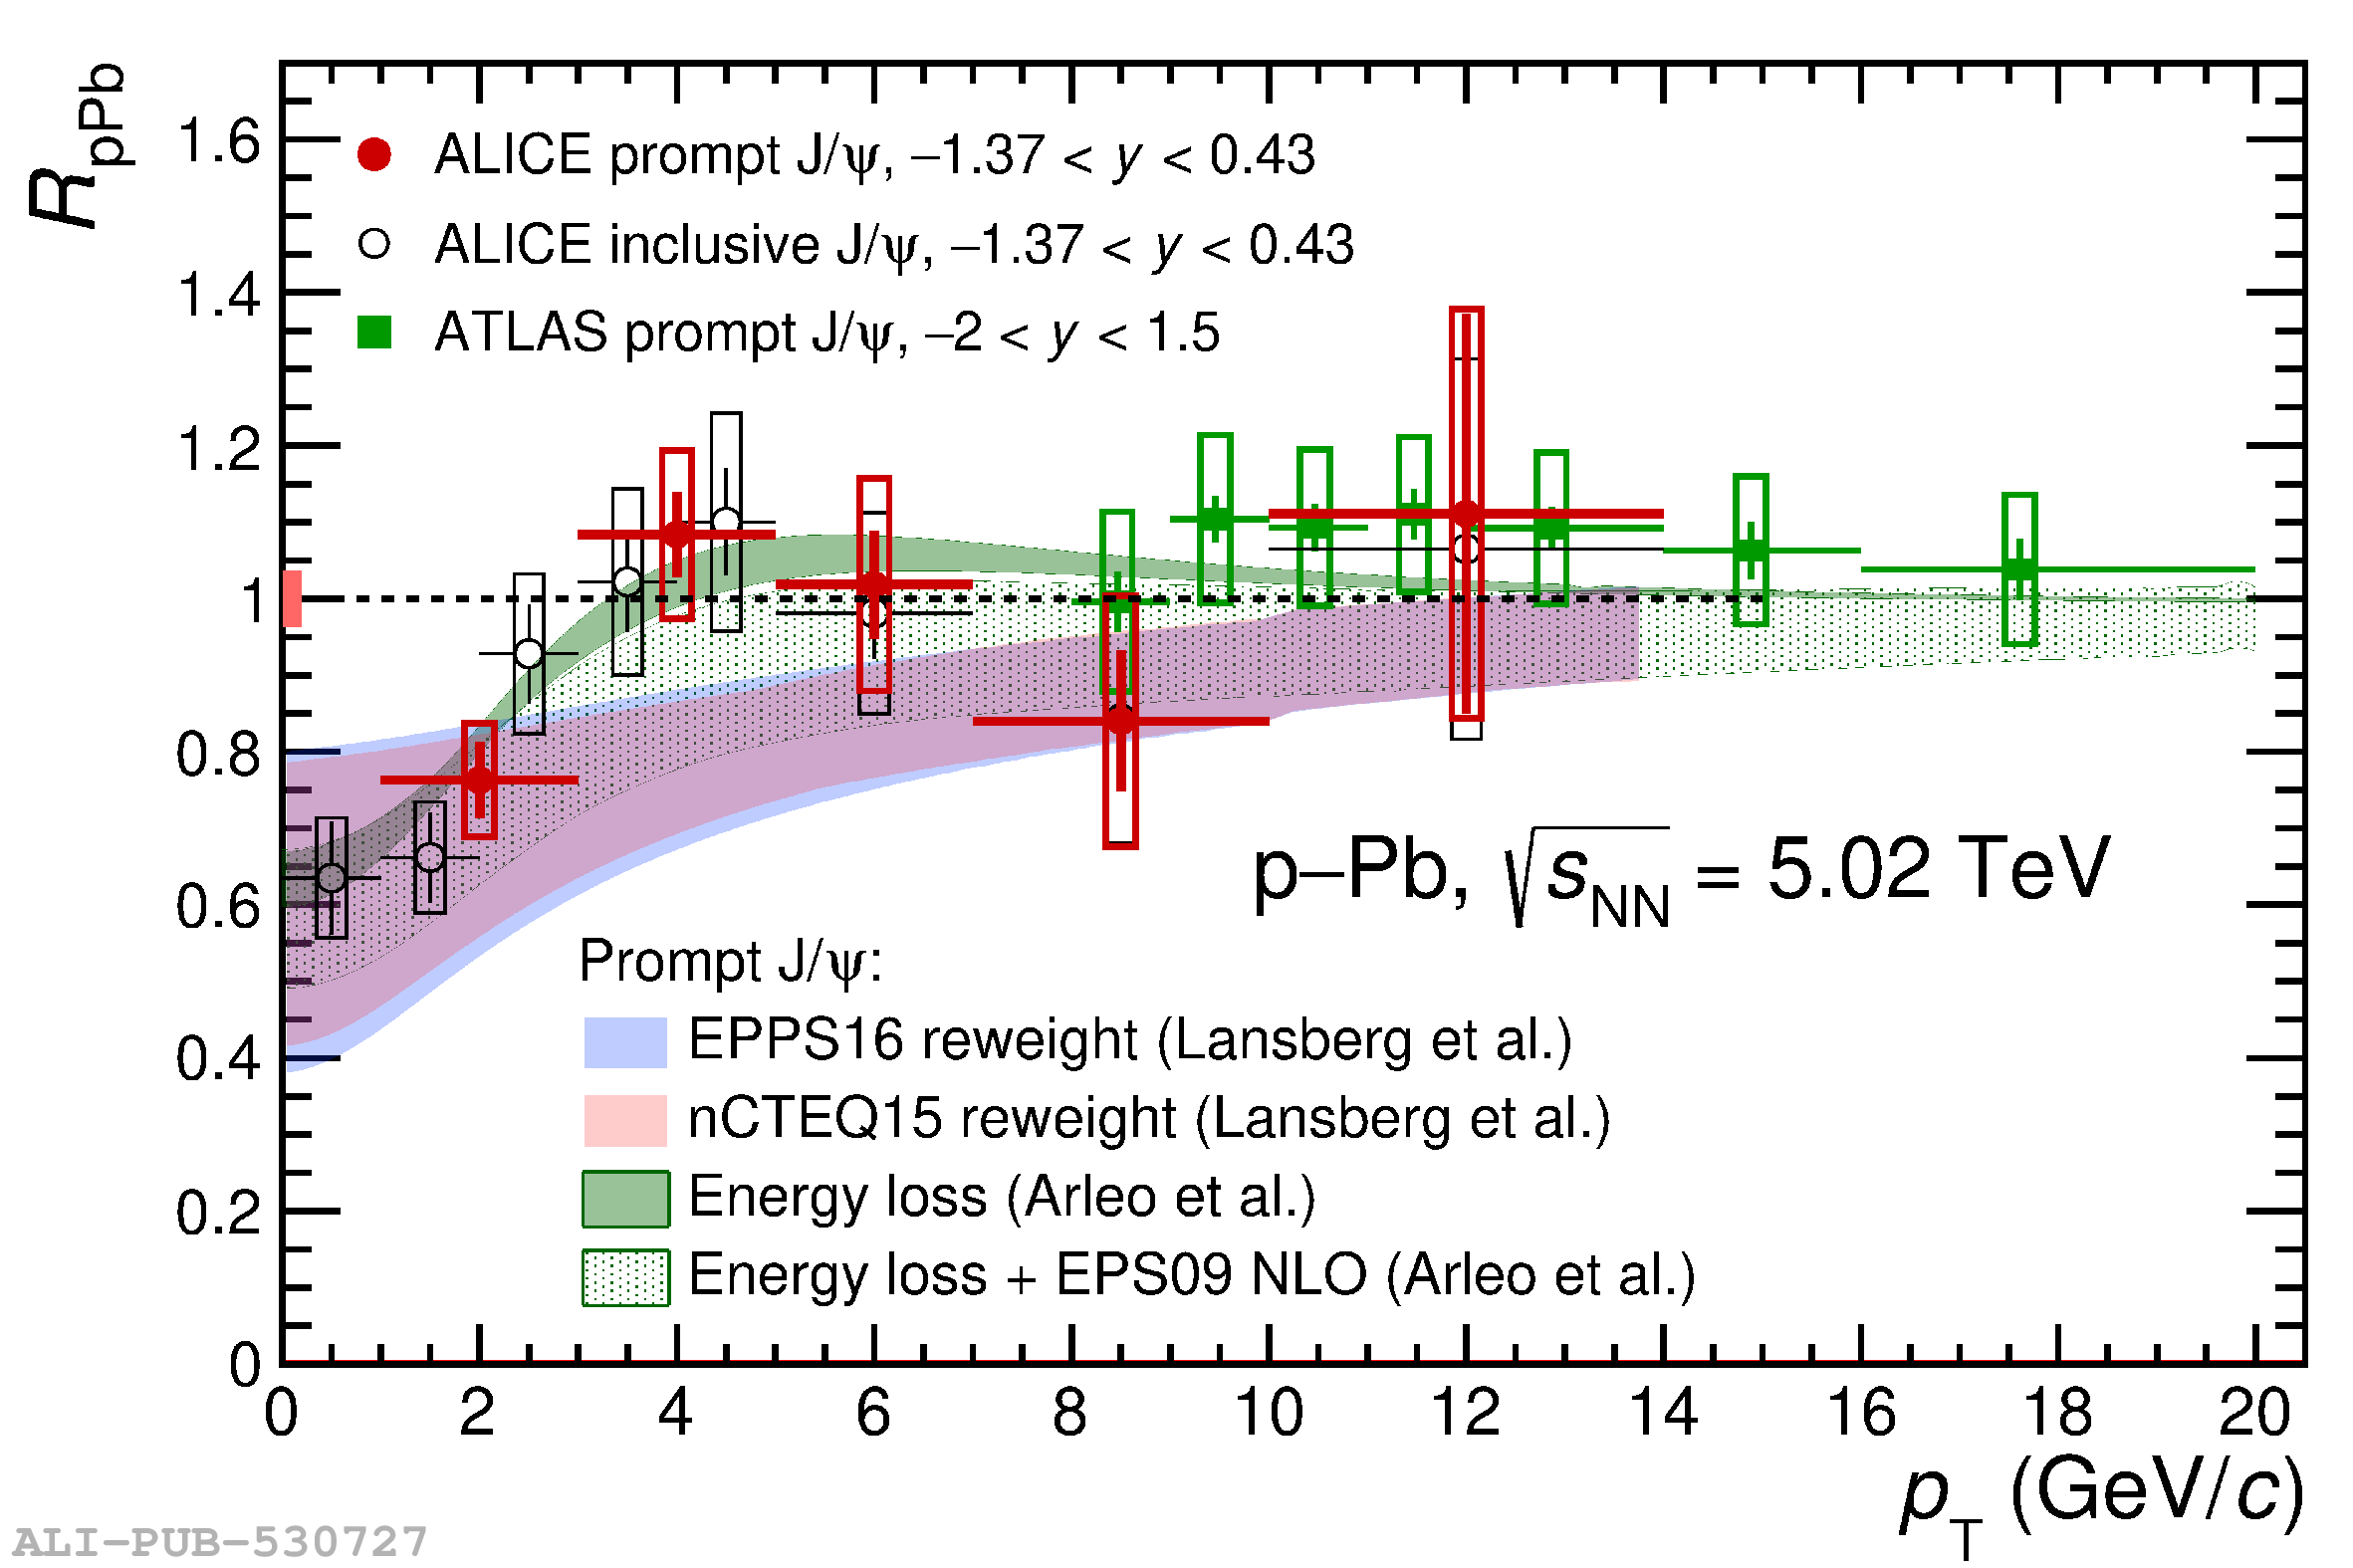 |
Figure 8
Nuclear modification factor $R_{\rm pPb}$ of non-prompt \PJpsi as a function of rapidity (left panel) and as a function of \pt at midrapidity (right panel). The results are compared with similar measurements from the LHCb and ATLAS experiments Vertical bars and the open boxes indicate the statistical and systematic uncertainties, respectively. The uncertainty due to the extrapolation to $\pt = 0$ GeV/$c$ for the ALICE measurement is reported as a shaded box in left panel, while the filled box around $R_{\rm pPb} = 1$ in the right-hand panel denotes the size of the global normalisation uncertainty The predicted nuclear modification factors according to the nDSg (central value shown in the left panel only) and EPPS16 parameterisations (including a reweighted computation from ) are shown superimposed on both panels. | 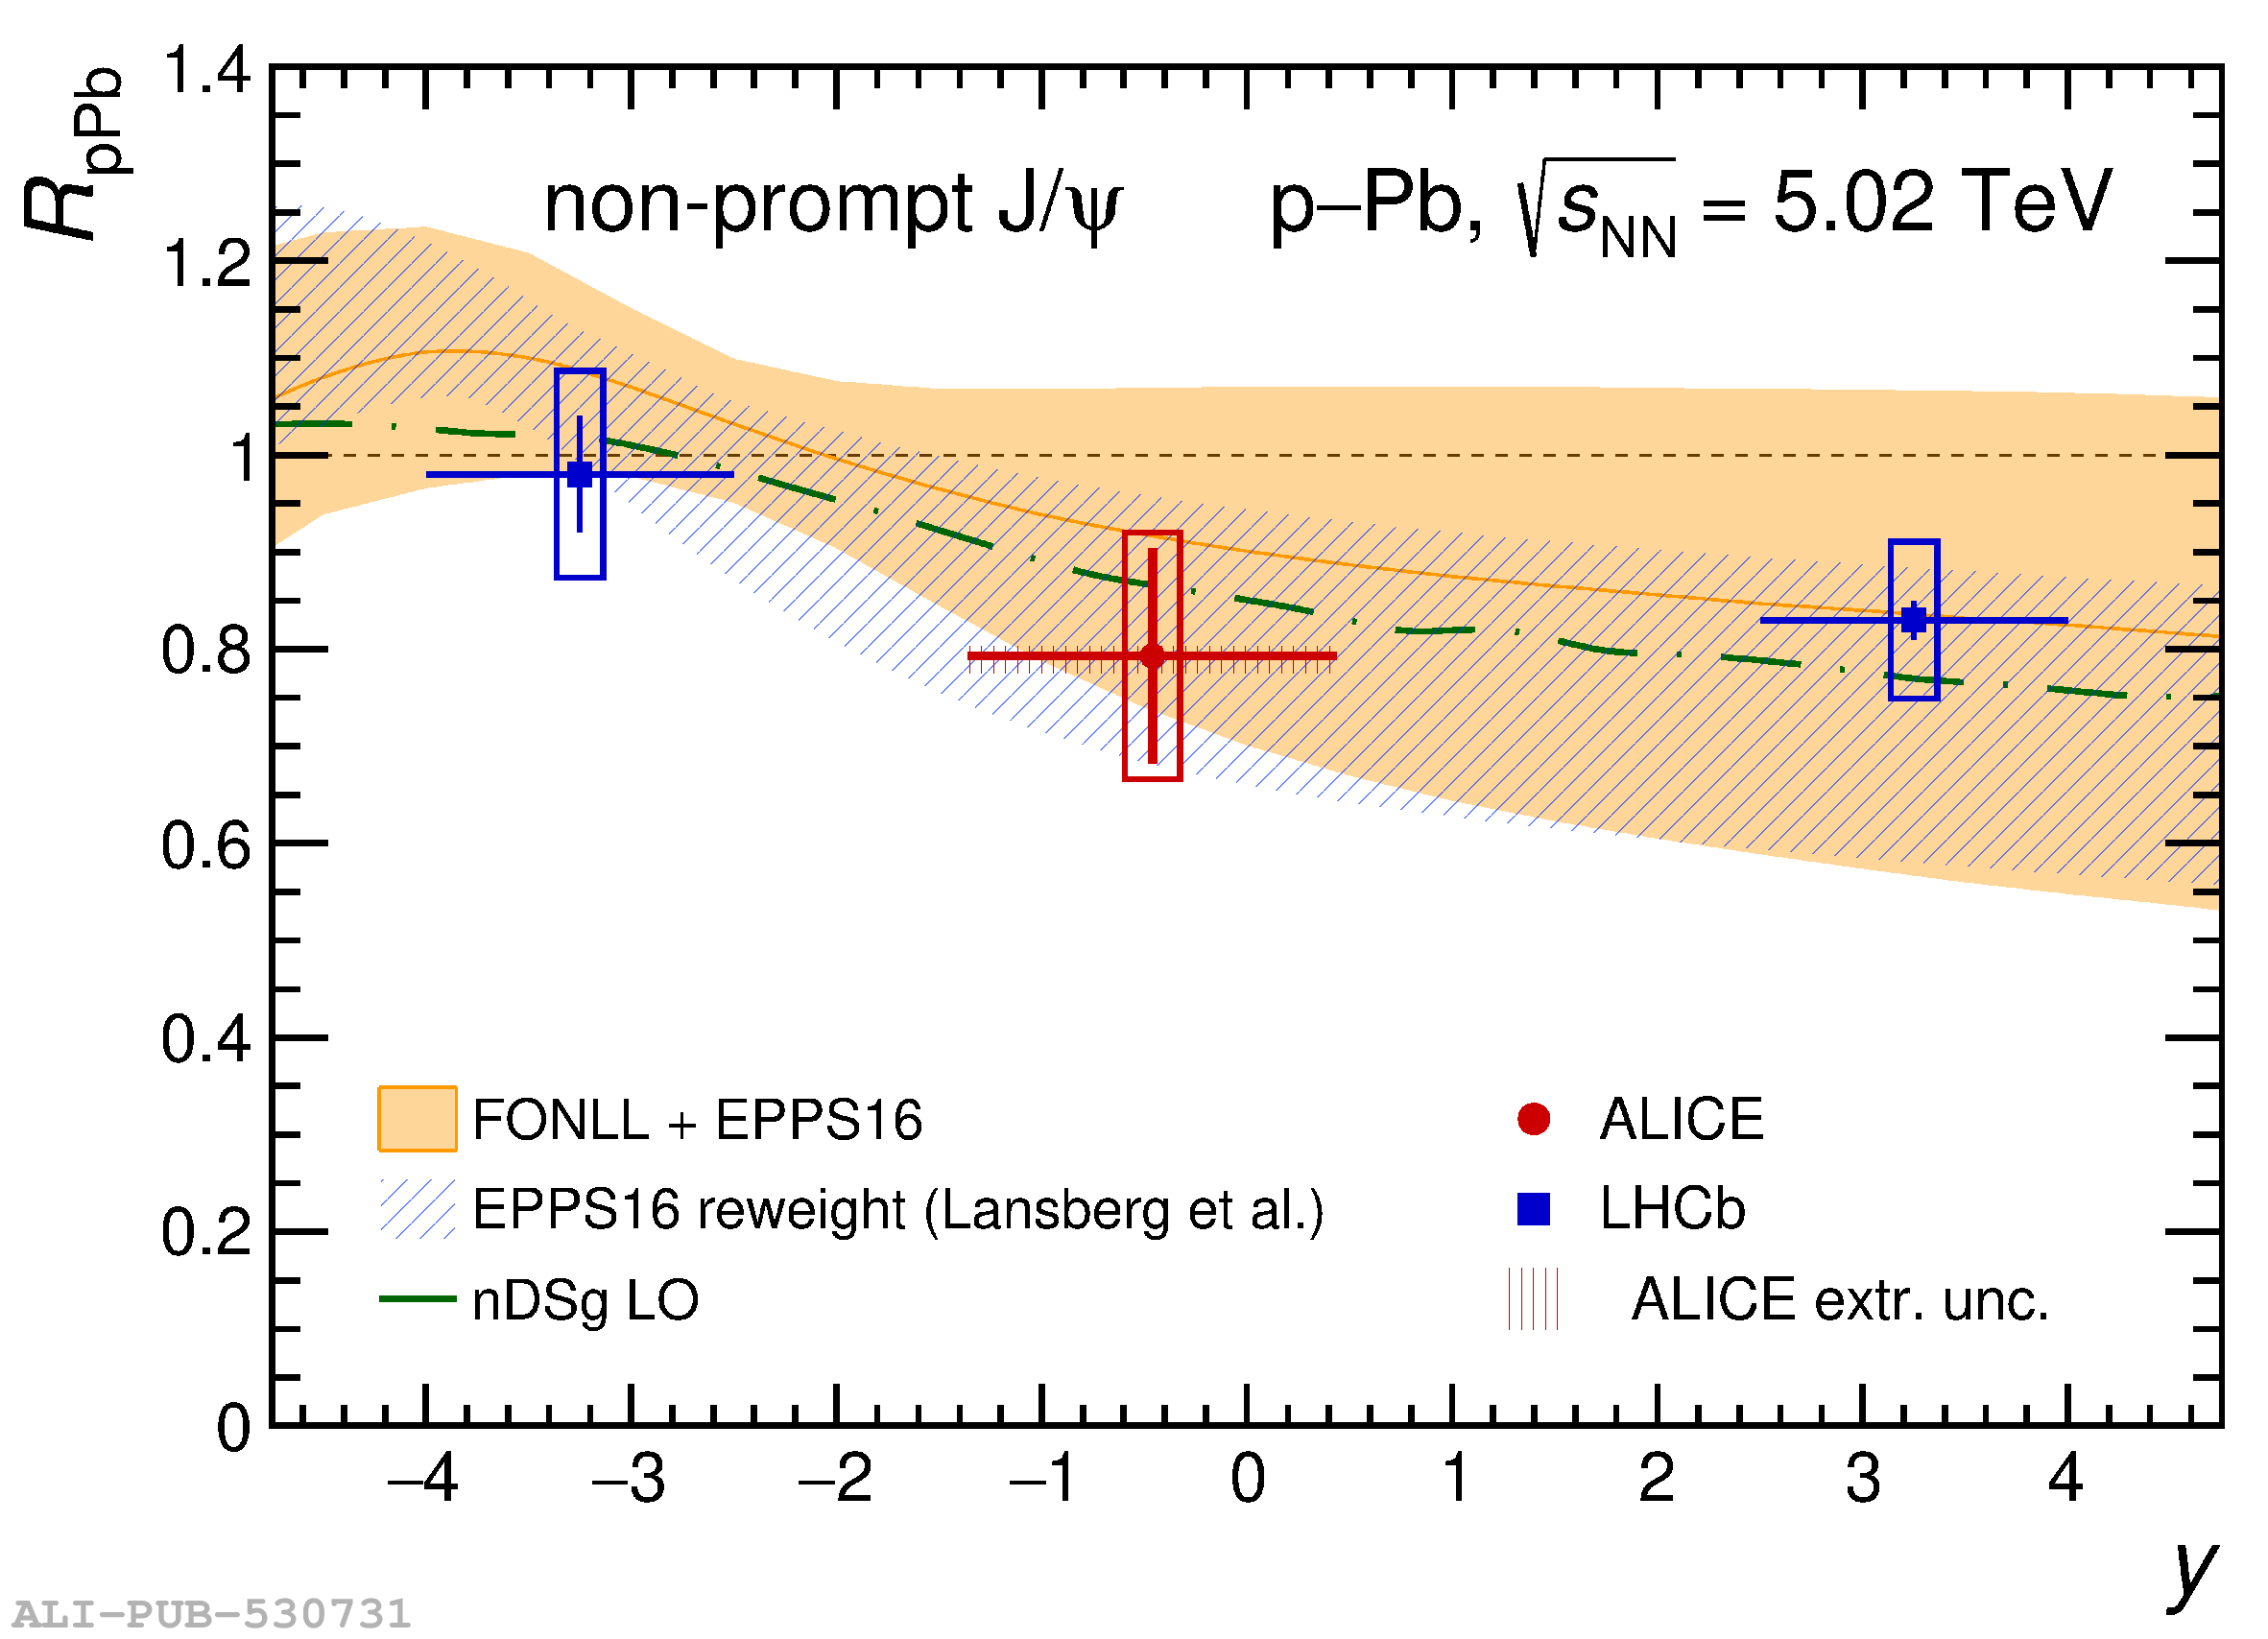 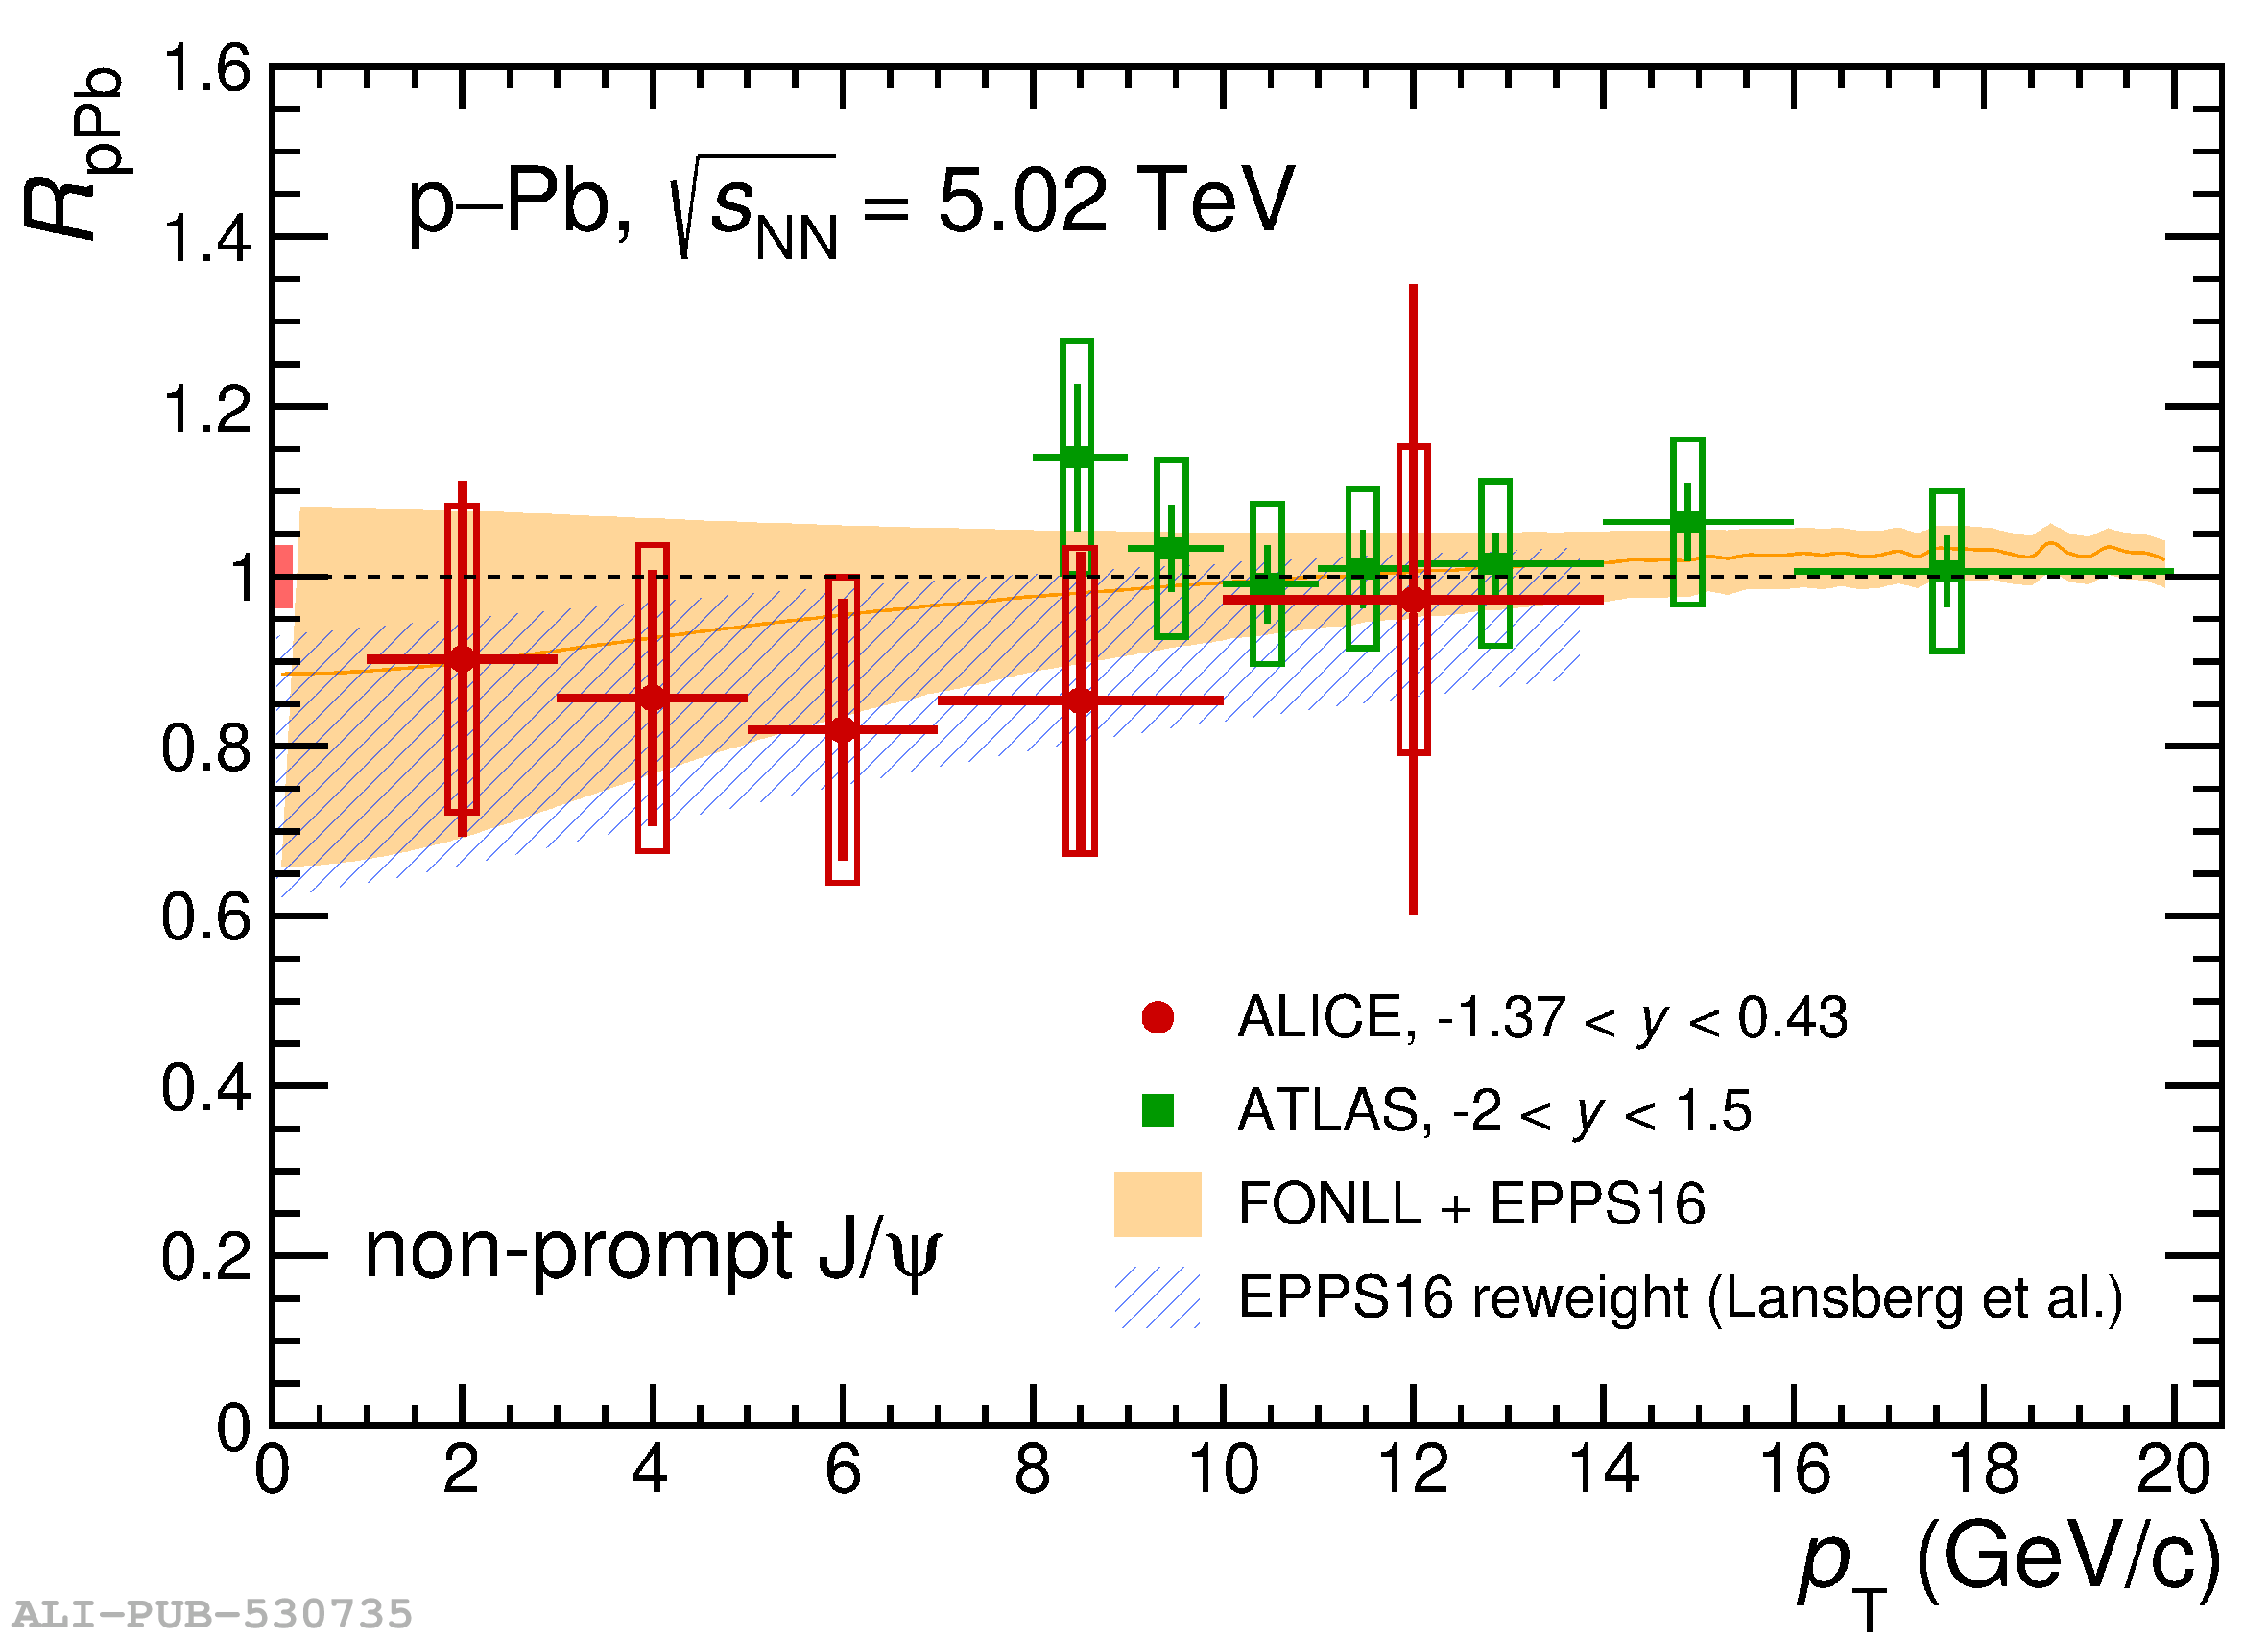 |