The coherent photoproduction of $\rm{J/\psi}$ and $\rm{\psi'}$ mesons was measured in ultra-peripheral Pb-Pb collisions at a center-of-mass energy $\sqrt{s_{\mathrm{NN}}}~=~5.02$ TeV with the ALICE detector. Charmonia are detected in the central rapidity region for events where the hadronic interactions are strongly suppressed. The $\rm{J/\psi}$ is reconstructed using the dilepton ($l^{+} l^{-}$) and proton-antiproton decay channels, while for the $\rm{\psi'}$, the dilepton and the $l^{+} l^{-} \pi^{+} \pi^{-}$ decay channels are studied. The analysis is based on an event sample corresponding to an integrated luminosity of about 233 ${\mu b}^{-1}$. The results are compared with theoretical models for coherent $\rm{J/\psi}$ and $\rm{\psi'}$ photoproduction. The coherent cross section is found to be in a good agreement with models incorporating moderate nuclear gluon shadowing of about 0.65 at a Bjorken-$x$ of around $6\times 10^{-4}$, such as the EPS09 parametrization, however none of the models is able to fully describe the rapidity dependence of the coherent $\rm{J/\psi}$ cross section including ALICE measurements at forward rapidity. The ratio of $\rm{\psi'}$ to $\rm{J/\psi}$ coherent photoproduction cross sections was also measured and found to be consistent with the one for photoproduction off protons.
Eur. Phys. J. C 81 (2021) 712
HEP Data
e-Print: arXiv:2101.04577 | PDF | inSPIRE
CERN-EP-2021-002
Figure group
Figure 1
Left: Invariant mass distribution of \lplp\ pairs. The dashed green line corresponds to the background. The solid magenta and red lines correspond to Crystal Ball functions representing the \Jpsi\ and \Ppsi\ signal, respectively. The solid blue line corresponds to the sum of background and signal functions. Right: Transverse momentum distribution of \Jpsi\ candidates in the range quoted in the figure (around the \Jpsi\ nominal mass). |  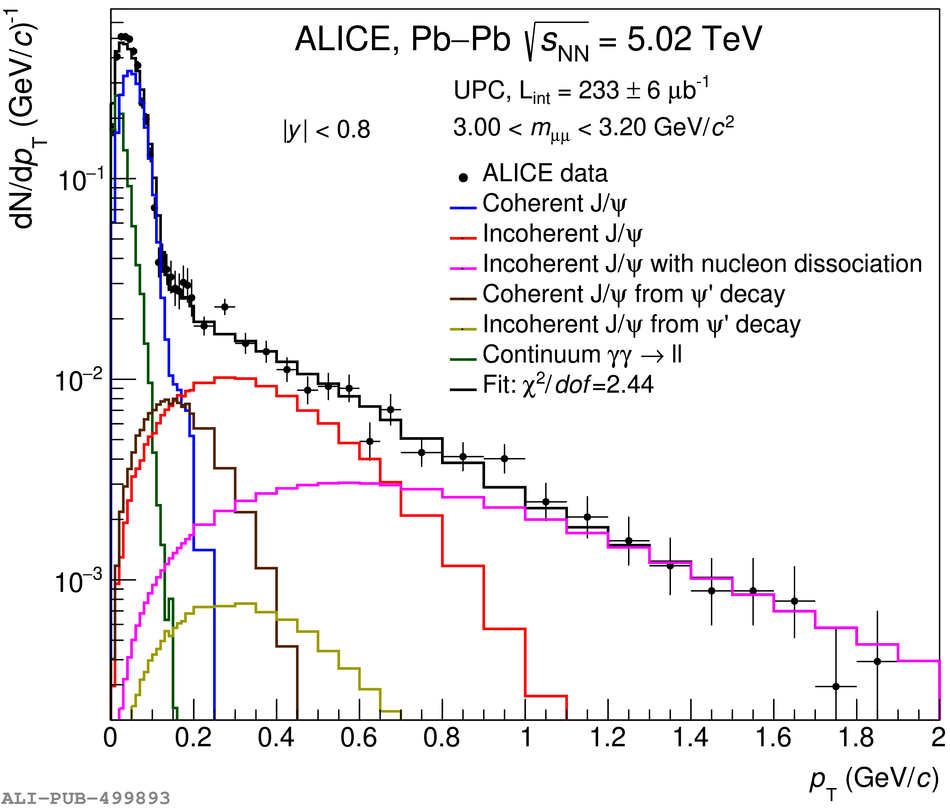 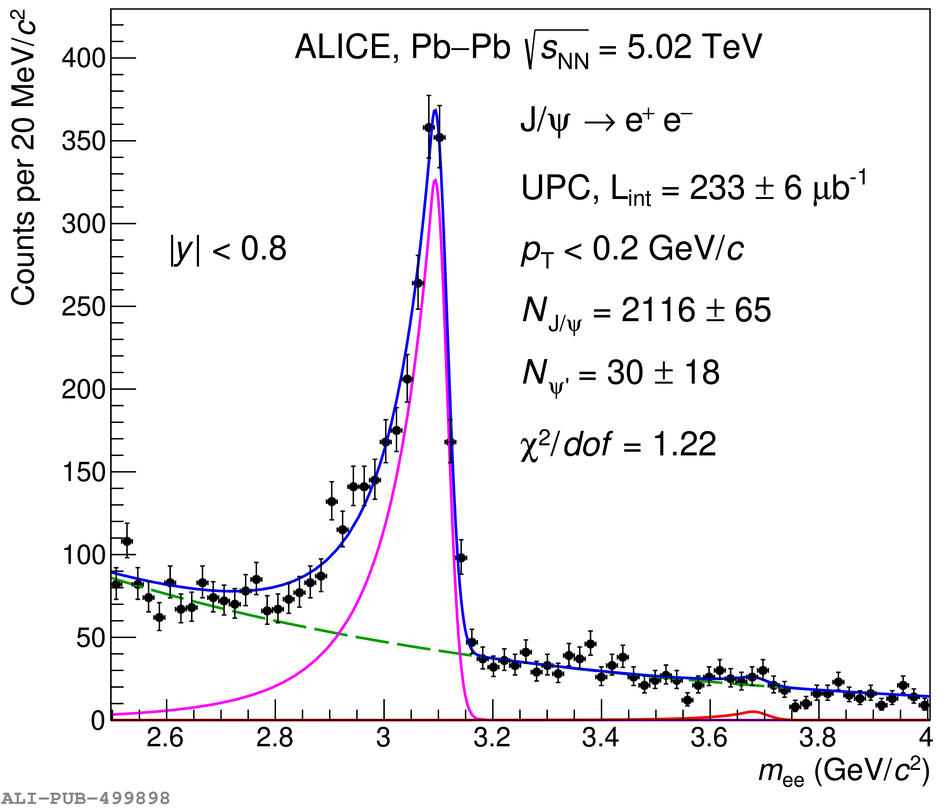 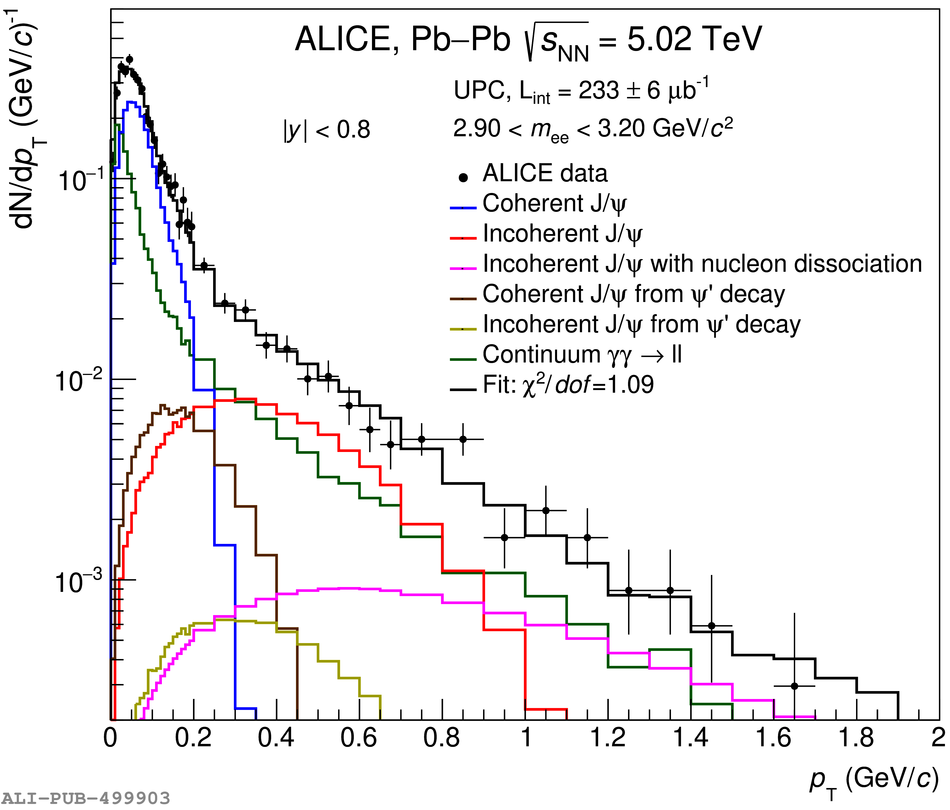 |
Figure 2
Left: Invariant mass distribution of \pbp\ pairs. The dashed green line corresponds to the background description. The solid magenta and red lines correspond to Crystal Ball functions representing the \Jpsi\ and \Ppsi\ signals, respectively. The solid blue line corresponds to the sum of background and signal functions. Right: Transverse momentum distribution of \Jpsi\ candidates in the range quoted in the figure (around the \Jpsi\ nominal mass). | 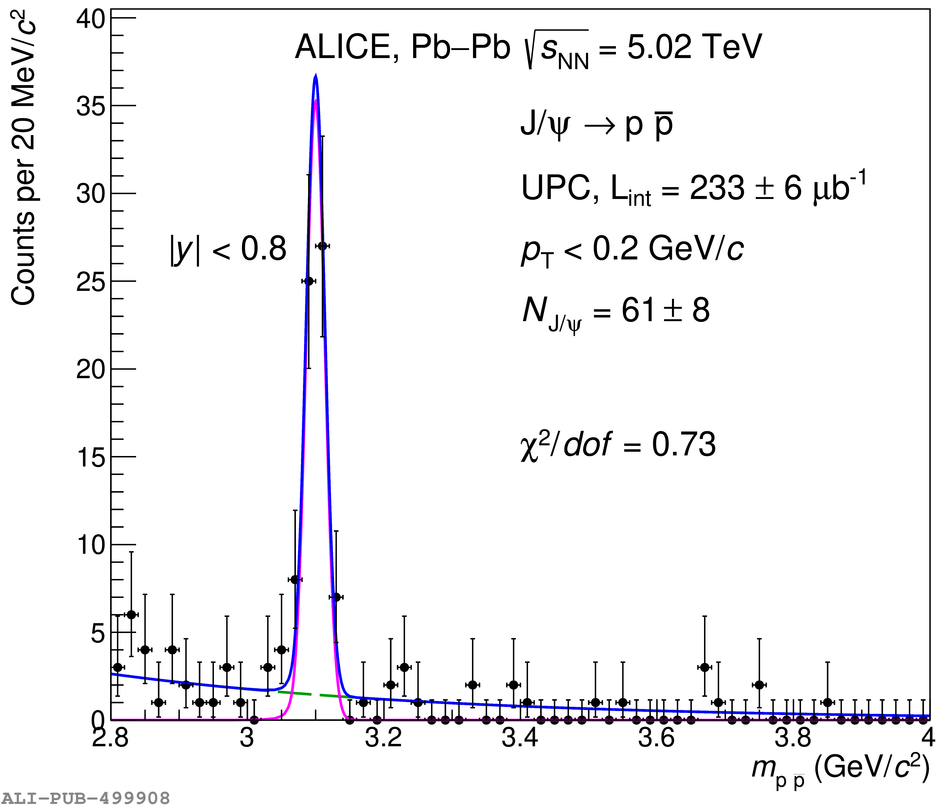 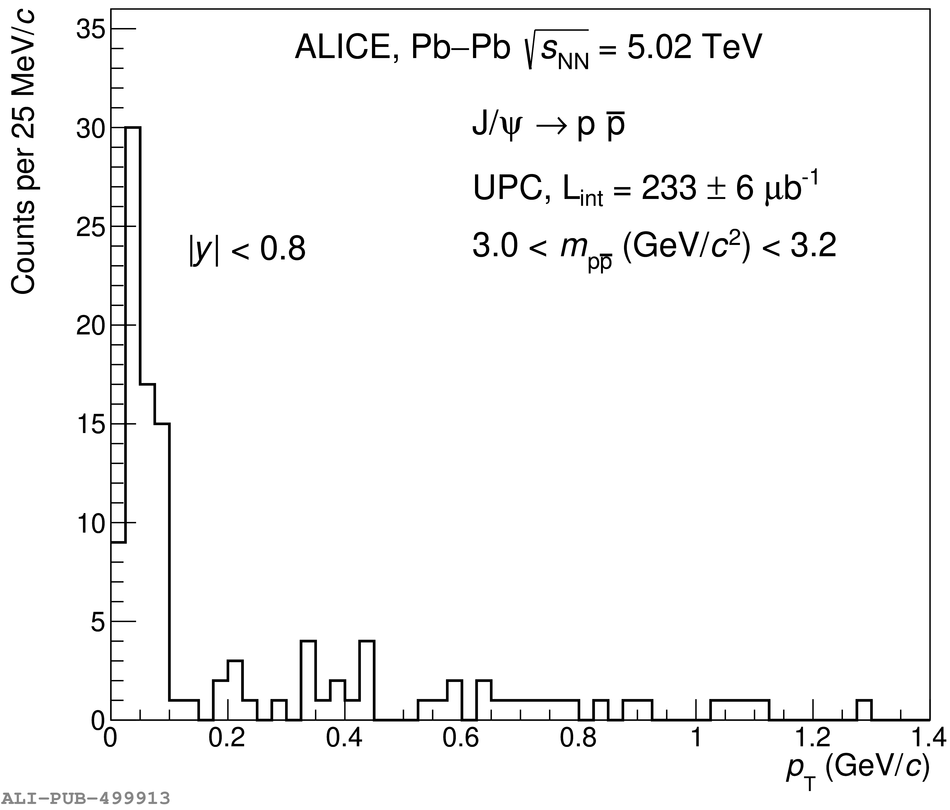 |
Figure 3
Left: Invariant mass distribution of \lplp\ pairs. The dashed green line corresponds to the background description. The solid magenta and red line correspond to Crystal Ball functions representing the \Jpsi\ and \Ppsi\ signals, respectively. The solid blue line corresponds to the sum of background and signal functions. Right: Transverse momentum distribution of \Ppsi\ candidates in the mass range quoted in the figure (around the \Ppsi\ mass). | 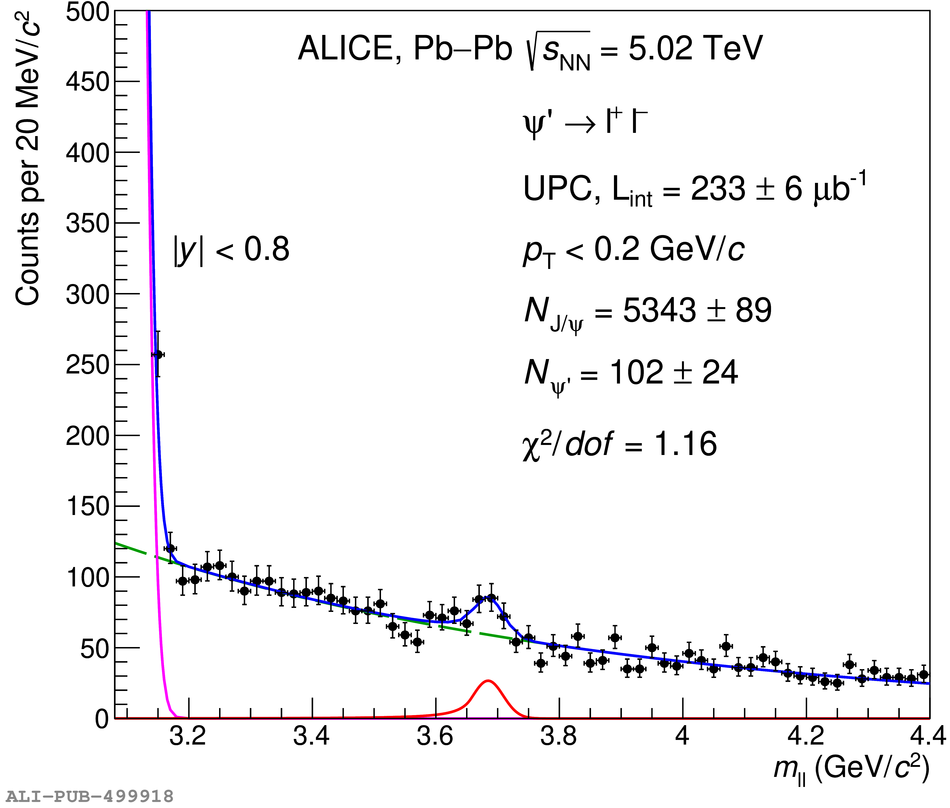 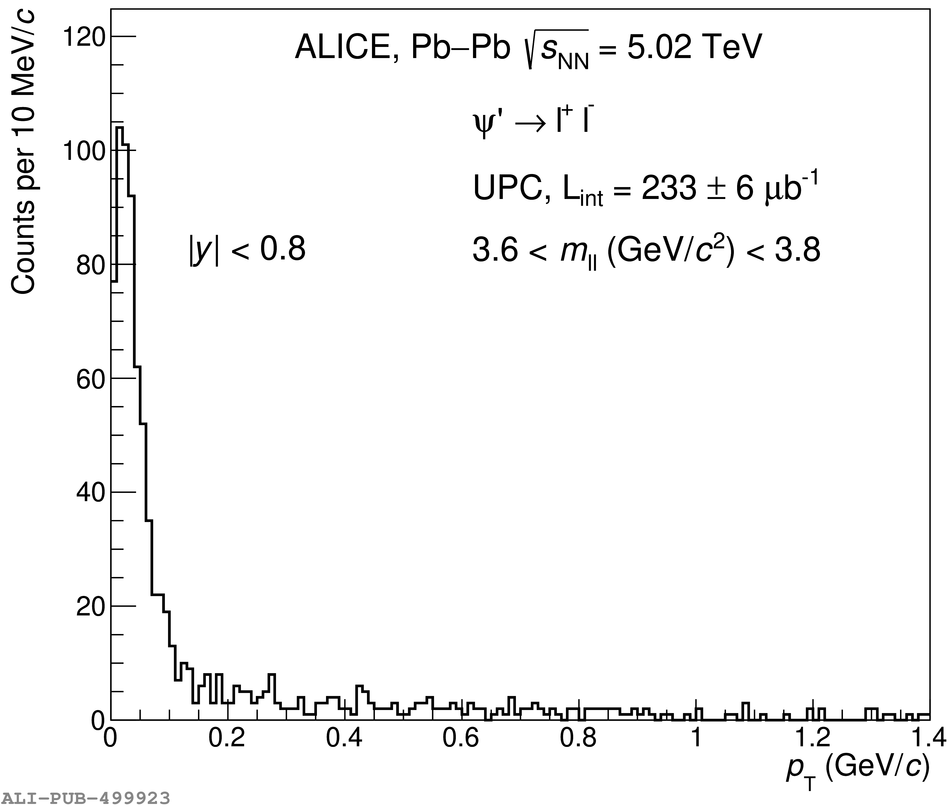 |
Figure 4
Left: Invariant mass distribution for \Ppsi\ $\rightarrow$ \mmpp\ (upper panel) and \Ppsi\ $\rightarrow$ \eepp\ (bottom panel). The green line shows the wrong sign four-track events. The red line shows the \Ppsi\ signal as described in the text. Right: Transverse momentum distribution of \Ppsi candidates in the mass range quoted in the figure (around the \Ppsi\ nominal mass). |  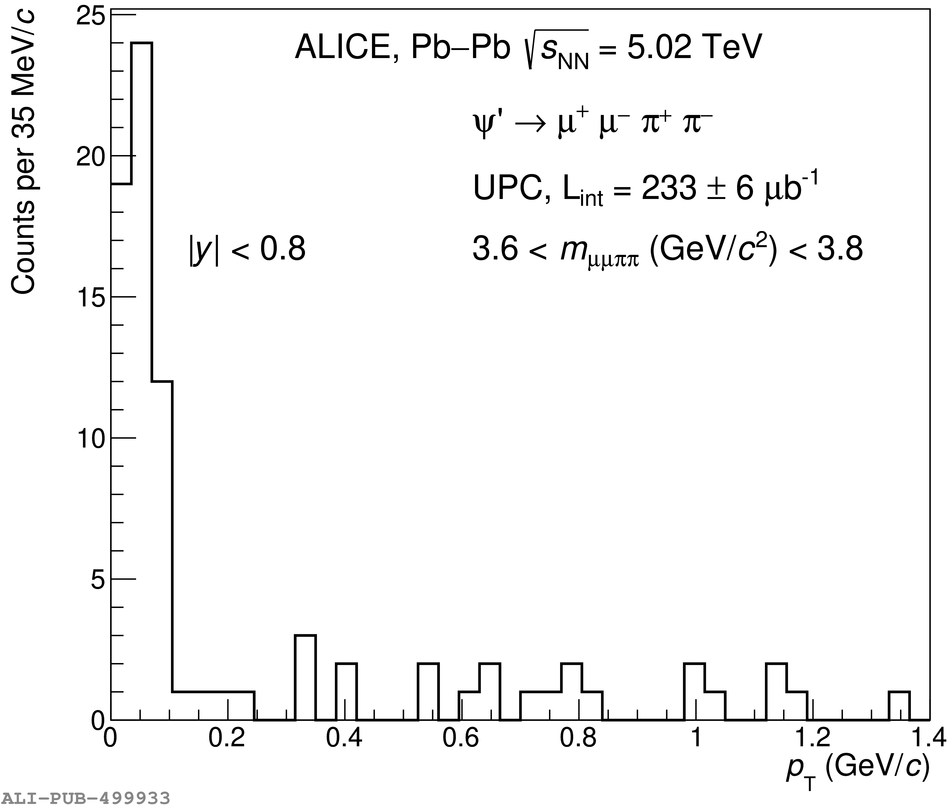 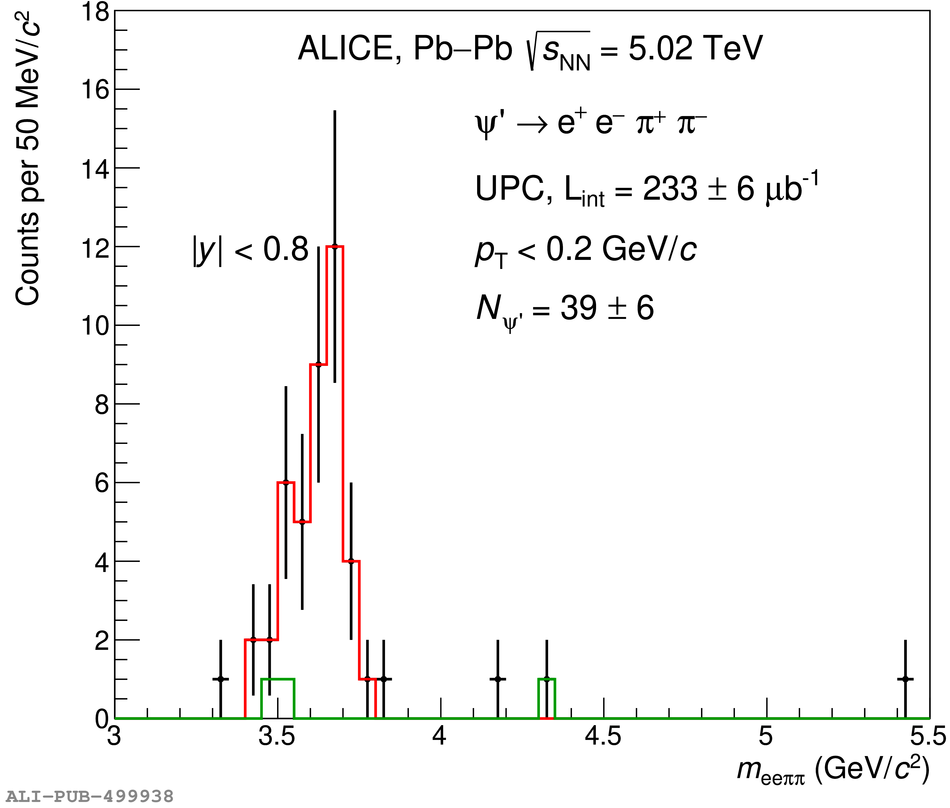 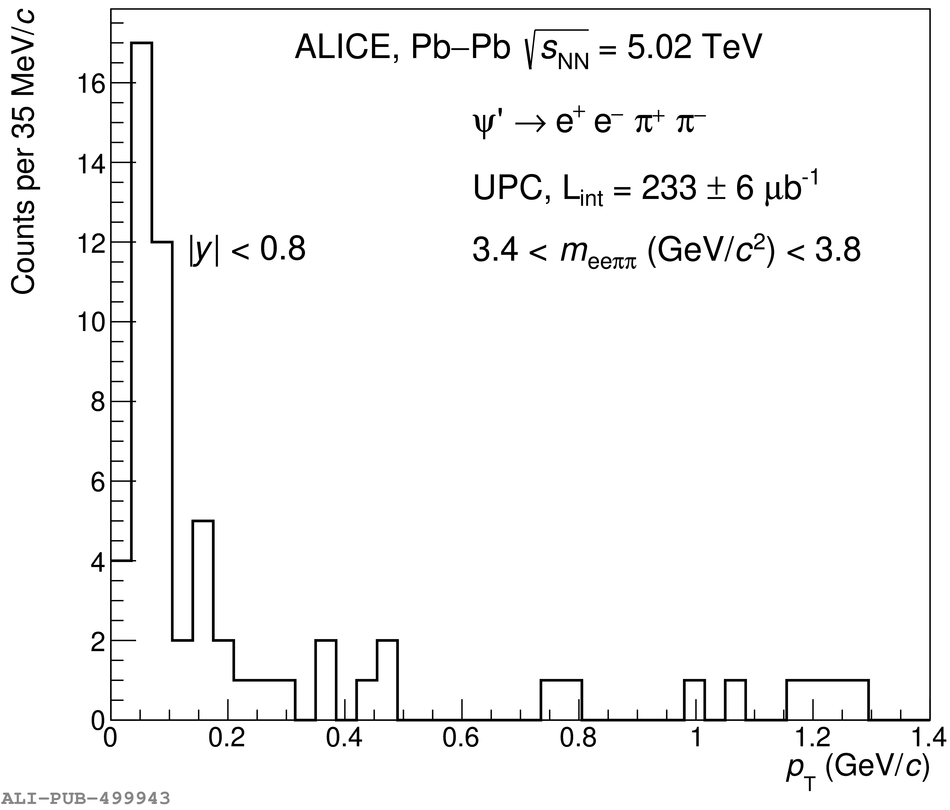 |


Figure 6
Measured differential cross section of the coherent \Jpsi\ (left) and \Ppsi\ (right) photoproduction in \PbPb UPC events. The error bars (boxes) show the statistical (systematic) uncertainties. The theoretical calculations are also shown. The green band represents the uncertainties of the EPS09 LO calculation. | 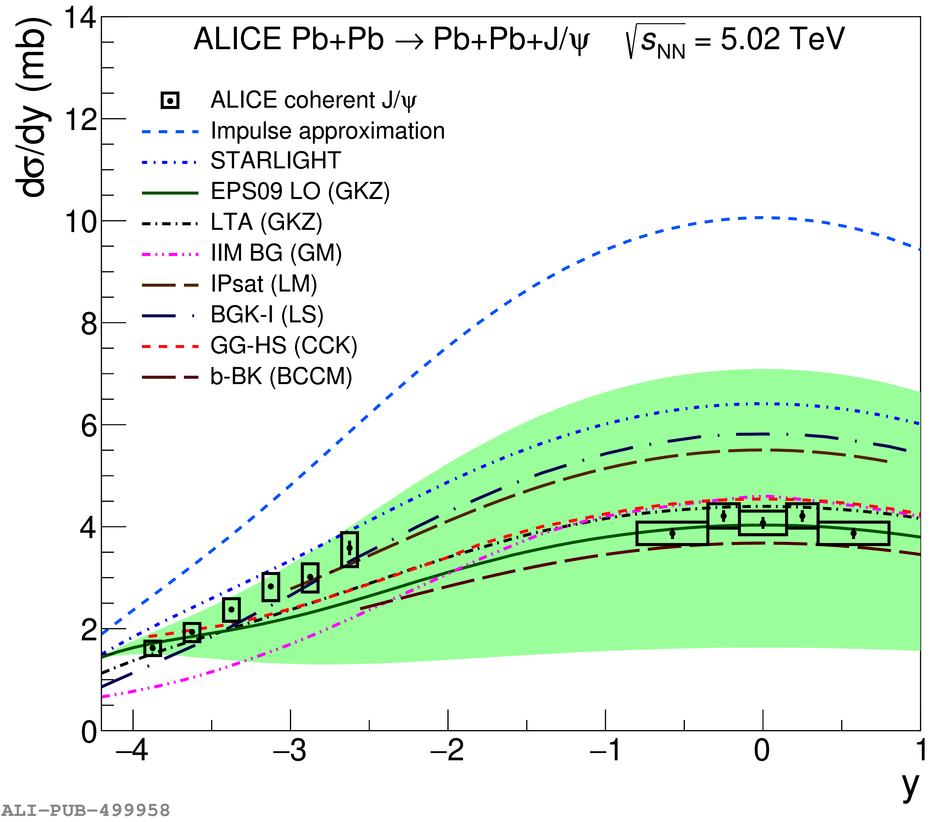 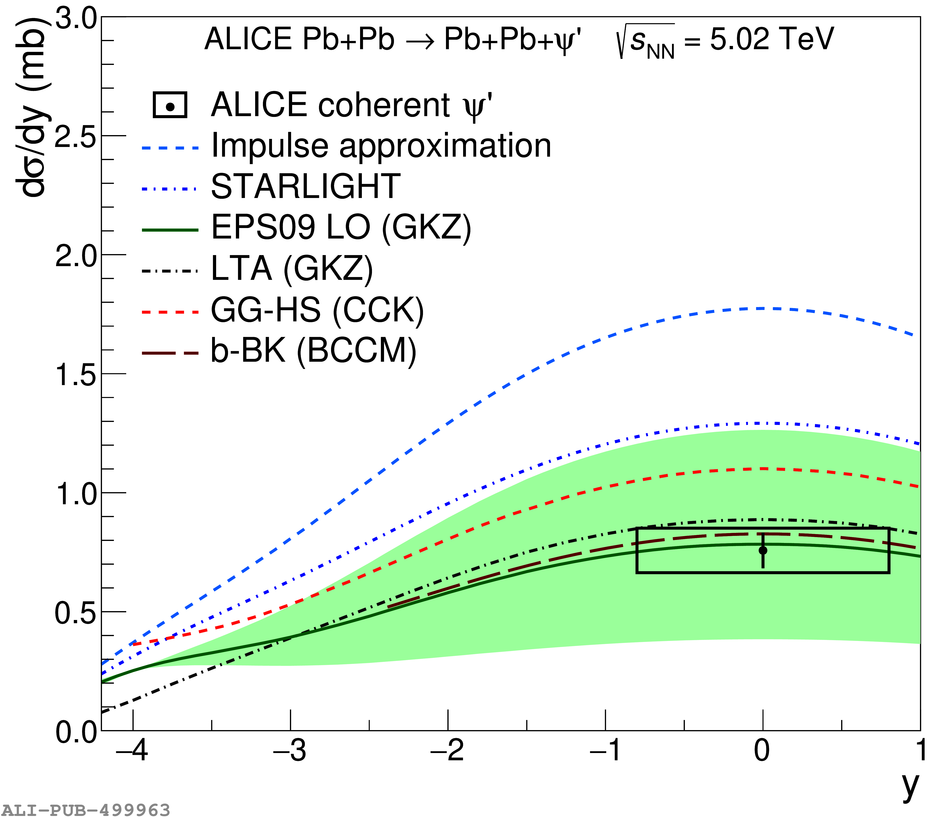 |