The production cross section of prompt $\mathrm{\Lambda_{c}^{+}}$ charm baryons was measured with the ALICE detector at the LHC at midrapidity in proton-proton (pp) and proton-lead (p-Pb) collisions at a centre-of-mass energy per nucleon pair of $\sqrt{s_\mathrm{NN}} = 5.02$ TeV. The $\mathrm{\Lambda_{c}^{+}}$ and $\rm {\overline{\Lambda}{}_c^-}$ baryons were reconstructed in the hadronic decay channels $\rm \Lambda_{c}^{+} \rightarrow p K^{-}\pi^{+}$ and $\rm \Lambda_{c}^{+}\to p K^{0}_{S}$ and respective charge conjugates. The measured differential cross sections as a function of transverse momentum ($p_{\rm T}$) and the $p_{\rm T}$-integrated $\mathrm{\Lambda_{c}^{+}}$ production cross section in pp and in p-Pb collisions are presented. The $\mathrm{\Lambda_{c}^{+}}$ nuclear modification factor ($R_\mathrm{pPb}$), calculated from the cross sections in pp and in p-Pb collisions, is presented and compared with the $R_\mathrm{pPb}$ of D mesons. The $\mathrm {\Lambda_{c}^{+}}/\mathrm {D^0}$ ratio is also presented and compared with the light-flavour baryon-to-meson ratios p$/\pi$ and $\Lambda /\mathrm {K^0_S}$, and measurements from other LHC experiments. The results are compared to predictions from model calculations and Monte Carlo event generators.
Phys. Rev. C 104 (2021) 054905
HEP Data
e-Print: arXiv:2011.06079 | PDF | inSPIRE
CERN-EP-2020-218
Figure group

Figure 2
Product of detector acceptance and efficiency for \Lc baryons in pp collisions at $\sqrt{s}=5.02 \TeV$, as a function of \pt. From left to right: \LctopKpi and \LctopKzS. The solid lines correspond to the $(A\times\varepsilon)$ for prompt \Lc, while the dotted lines represent $(A \times \epsilon)$ for \Lc baryons originating from beauty-hadron decays. The statistical uncertainties are smaller than the marker size. |  |
Figure 3
Product of detector acceptance and efficiency for \Lc baryons in \pPb collisions at \sqrtsNNfive, as a function of \pt. From left to right: \LctopKpi and \LctopKzS. The solid lines correspond to the $(A\times\varepsilon)$ for prompt \Lc, while the dotted lines represent $(A \times \epsilon)$ for \Lc baryons originating from beauty-hadron decays. The statistical uncertainties are smaller than the marker size. | 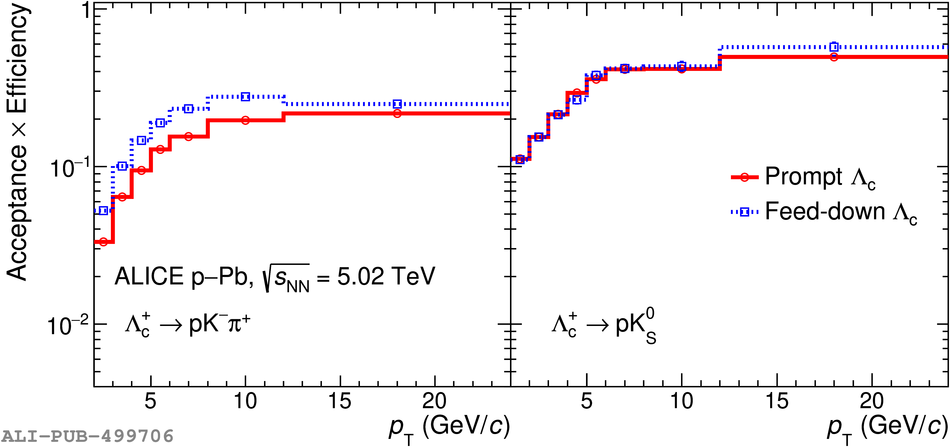 |


Figure 6
Comparison between the \pt-differential production cross section of prompt \Lcplus baryons in \pp collisions at $\sqrt{s}=7 \tev$ and \sqrtsfive. The ratio between the cross sections is shown in the lower panel The statistical uncertainties are shown as vertical bars and the systematic uncertainties are shown as boxes. | 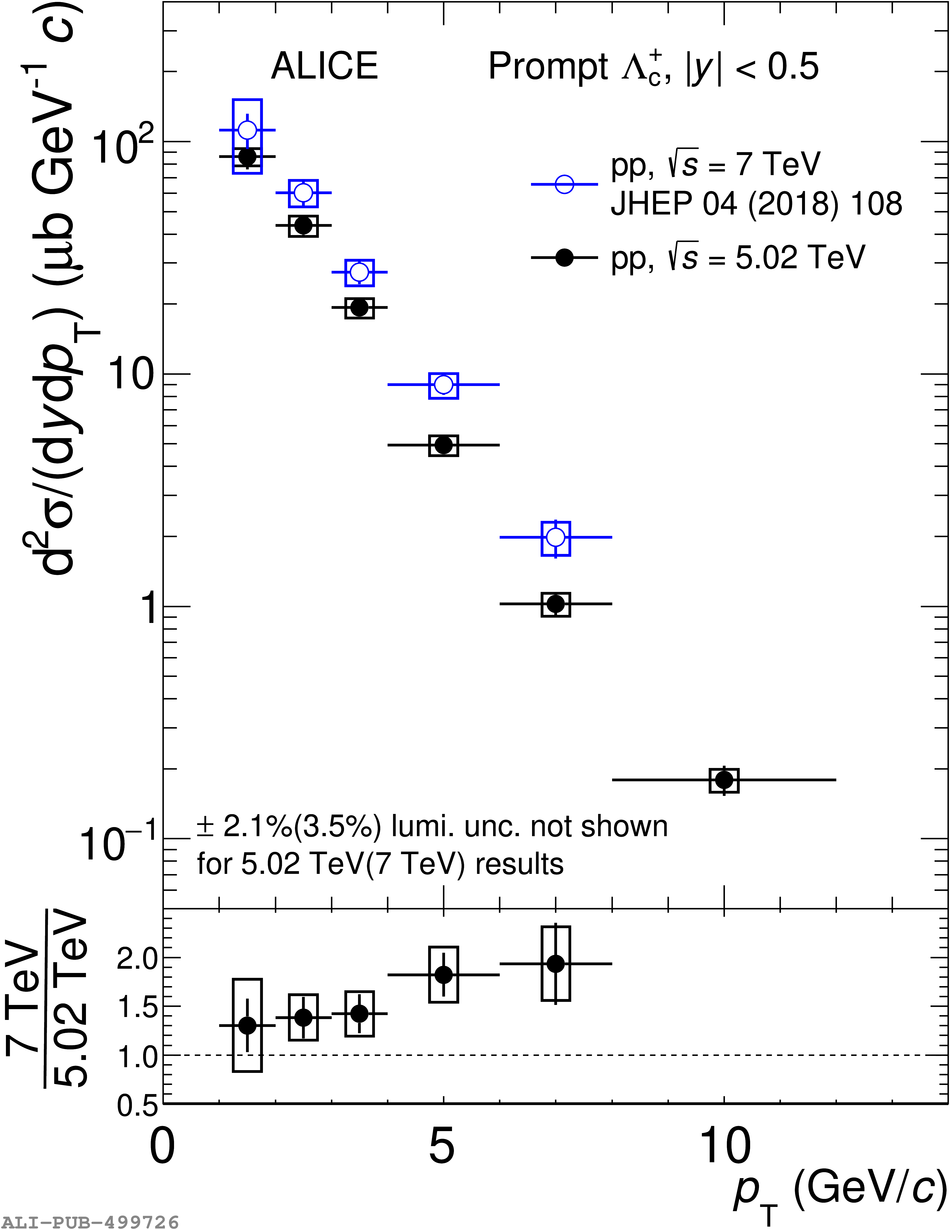 |

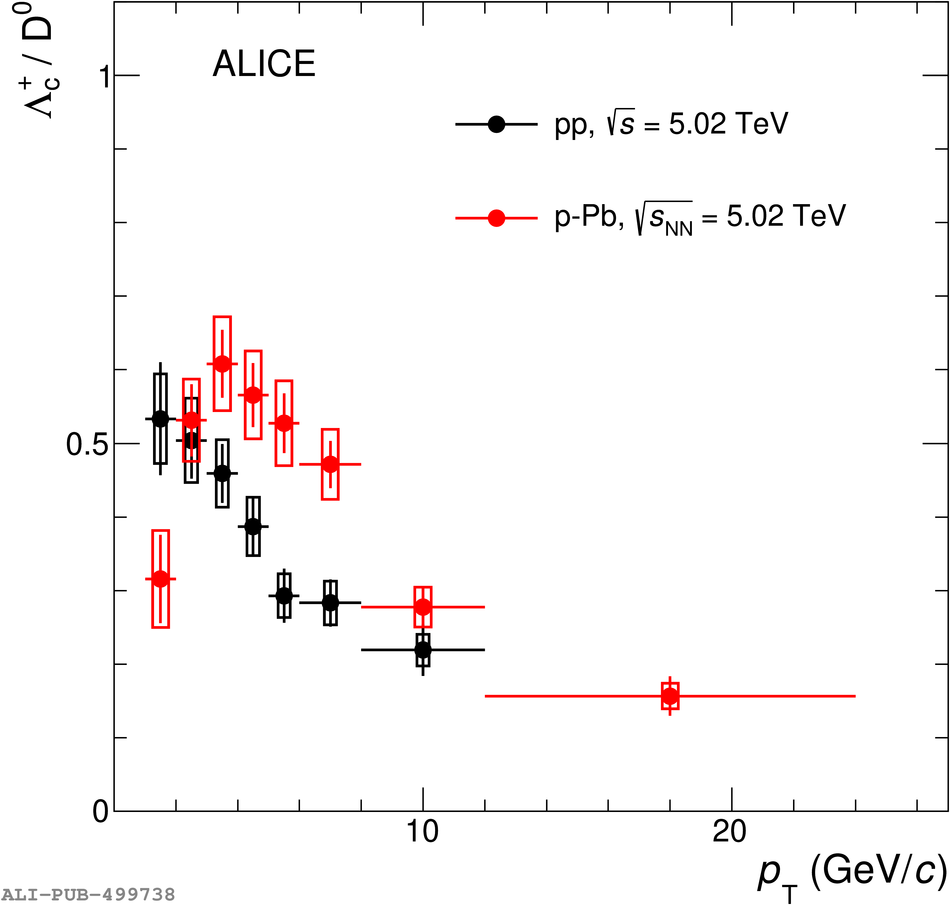
Figure 10
The \LcD ratio measured in pp collisions at \sqrtsfive, compared to theoretical predictions. The measurement is compared with predictions from MC generators (PYTHIA 8 , HERWIG 7 , POWHEG ), GM-VFNS , a statistical hadronisation model (`SH model' in the legend) and a model which implements hadronisation via coalescence and fragmentation . See text for model details. | 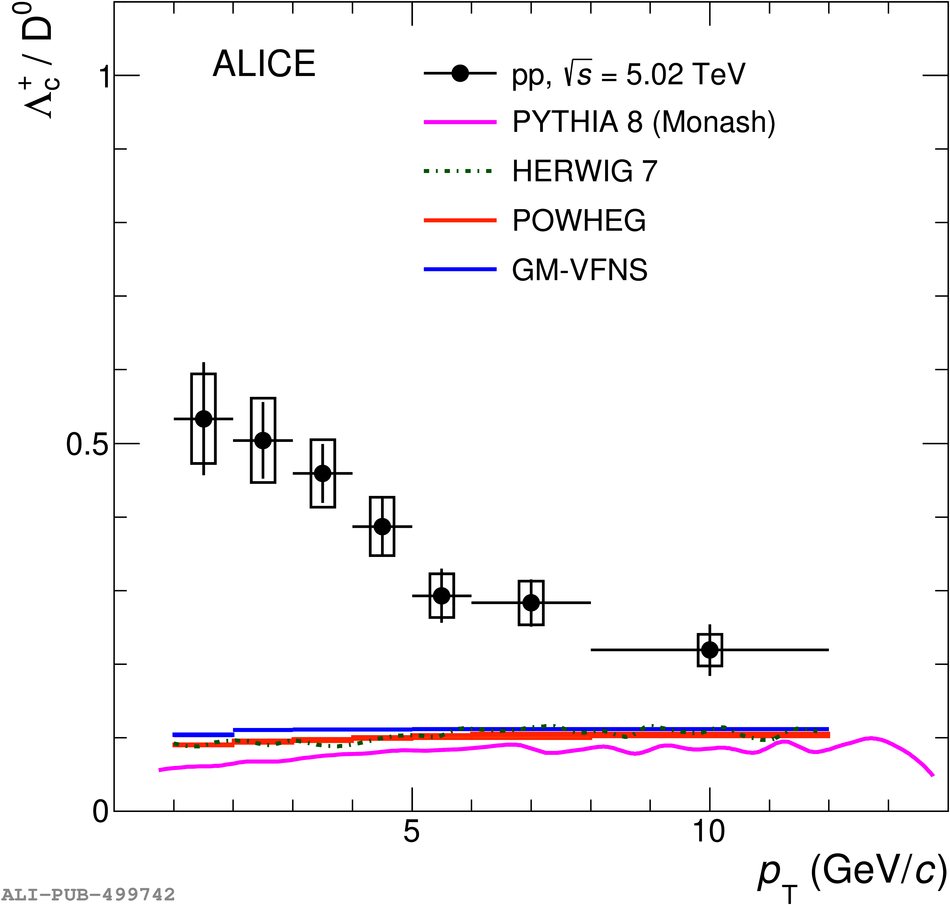 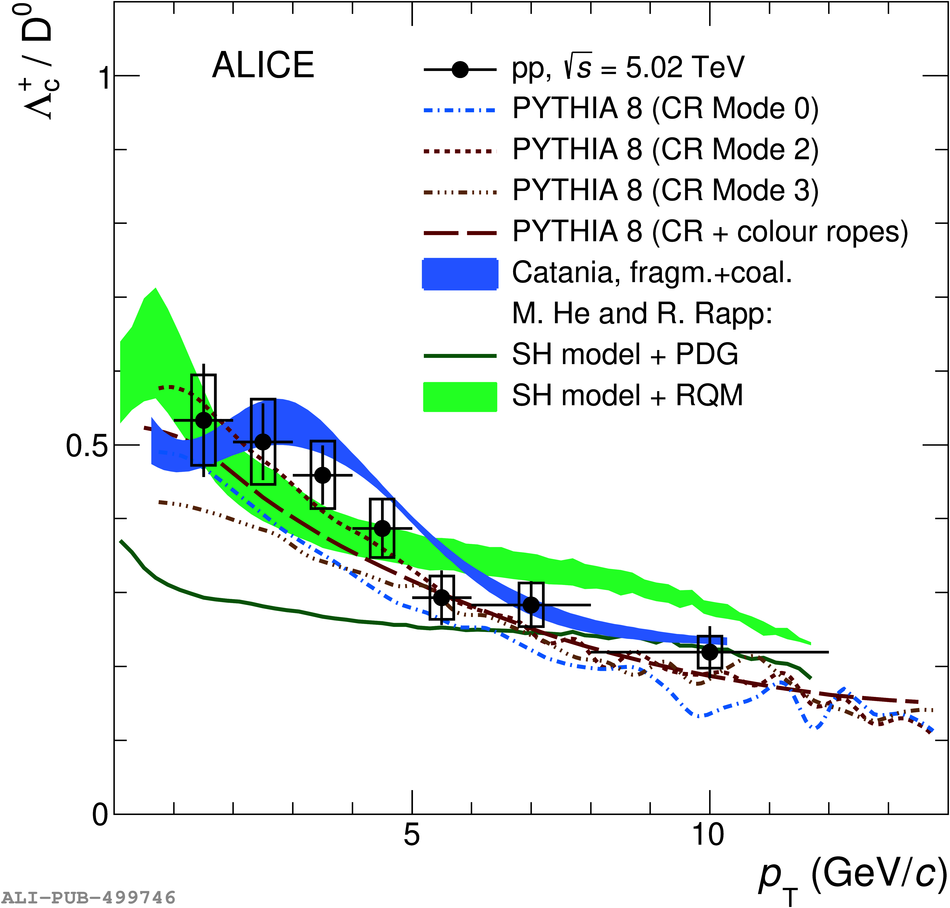 |
Figure 11
Left: The \LcD ratio measured in pp collisions at \sqrtsfive, compared to the measurement at \sqrtsseven . PYTHIA 8 predictions are shown at both energies, for the Monash tune (solid lines) and with the Mode 2 CR tune (dotted lines). Right: the \LcD ratio at \sqrtsfive compared with the measurement by the CMS Collaboration at $|y| | 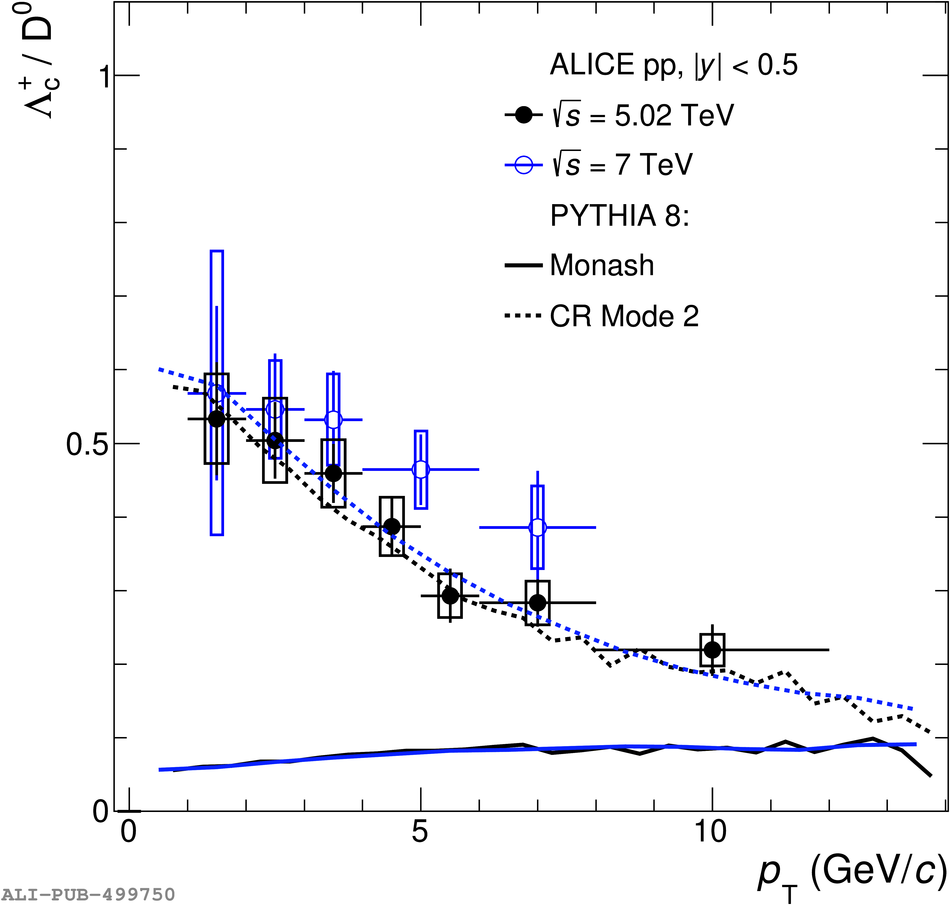 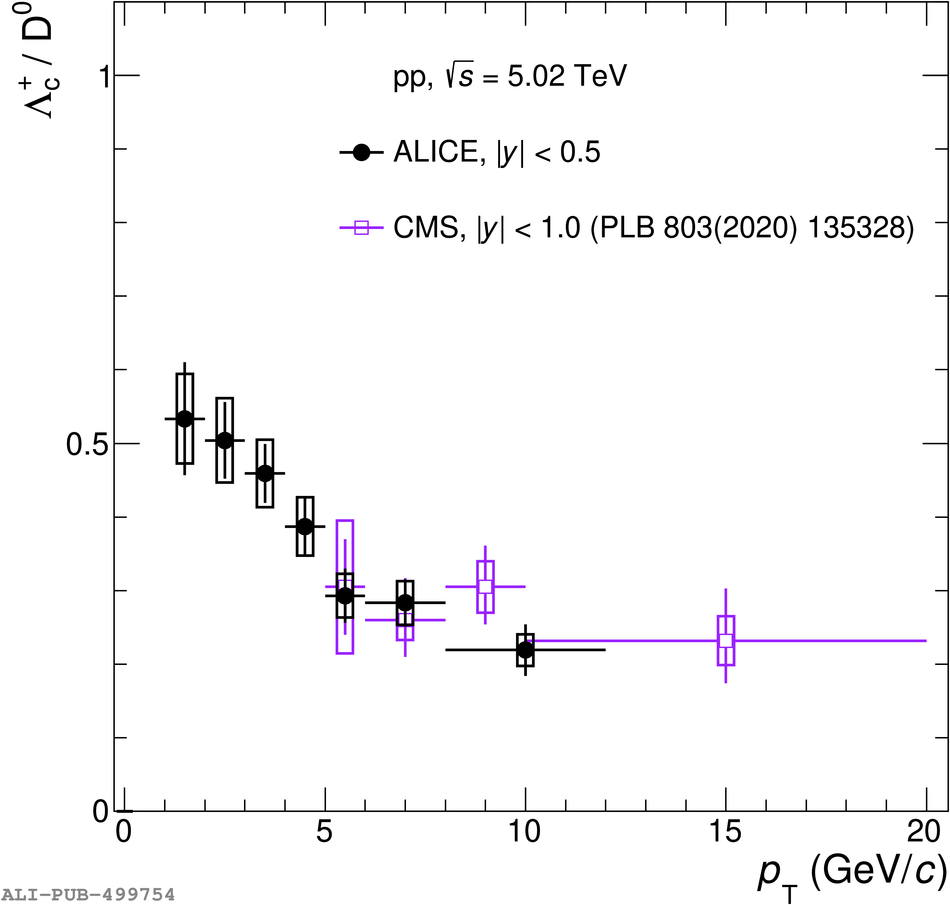 |
Figure 13
The baryon-to-meson ratios in the light-flavour and charm sector; p/$\pi$ in pp collisions at $\sqrts = 5.02 \tev$ and $7 \tev$ and \pPb collisions at $\sqrtsNN = 5.02 \tev$ (left), $\Lambda/\Kzs$ in pp collisions at $\sqrts = 7 \tev$ and \pPb collisions at $\sqrtsNN = 5.02 \tev$ (middle), and \LcD in \pp collisions at $\sqrts = 5.02 \tev$ and \pPb collisions at $\sqrtsNN = 5.02 \tev$ (right). The data are compared to predictions from PYTHIA 8 . See text for model details. | 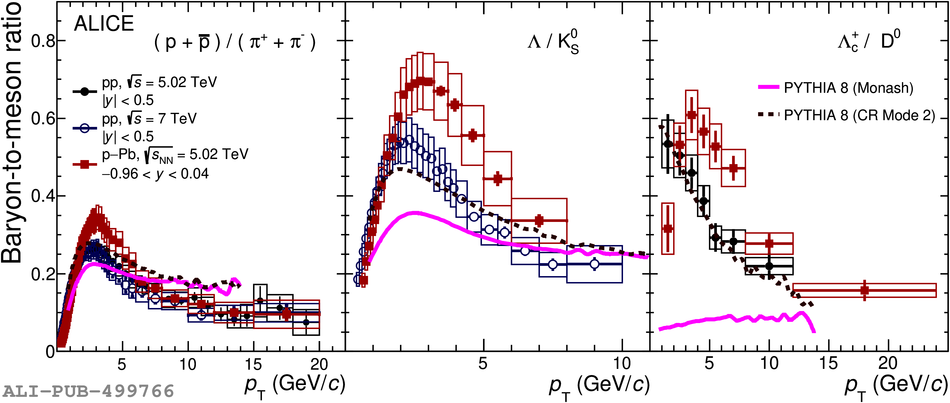 |