Deuteron production in high-energy collisions is sensitive to the space-time evolution of the collision system, and is typically described by a coalescence mechanism. For the first time, we present results on jet-associated deuteron production in \pp\ collisions at $\sqrt{s}=13$ TeV, providing an opportunity to test the established picture for deuteron production in events with a hard scattering. Using a trigger particle with high transverse-momentum ($p_{\rm T}>5$ GeV/$c$) as a proxy for the presence of a jet at midrapidity, we observe a measurable population of deuterons being produced around the jet proxy. The associated deuteron yield measured in a narrow angular range around the trigger particle differs by 2.4-4.8 standard deviations from the uncorrelated background. The data are described by PYTHIA model calculations featuring baryon coalescence.
Phys. Lett. B 819 (2021) 136440
HEP Data
e-Print: arXiv:2011.05898 | PDF | inSPIRE
CERN-EP-2020-210
Figure group
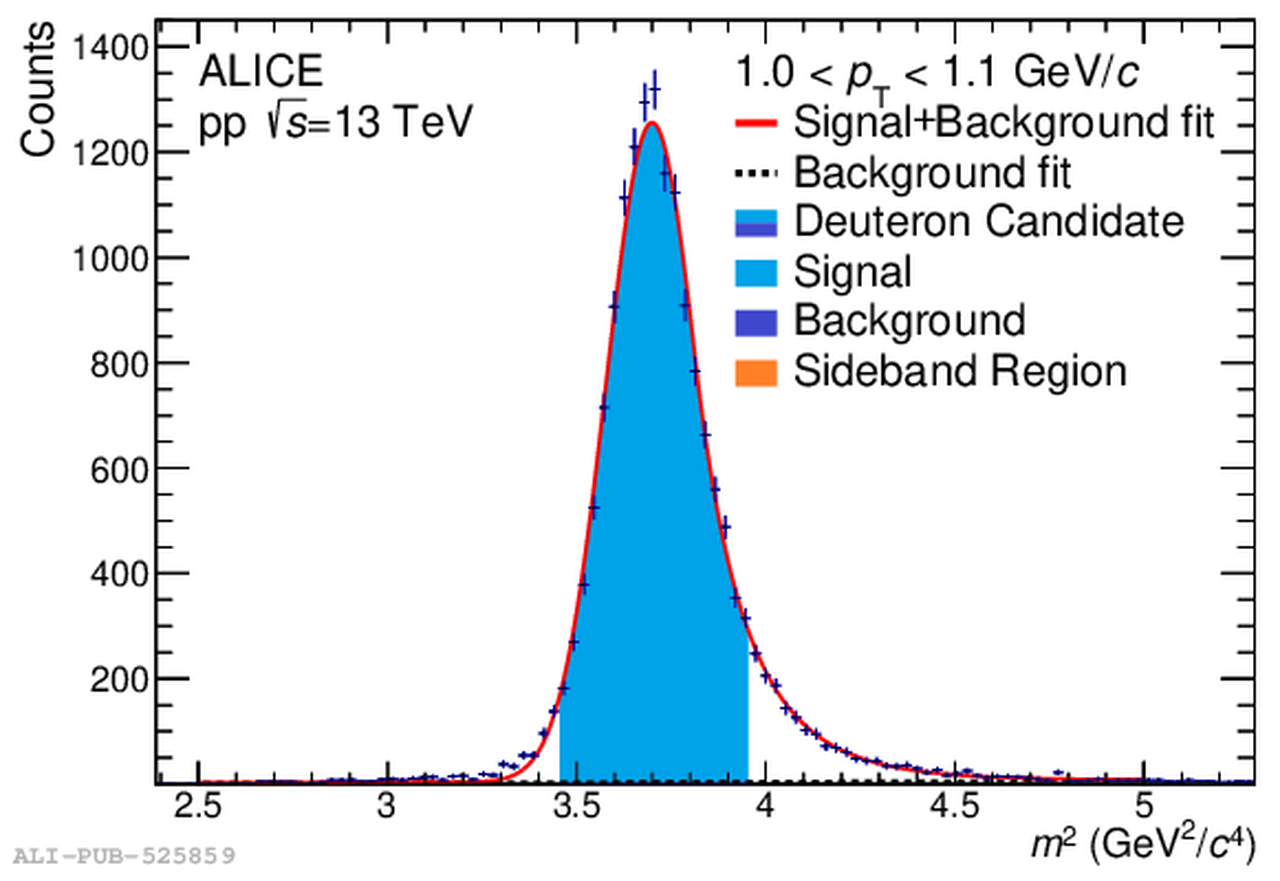
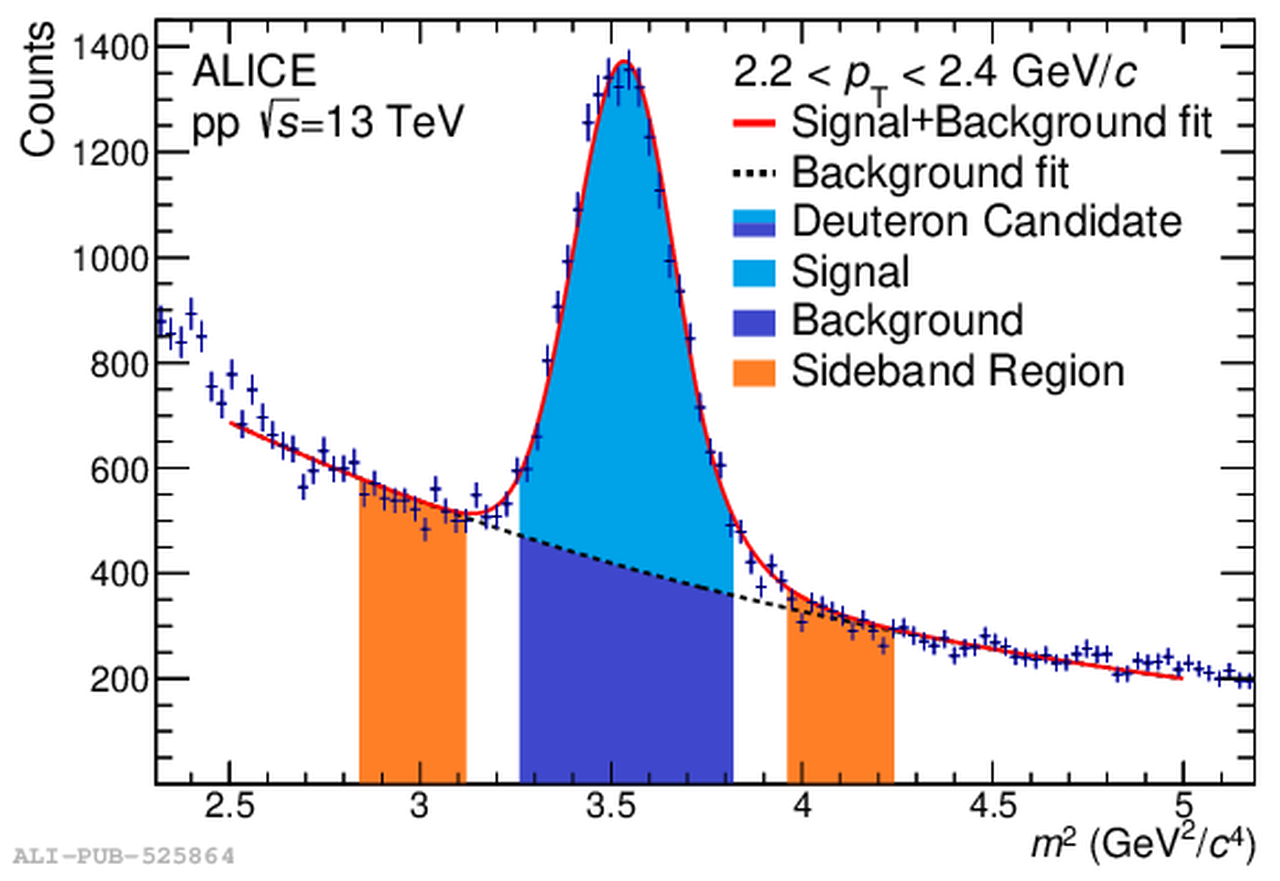
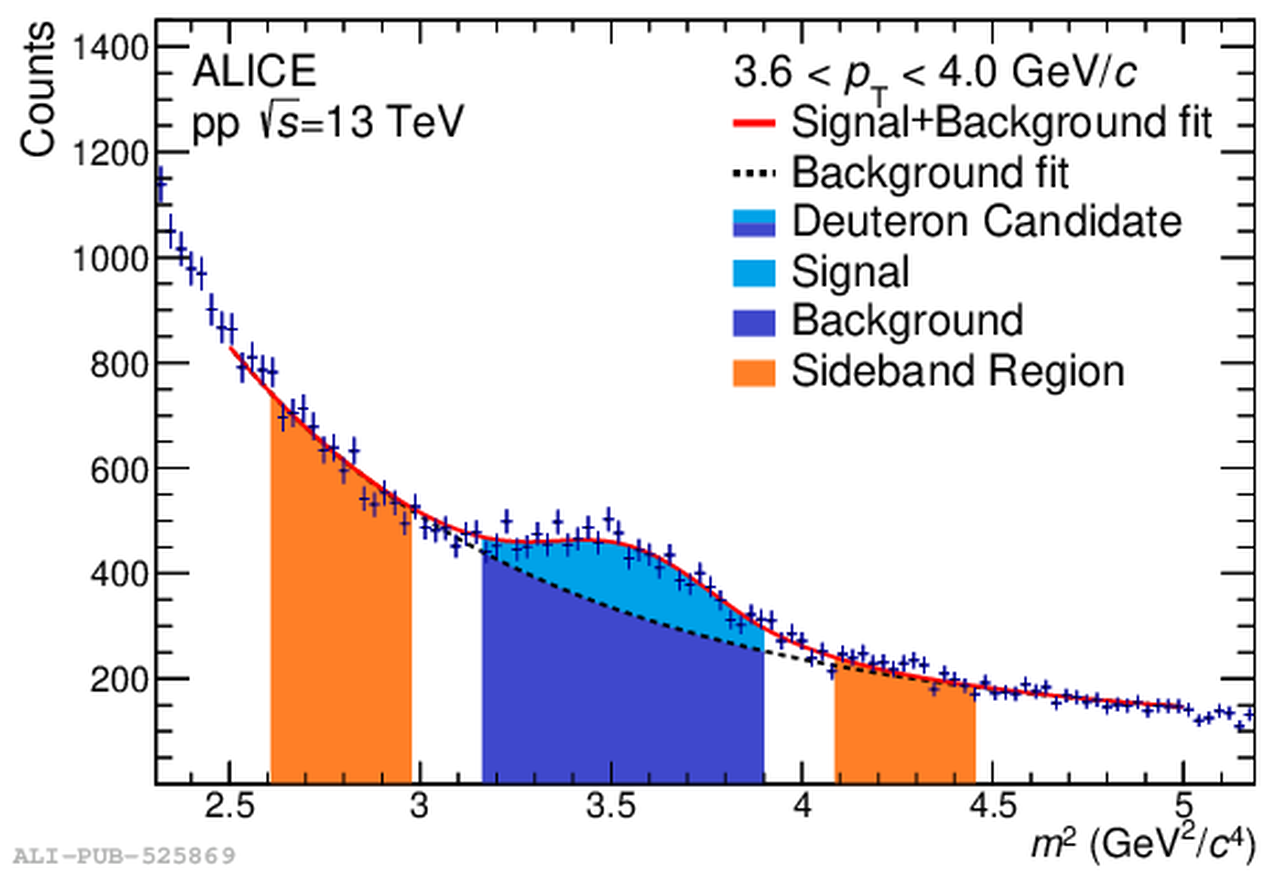
Figure 2
The per-trigger associated yield versus $\Delta\varphi$ for charged particles with $\pt>5.0$ GeV/$c$ and associate deuterons and anti-deuterons for different associate \pt intervals: 1.0--1.35, 1.35--1.8, 1.8--2.4, 2.4--3.0, and 3.0--4.0 GeV/$c$\com{ (ordered left to right, then down)}. The markers represent the data points with statistical uncertainties, while the boxes represent the systematic uncertainties associated with tracking, purity, and sideband selection. The dotted line shows the ZYAM background estimate and the blue band is the uncertainty associated with the ZYAM estimate. Histogram lines are PYTHIA 8.2 (Monash) model calculations with a coalescence afterburner with $p_0=110$ MeV/$c$ The calculation was scaled by $0.5$ and $0.75$ in the first two intervals, required to approximately describe the measured deuteron spectrum at 13 TeV, as explained in the text.. | 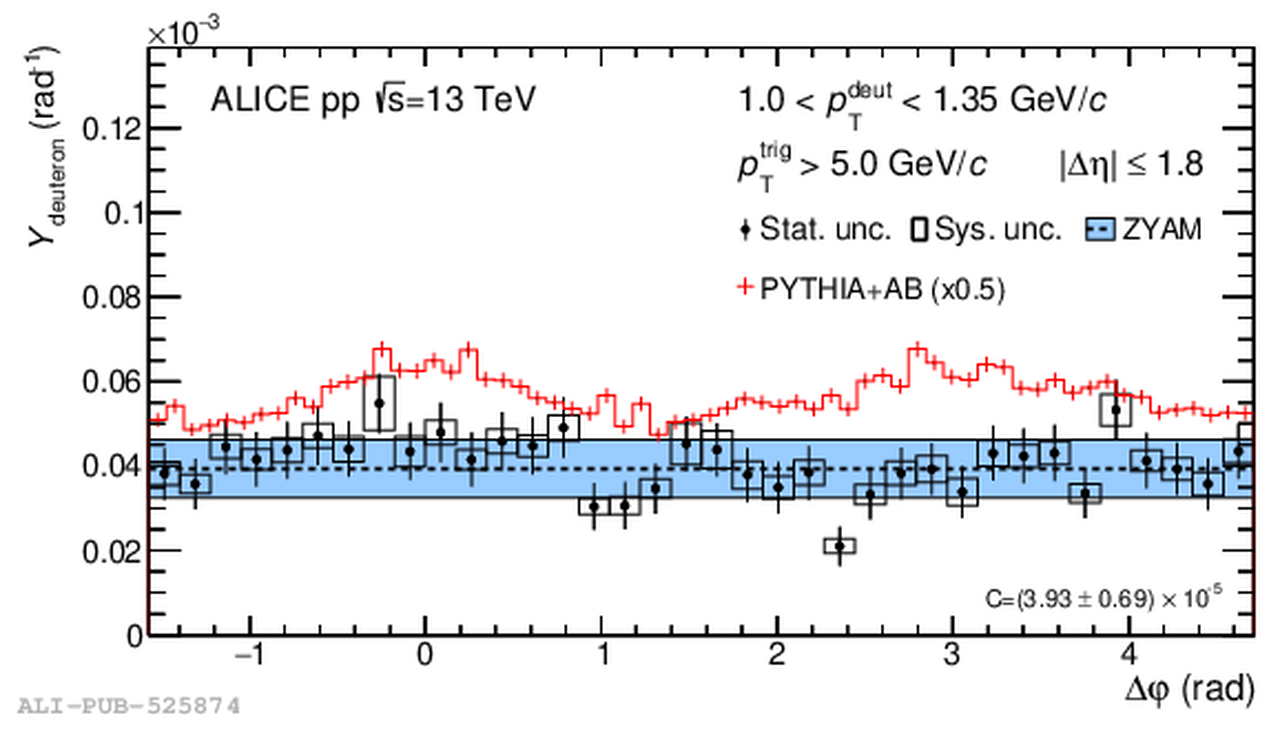 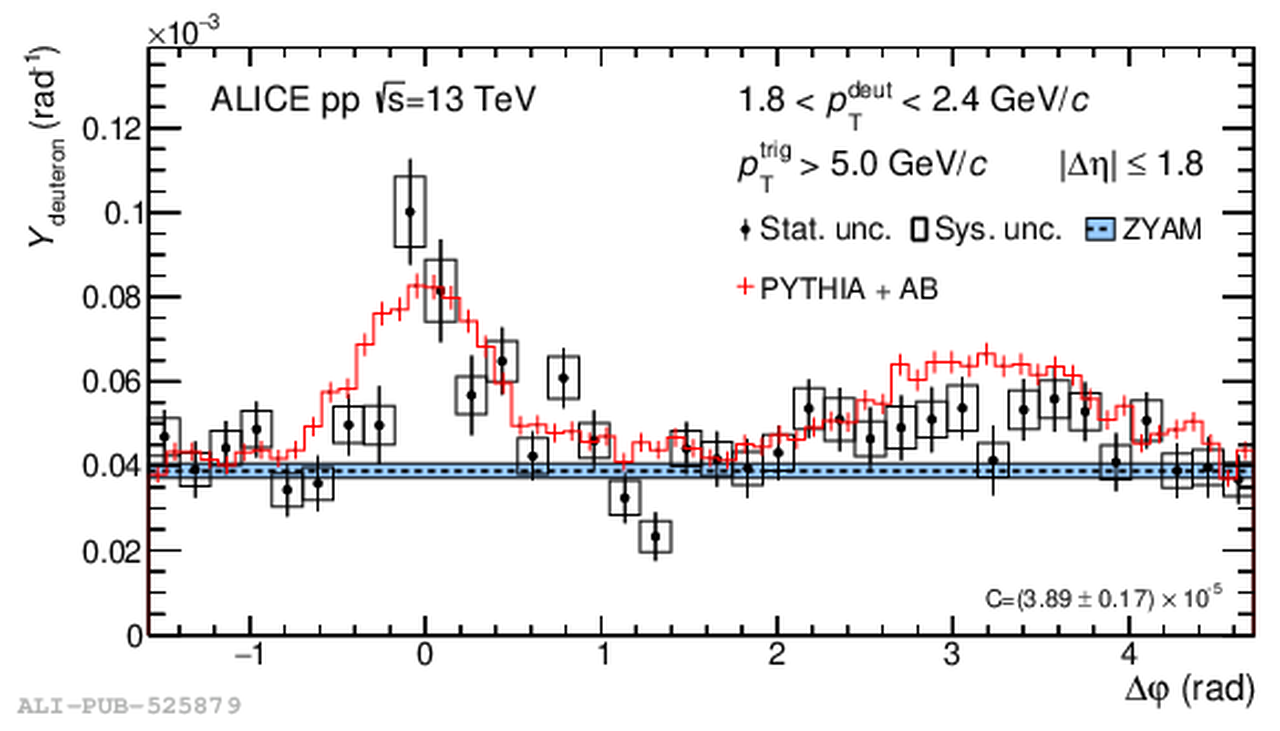 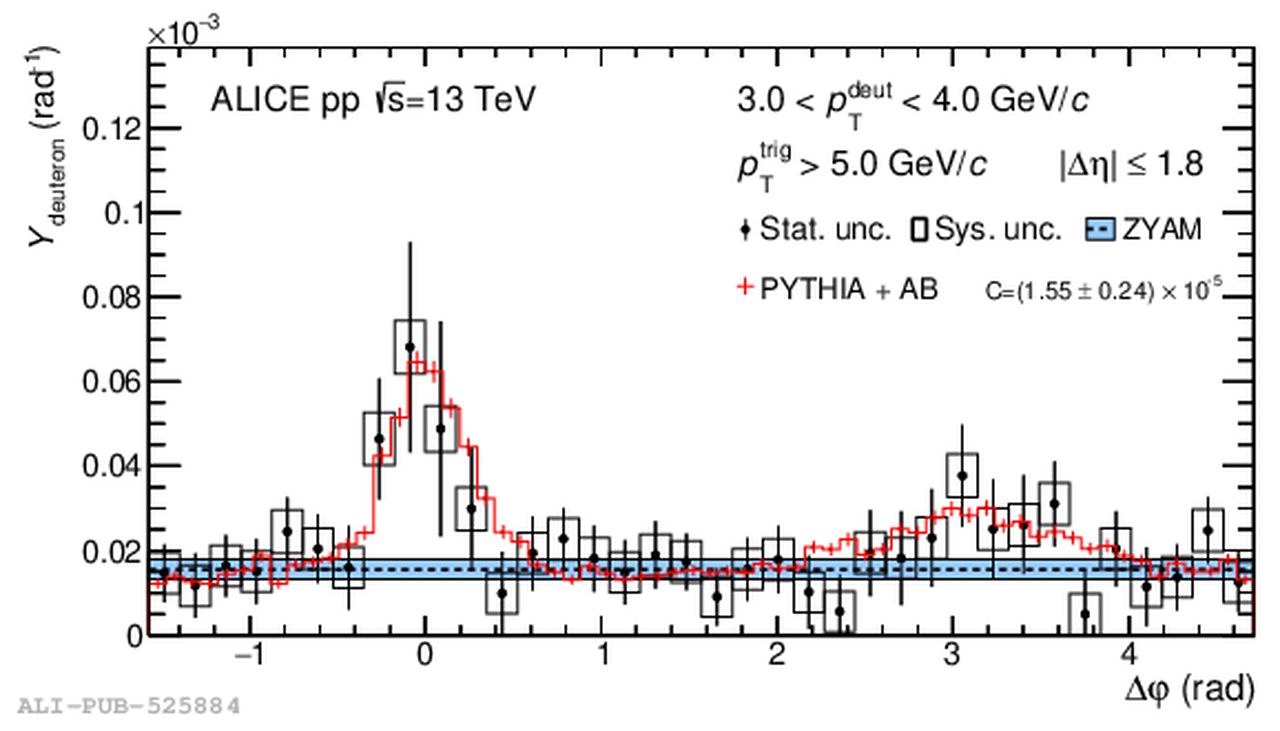 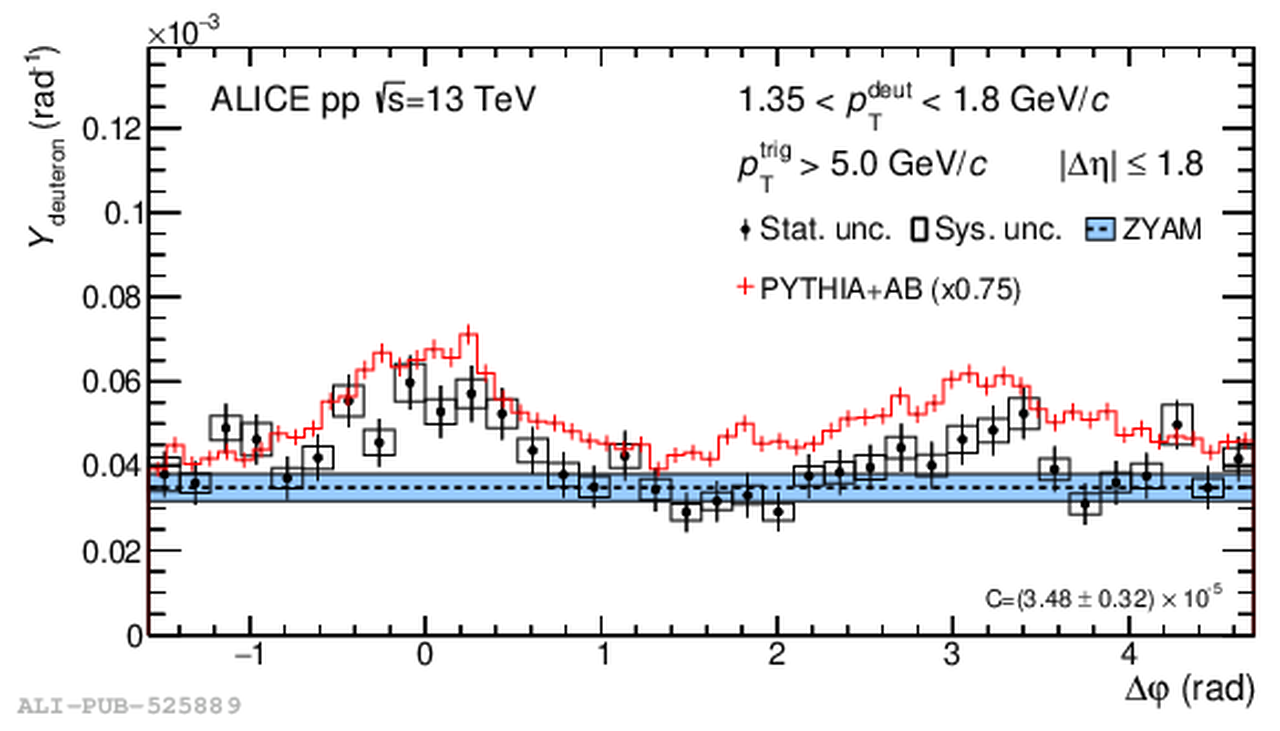 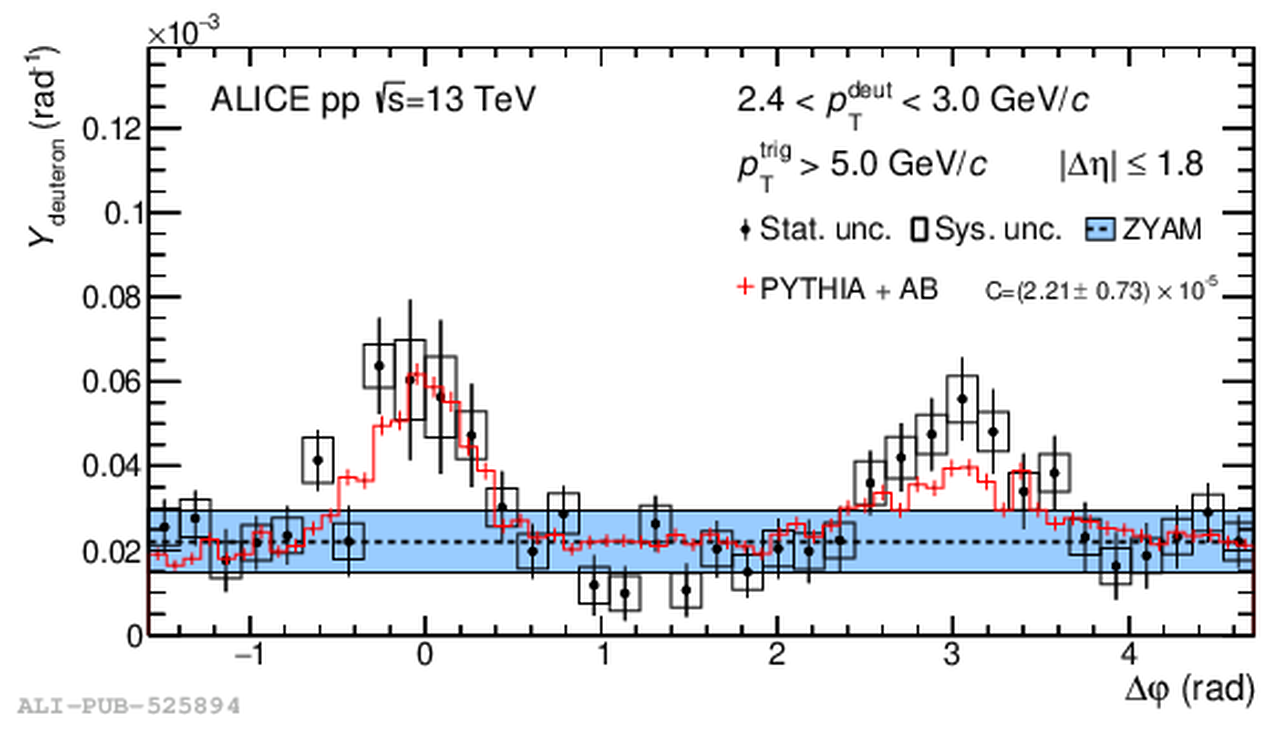 |
Figure 3
The per-trigger associated-deuteron integrated yield for trigger particles above $5$ GeV/$c$ on the near side versus \pt\ of the associated deuterons and anti-deuterons Vertical bars show statistical uncertainties, open boxes systematic uncertainties, and shaded (blue) boxes show the uncertainty related to the subtraction of the uncorrelated background using the ZYAM method Square markers are calculations using PYTHIA 8.2 (Monash) with a coalescence afterburner, displaced by 30 MeV/$c$ for better visibility.. | 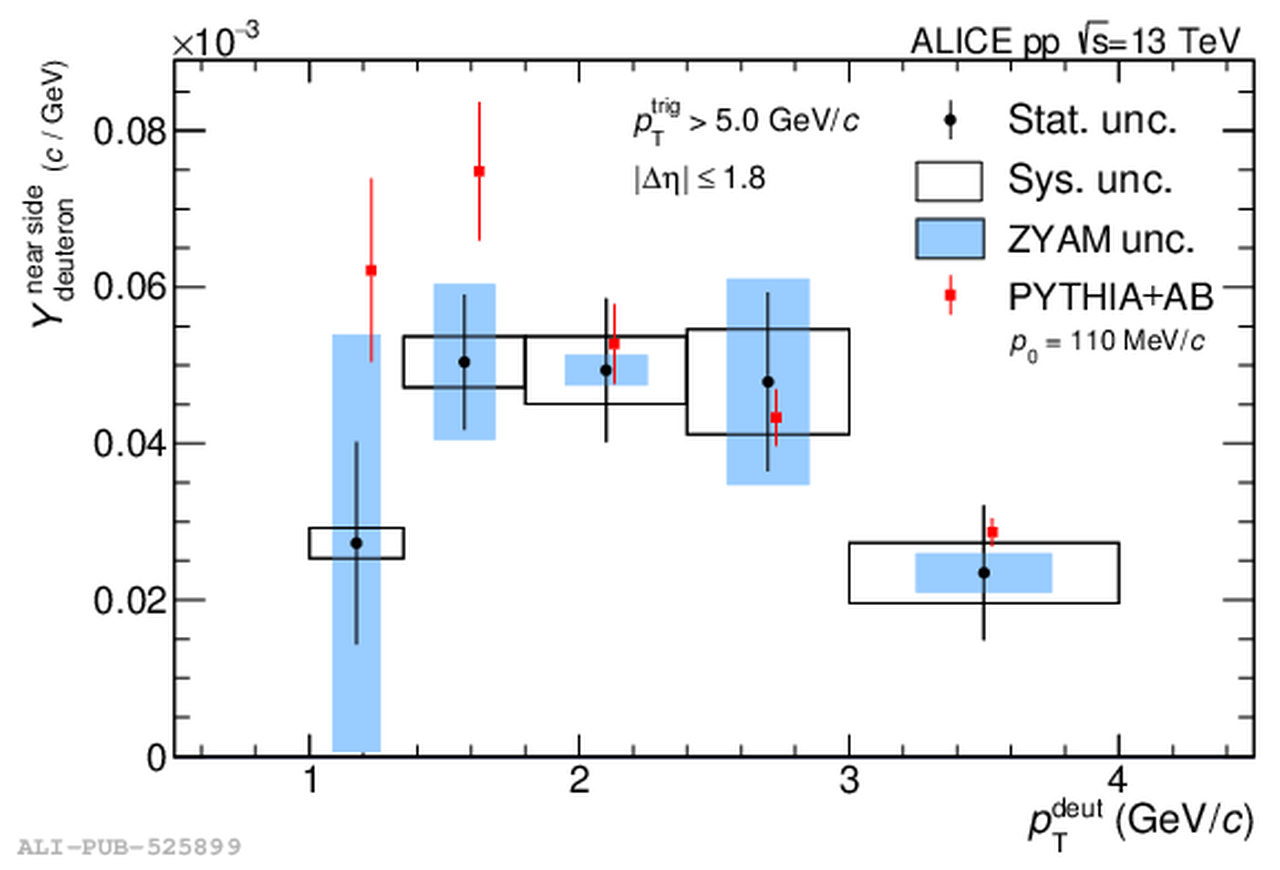 |