The invariant differential cross section of inclusive $\omega(782)$ meson production at midrapidity ($|y|<~0.5$) in pp collisions at $\sqrt{s}$ = 7 TeV was measured with the ALICE detector at the LHC over a transverse momentum range of 2 <~ $p_{\rm{T}}$ <~ 17 GeV/$c$. The $\omega$ meson was reconstructed via its $\omega\rightarrow\pi^+\pi^-\pi^0$ decay channel. The measured $\omega$ production cross section is compared to various calculations: PYTHIA 8.2 Monash 2013 describes the data, while PYTHIA 8.2 Tune 4C overestimates the data by about 50%. A recent NLO calculation, which includes a model describing the fragmentation of the whole vector-meson nonet, describes the data within uncertainties below 6 GeV/$c$, while it overestimates the data by up to 50% for higher $p_{\rm{T}}$. The $\omega/\pi^0$ ratio is in agreement with previous measurements at lower collision energies and the PYTHIA calculations. In addition, the measurement is compatible with transverse mass scaling within the measured $p_{\rm{T}}$ range and the ratio is constant with $C^{\omega/\pi^{0}}$ = 0.67 $\pm$ 0.03 (stat) $\pm$ 0.04 (sys) above a transverse momentum of 2.5 GeV/$c$.
Eur. Phys. J. C 80 (2020) 1130
HEP Data
e-Print: arXiv:2007.02208 | PDF | inSPIRE
CERN-EP-2020-122
Figure group
Figure 1
Invariant mass of $\pi^+\pi^-\pi^0$ candidates shown in the vicinity of the nominal mass of the $\omega$ meson for indicated \pT-ranges for $\pi^0$ reconstruction with PCM (left), EMC (middle) and PHOS (right) The second order polynomial used for the background description is shown with a band denoting the statistical uncertainties of the fit The points show the signal obtained after subtraction of the background fit The signal is fitted with a Gaussian, where the vertical lines indicate the integration range used to obtain the raw yield by bin-by-bin counting, as outlined in \Sect{sec:meson}. | 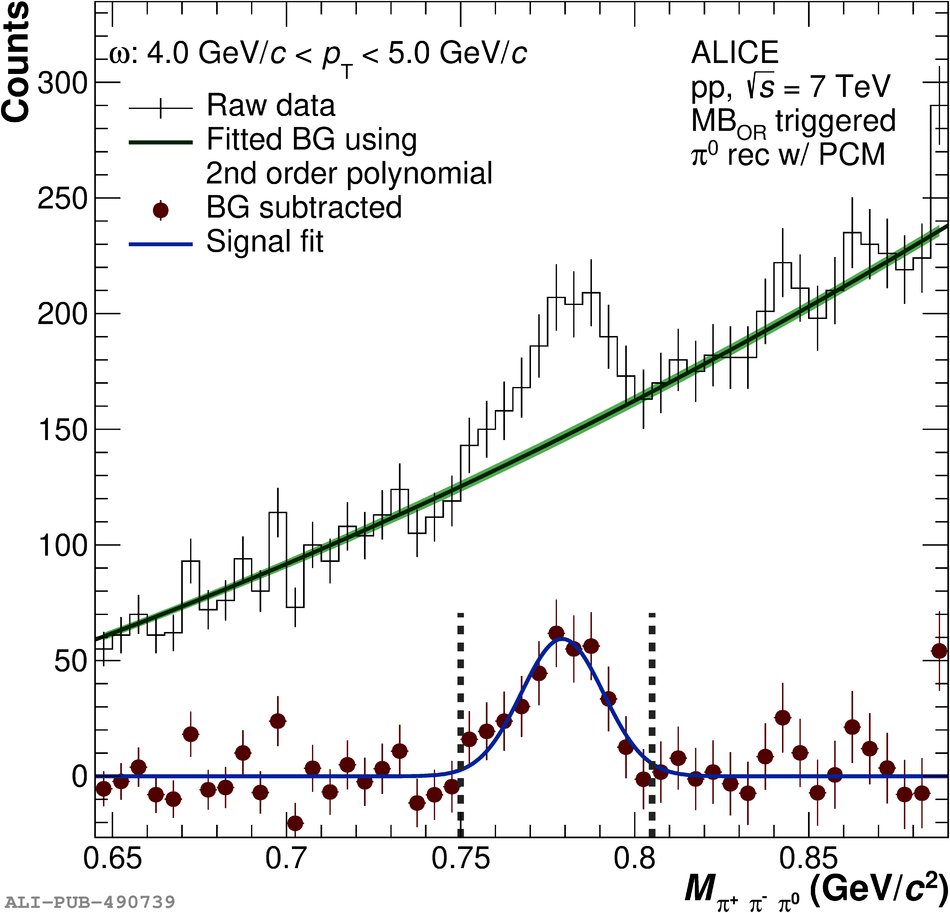 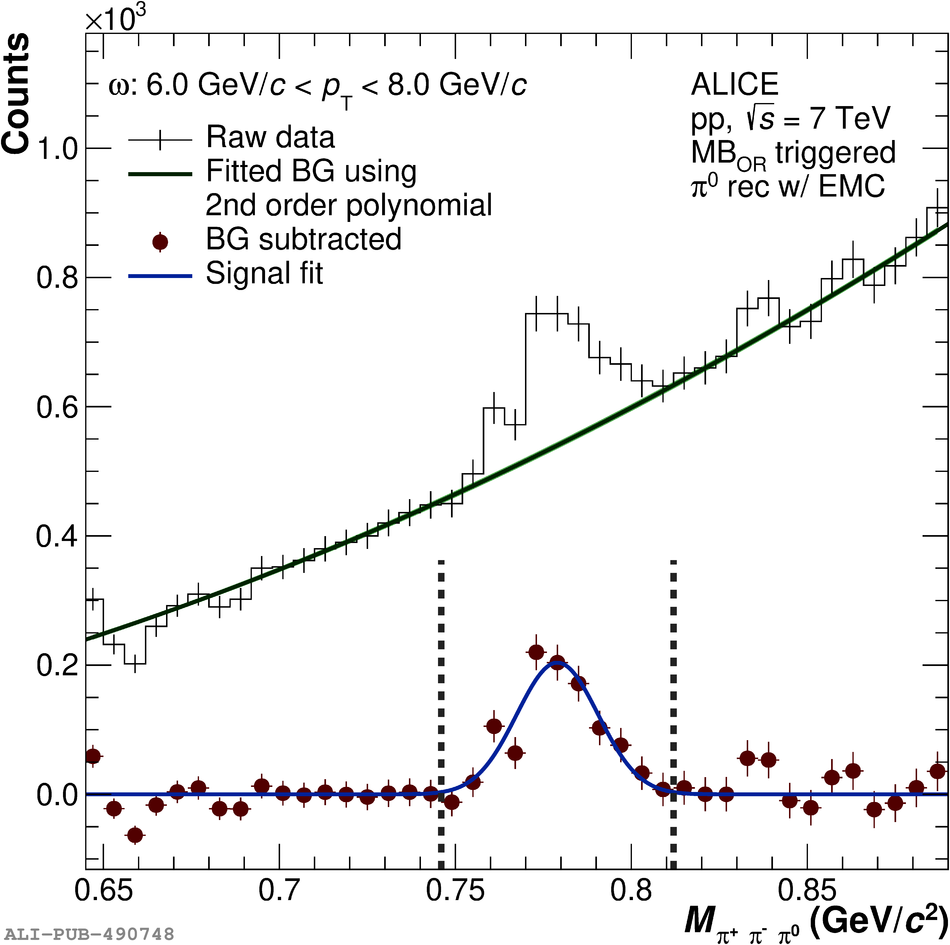  |
Figure 2
Correction factors applied to the raw $\omega$ yields for each indicated $\pi^0$ reconstruction method The factors include the geometrical acceptance $A$ and the reconstruction efficiency $\epsilon_{\text{rec.}}$. In addition, a normalisation to unit rapidity and $2\pi$ azimuth angle is applied to allow for a direct comparison between the different methods. | 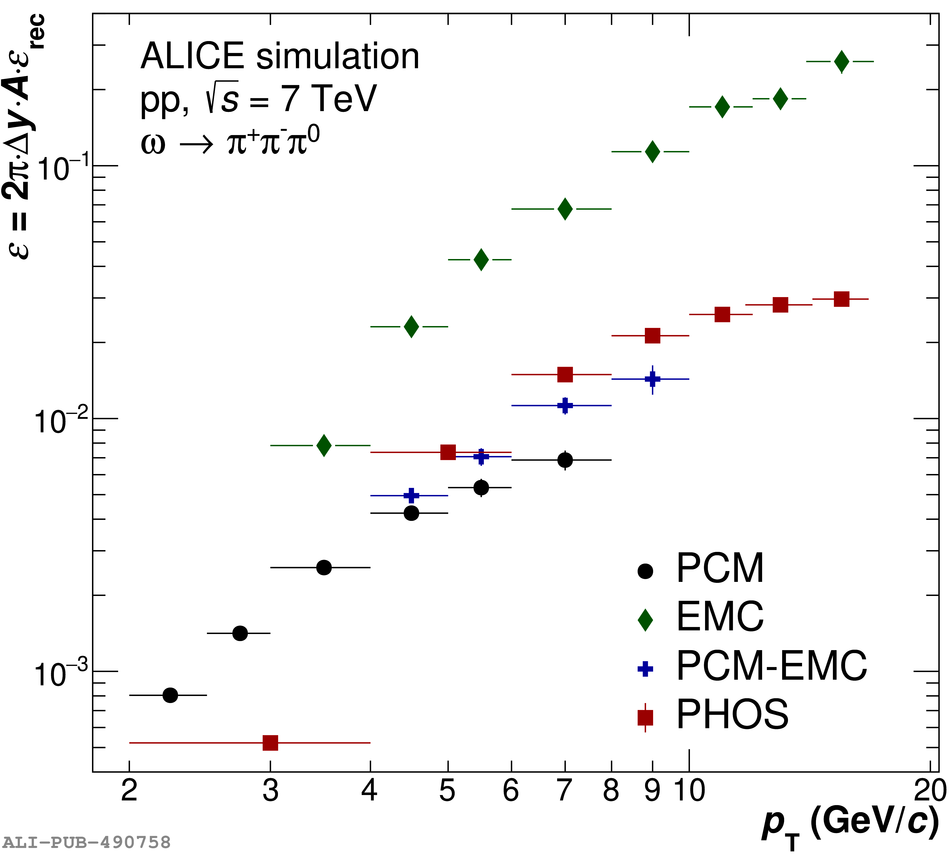 |
Figure 3
Invariant cross section of $\omega$ meson production in pp collisions at $\sqrt{s}=\SI{7}{TeV}$ compared to theoretical predictions The statistical and systematic uncertainties are represented by vertical bars and boxes, respectively A Levy-Tsallis function was used to parametrise the spectrum, where the obtained fit parameters are given in \Tab{tab:FitParam} The predictions are obtained using \Pythia 8.2 with the Monash 2013 and 4C tunes Furthermore, a NLO calculation incorporating a model dedicated to describe vector-meson fragmentation is shown, where the band denotes the uncertainty of the scale $\mu$, which was used for factorisation, renormalisation and fragmentation In the bottom panel, the ratios of the theoretical estimates to the Levy-Tsallis fit of the measurement are shown; the ratio of the data to the Levy-Tsallis fit is also presented |  |
Figure 4
Ratios of the fully corrected $\omega$ spectra obtained with the individual reconstruction methods to the Levy-Tsallis fit of the combined spectrum, where the fit parameters are shown in \Tab{tab:FitParam} The statistical and systematic uncertainties are represented by vertical bars and boxes, respectively. | 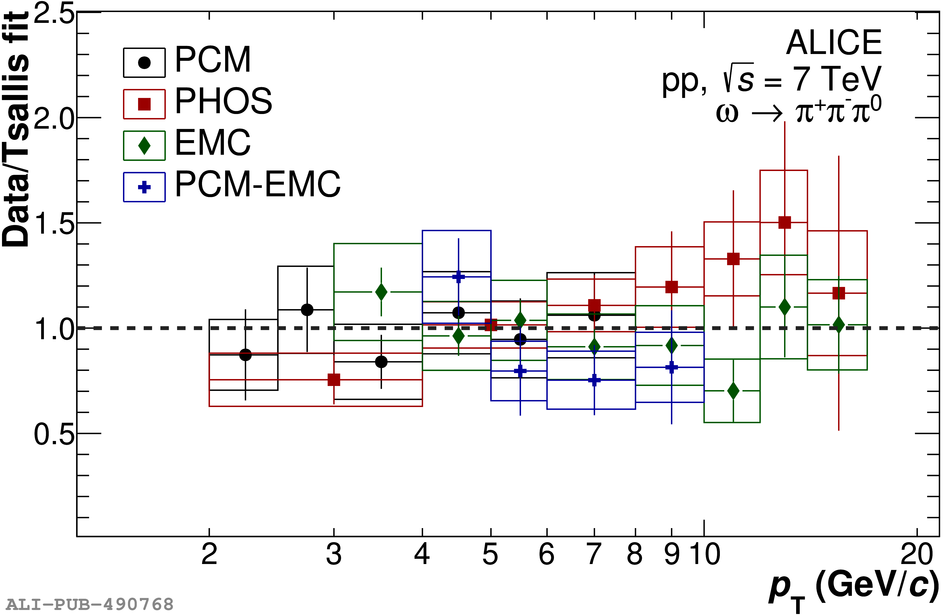 |
Figure 5
Ratio of $\omega/\pi^0$ production as a function of transverse momentum \pT for pp collisions at $\sqrt{s}=\SI{7}{TeV}$ (black) compared to various lower collision energies ranging from $\sqrt{s}=62-\SI{200}{GeV}$ (gray) In addition, \Pythia predictions at $\sqrt{s}=\SI{7}{TeV}$ and the $\omega/\pi^0$ ratio obtained from \mt-scaling are shown with lines. | 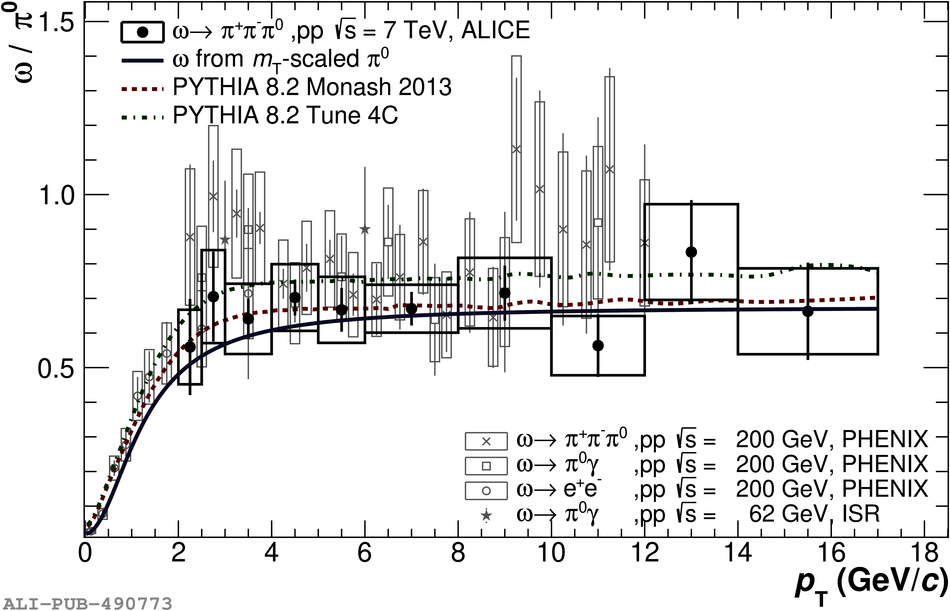 |