Number density Nch (left) and ∑ pT (right) distributions as a function of pTleading along with the MC simulations in Toward (top), Transverse (middle), and Away (bottom) regions for the threshold of pTtrack > 0.15 GeV/c. The shaded areas in the upper panels represent the systematic uncertainties and vertical error bars indicate statistical uncertainties for the data. In the lower panels, the shaded areas are the sum in quadrature of statistical and systematic uncertainties from upper panels. No uncertainties are shown for the MC simulations. | 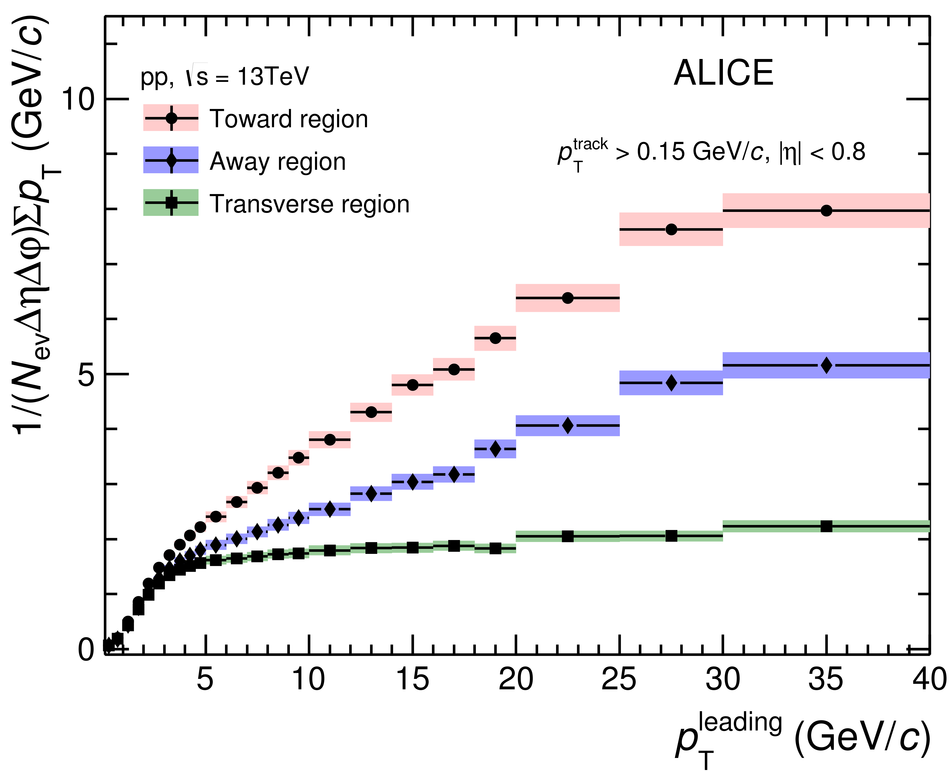 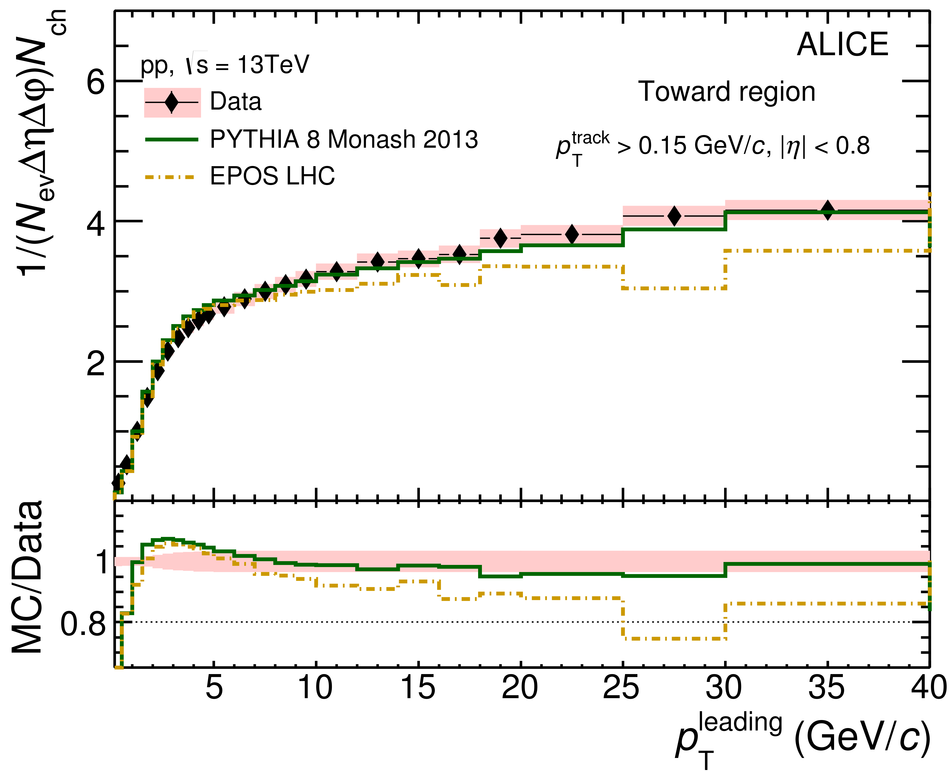 |