(Left) Inclusive \jpsi\ \meanpt\ measured in \PbPb\ collisions at \sqrtsnnE{5.02} and \sqrtsnnE{2.76}, as a function of \Npart\ for \pt\ $< $ 8 \gevc. The vertical error bars represent the statistical uncertainties, while the uncorrelated systematic uncertainties are shown as boxes around the points. \jpsi\ \meanpt\ results in \pp\ collisions at the two collision energies are also shown at \Npart = 2. (Right) Inclusive \jpsi\ \rAA\ in \PbPb\ collisions at \sqrtsnnE{5.02}, compared with the \sqrtsnnE{2.76} results and a transport model calculation , as a function of \Npart\ for \pt\ $< $ 8 \gevc. The vertical error bars represent the quadratic sum of statistical and systematic uncertainties on the numerator of the $r_{\rm AA}$ expression ($\langle{p_{\rm T}}^2\rangle_{\rm AA}$), while the uncertainties on the denominator ($\langle{p_{\rm T}}^2\rangle_{\rm pp}$) are shown as a filled box around unity. In the two panels, the brackets around the two most peripheral data points represent an estimate of the maximum influence of \jpsi\ photo-production, as detailed in Sec. \ref{sec:meanPt}. | 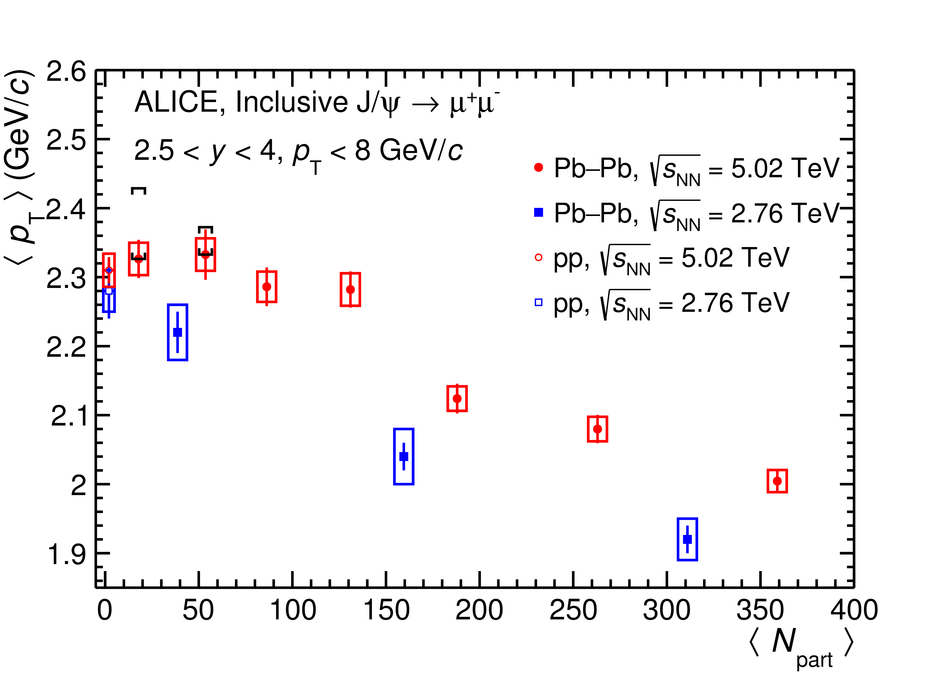 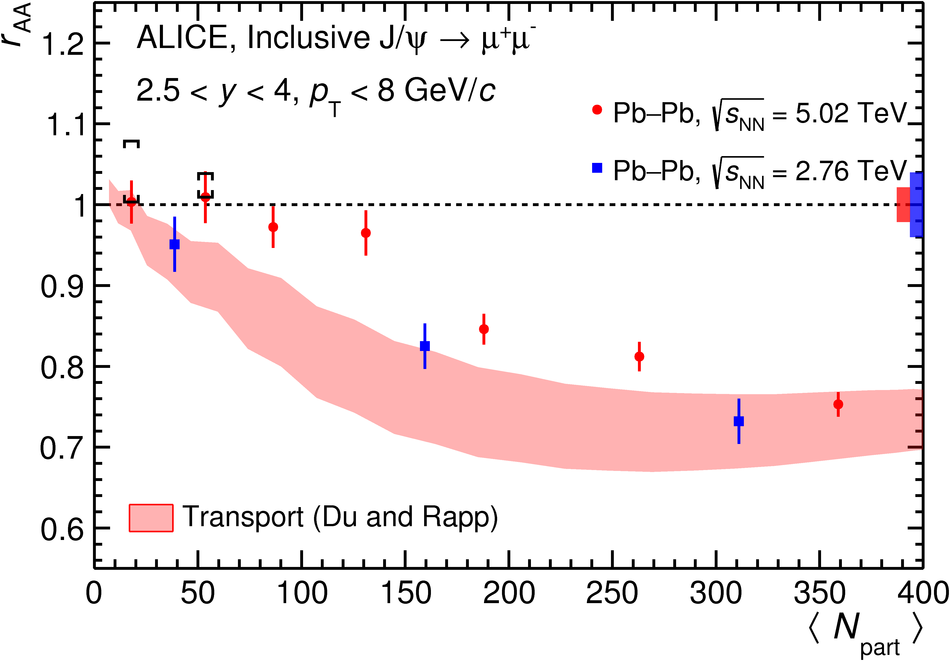 |