Inclusive \jpsi\ nuclear modification factor as a function of \pt\ for \PbPb\ collisions at \sqrtsnnE{5.02} in the 0--20\% (top), 20--40\% (middle) and 40--90\% (bottom) centrality classes. The vertical error bars represent statistical uncertainties, the boxes around the points uncorrelated systematic uncertainties, while the correlated uncertainty is shown as a filled box around $\Raa=1$. The corresponding measurements in \PbPb\ collisions at \sqrtsnnE{2.76} are also shown, as well as the ratio of the $R_{\rm AA}$ values, which is depicted in the bottom panel of the figure. The \Raa\ values at \sqrtsnnE{5.02} and the ratios to lower energy results are compared with transport model calculations and, for 0--20\% and 20--40\% centrality, with the results of the SHM . The brackets around \Raa\ values for 40--90\% centrality in the lowest \pt\ interval represent an estimate of the maximum influence of \jpsi\ photo-production, as detailed in Sec. \ref{sec:Raa}. | 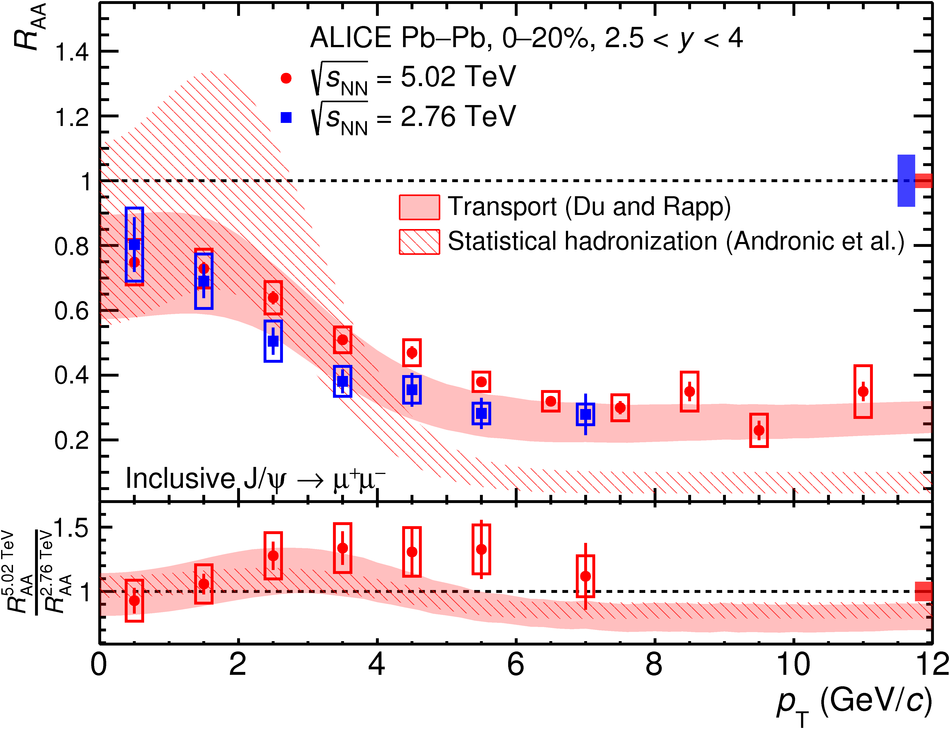   |