The number of SD branches for jets reconstructed in Pb--Pb data are shown. The systematic uncertainties are represented by the shaded area. The datapoints are compared to jets found in PYTHIA events embedded into Pb--Pb events (open markers). The Hybrid model and JEWEL predictions correspond to the red (dashed) and blue (solid) lines. The lower panel shows the ratio of the $n_{\rm{SD}}$ distribution in data and the embedded PYTHIA reference (grey). The ratios of the Hybrid and JEWEL models to the embedded PYTHIA reference are also shown and their uncertainties are purely statistical | 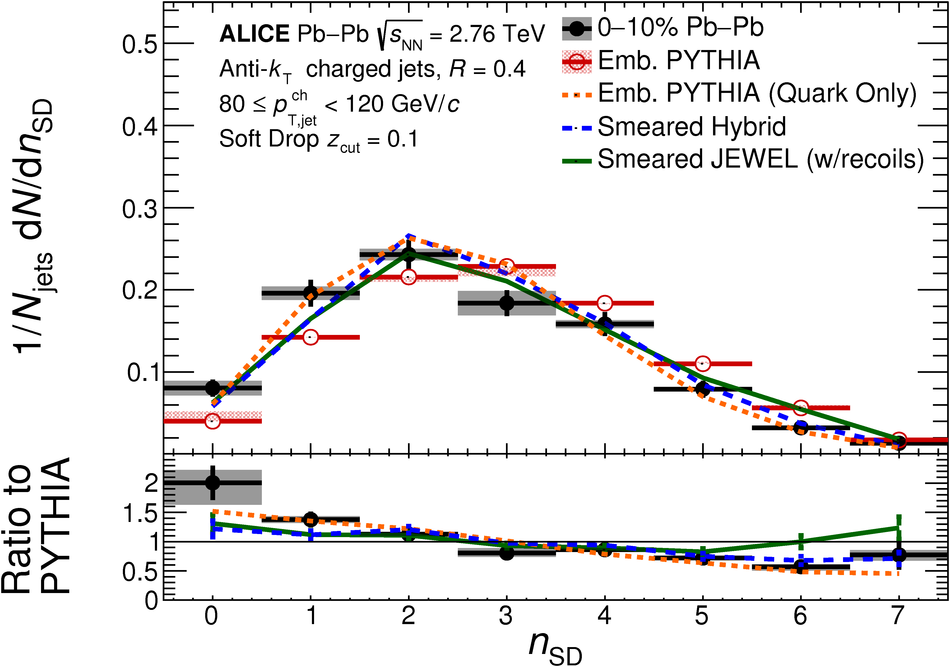 |