\dndy\ (integrated over the measured \pt\ ranges 0-12, 0.4-8, 0.6-6.5 and 0.9-5.5 \gevc\ for \pKzero, \pLambda, \pXi and \pOmega, respectively) as a function of multiplicity for different strange particle species reported for different multiplicity classes (see text for details) Error bars and boxes represent statistical and total systematic uncertainties, respectively. The bin-to-bin systematic uncertainties are shown by shadowed boxes. | 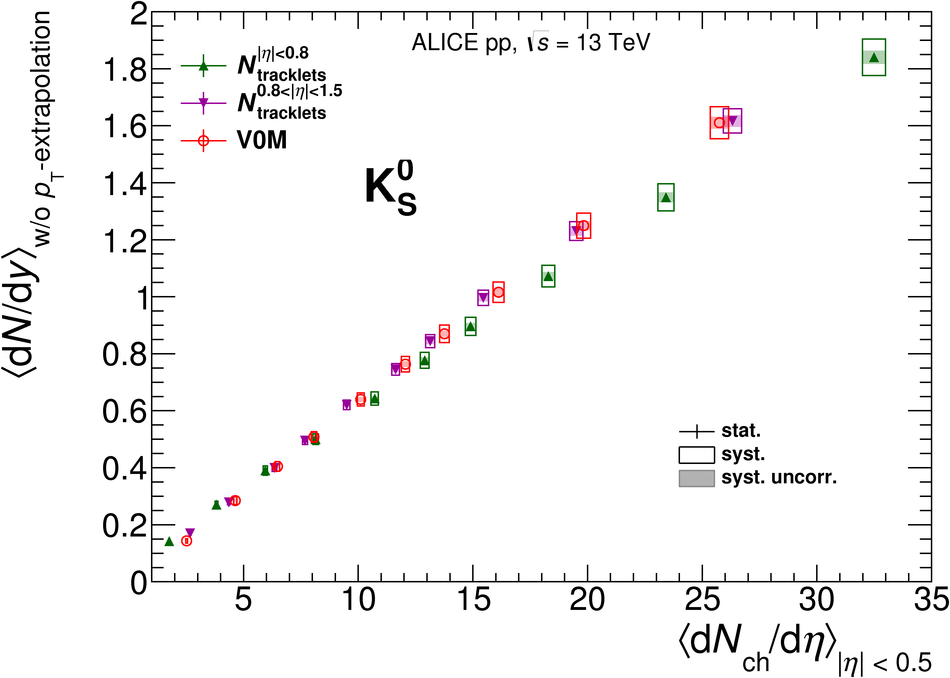 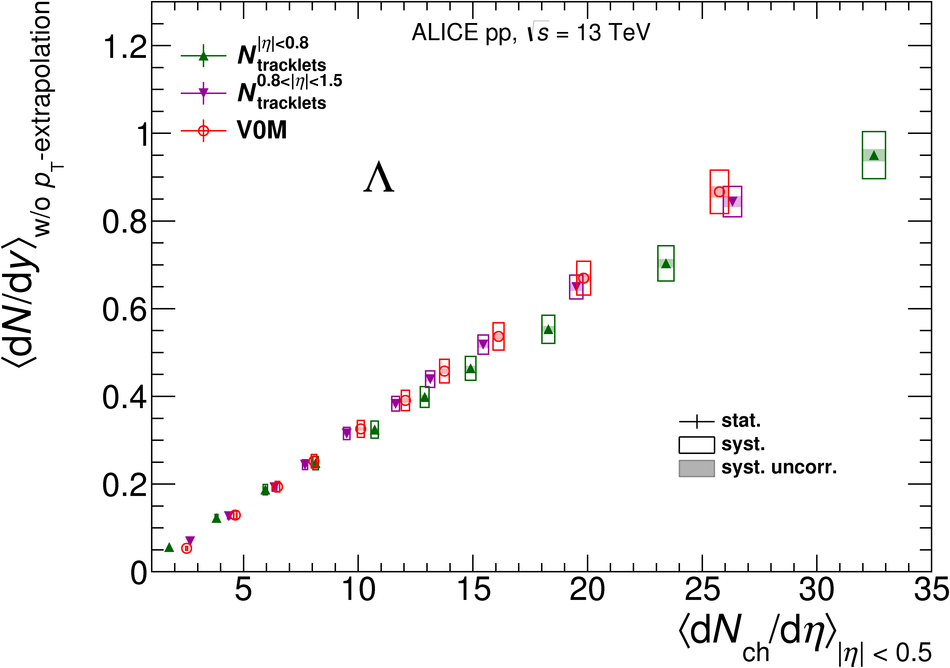 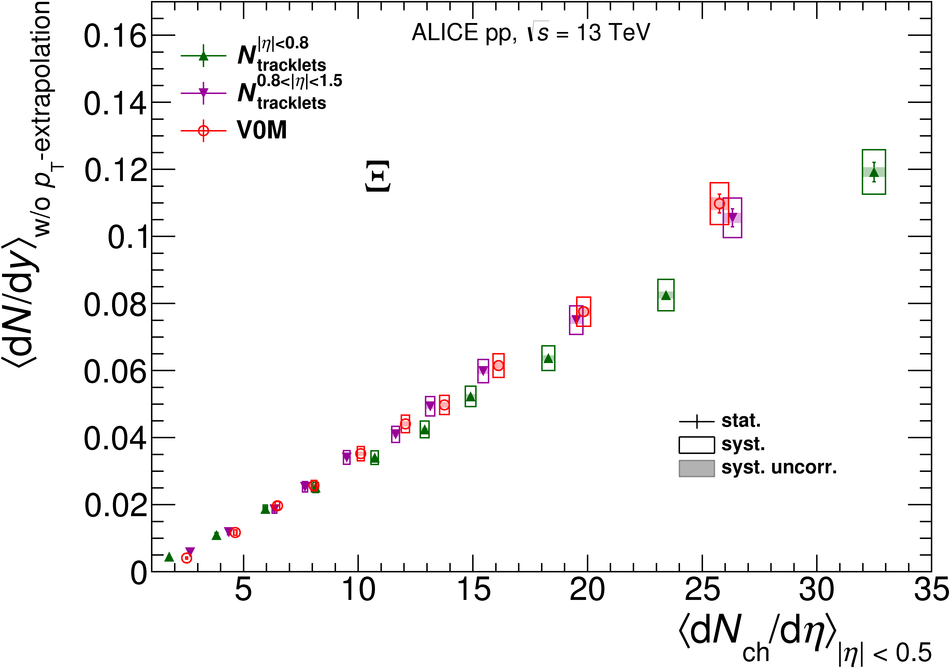 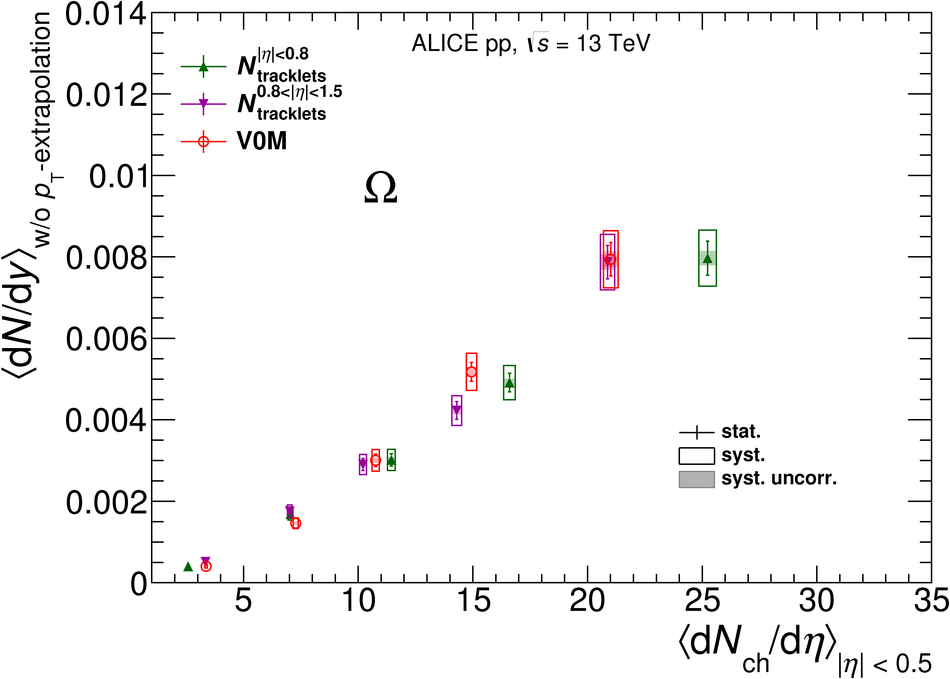 |