$\rhos/\pi$ ratio in 0--20\% (left panel) and 60--80\% (right panel) central \pb collisions at \rsnn. The statistical and systematic uncertainties are shown as bars and boxes, respectively. The measurements are compared to EPOS3 calculations performed with and without a hadronic cascade modeled with UrQMD . In the lower panels, the model to data ratio is reported. Bars indicate statistical uncertainty of calculations whereas the gray shaded boxes represent the square root of sum of squares of statistical and systematic uncertainties associated with data. | 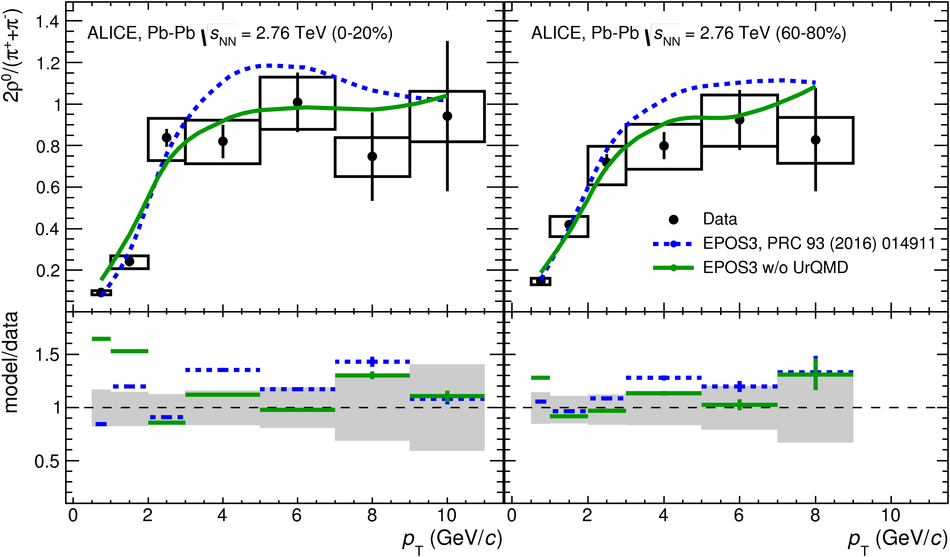 |