$\rhos/\pi$ ratio (left) and \mpt (right) at mid-rapidity ($|y| < 0.5$) in pp and 0--20\%, 20--40\%, 40--60\%, 60--80\% central \pb collisions at \rsnn as a function of \dncr. Statistical uncertainties are shown as bars. The total and uncorrelated systematic uncertainties are shown with open and shaded boxes, respectively. The widths of the boxes are fixed to arbitrary values for better visibility. The measurements are compared to EPOS3 calculations. The $\rhos/\pi$ ratio is also compared to grand canonical thermal model prediction shown with the red horizontal line. | 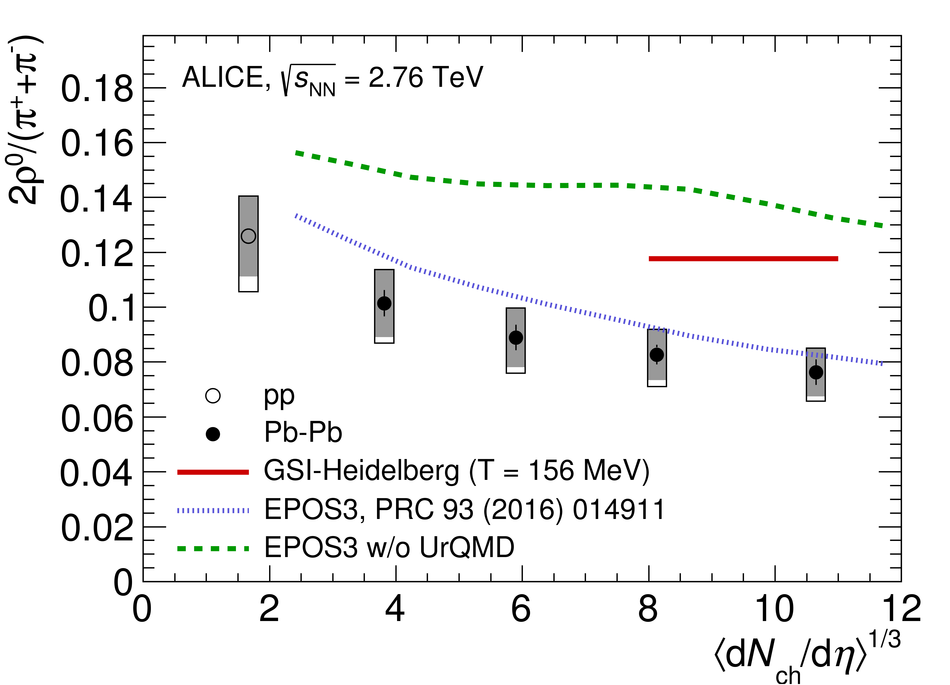 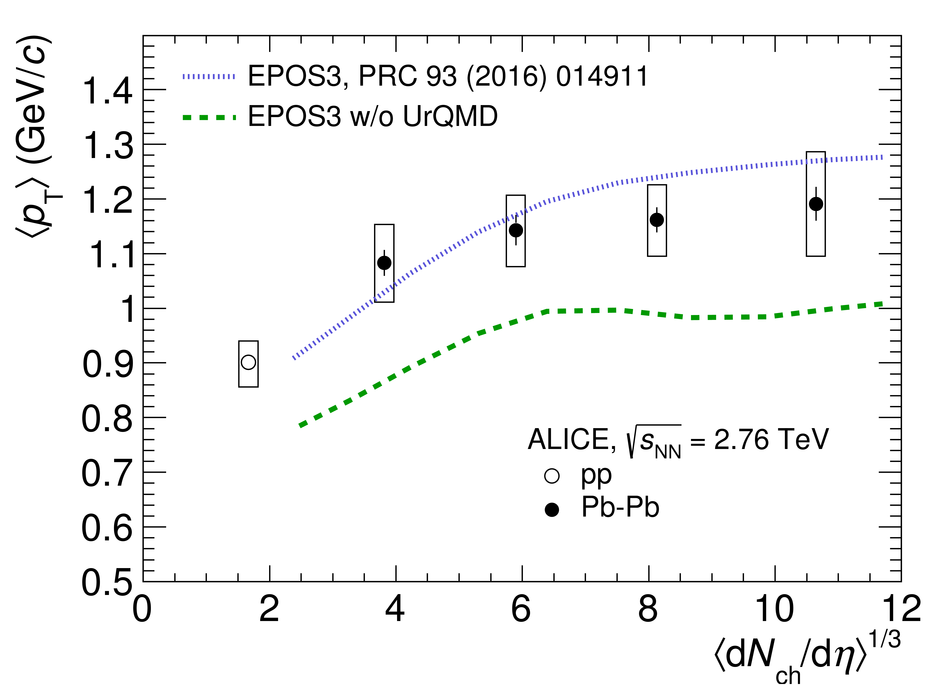 |