Invariant mass distributions for $\pip\pim$ pairs after subtraction of the like-sign background. Plots on the left and right are for the low and high transverse momentum intervals, respectively. Examples are shown for minimum bias pp, 0--20\% and 60--80\% central \pb collisions at \rsnn. Solid red curves represent fits to the function described in the text. Colored dashed curves represent different components of the fit function, which includes a smooth remaining background as well as contributions from \ksnm, \rhos, \omm, \ksm, \fnm and \ftm. See text for details. | 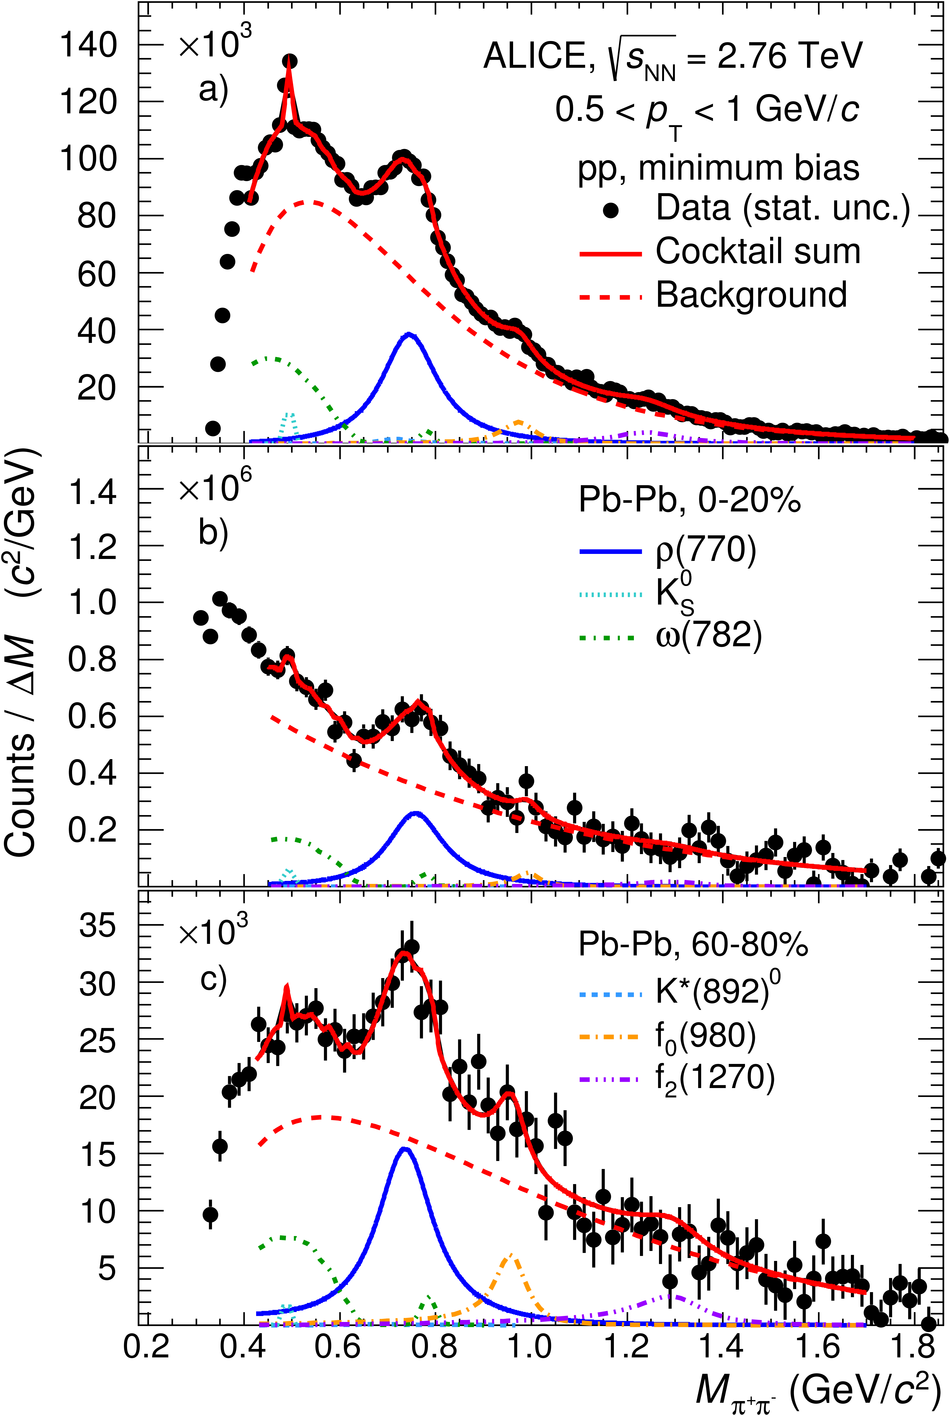 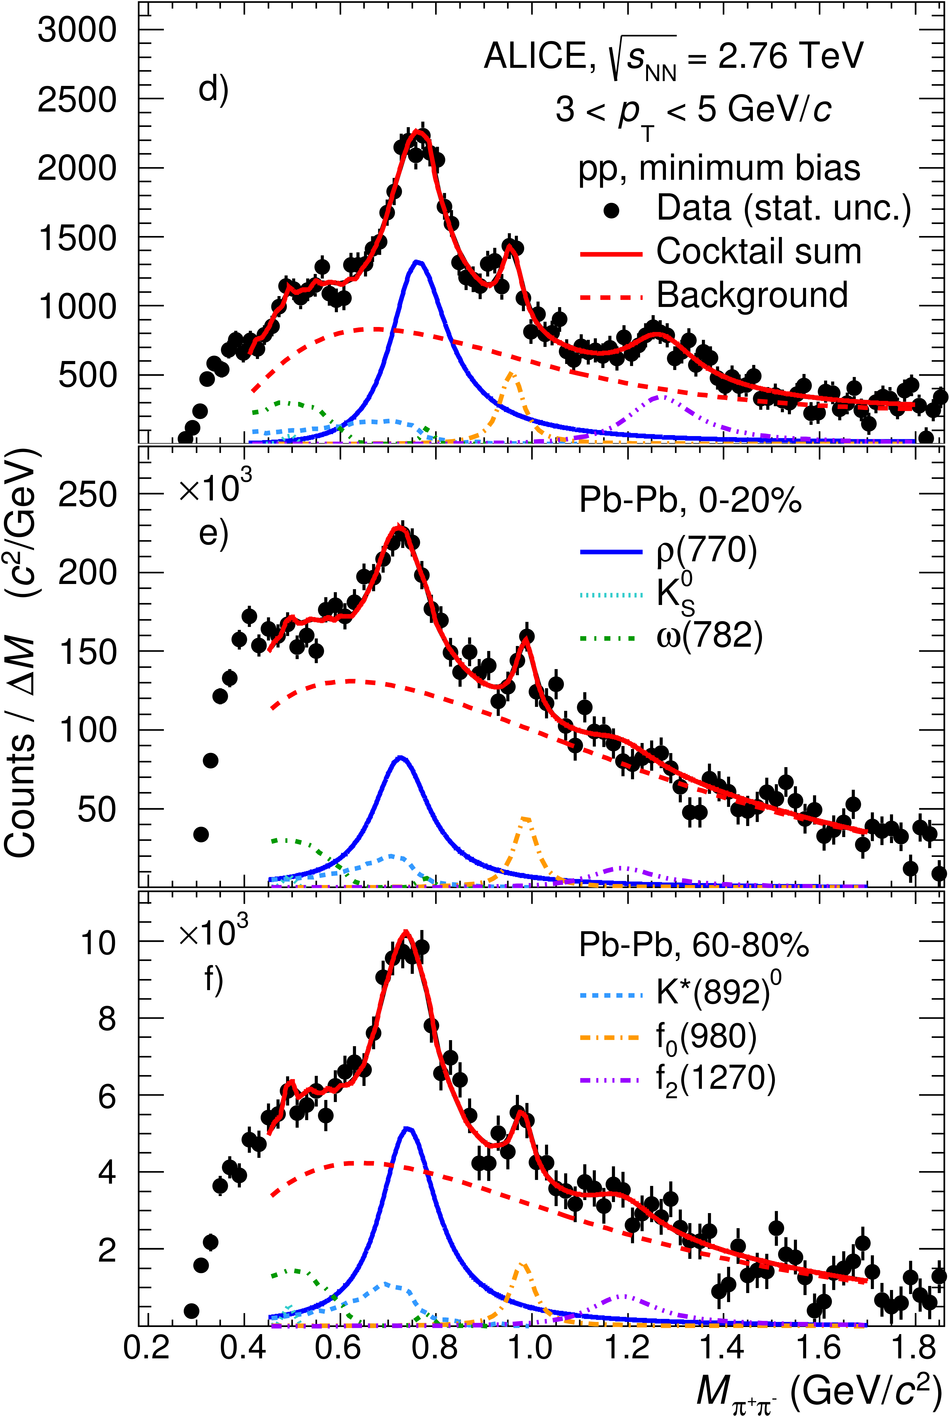 |