Linear and non-linear flow modes as a function of centrality. The total contribution measured in Pb--Pb collisions at $\sqrt{s_\mathrm{NN}}=5.02\,\mathrm{TeV}$ is shown as black squares. Various non-linear contributions are presented in different red and blue colors, while the linear part, extracted from the aforementioned contributions, is shown as a red band. For panel (b), the data points are scaled by 2.5 for better visibility across the panels. | 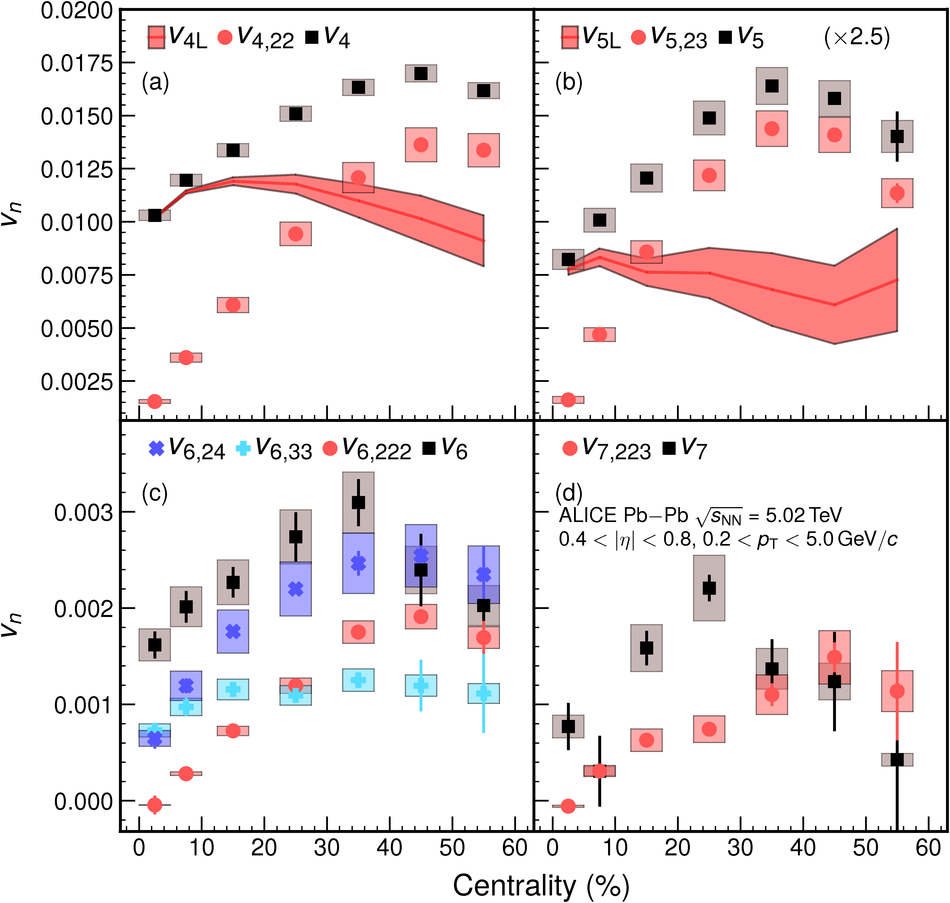 |