Flow harmonics up to the ninth order as a function of centrality, along with five different hydrodynamic calculations shown as color bands, each representing different configurations. For the black markers representing the measured data points, the sytematic uncertainty is indicated by the gray patches around the markers. The bands indicate the extent of the uncertainty of the corresponding calculation. On the bottom part of each panel, the ratios between model calculations and the data are shown with symbols. Ratios with uncertainties larger than 1 are not shown in the ratio panel. For some panels, the points are scaled by an indicated factor for better visibility across the panels. | 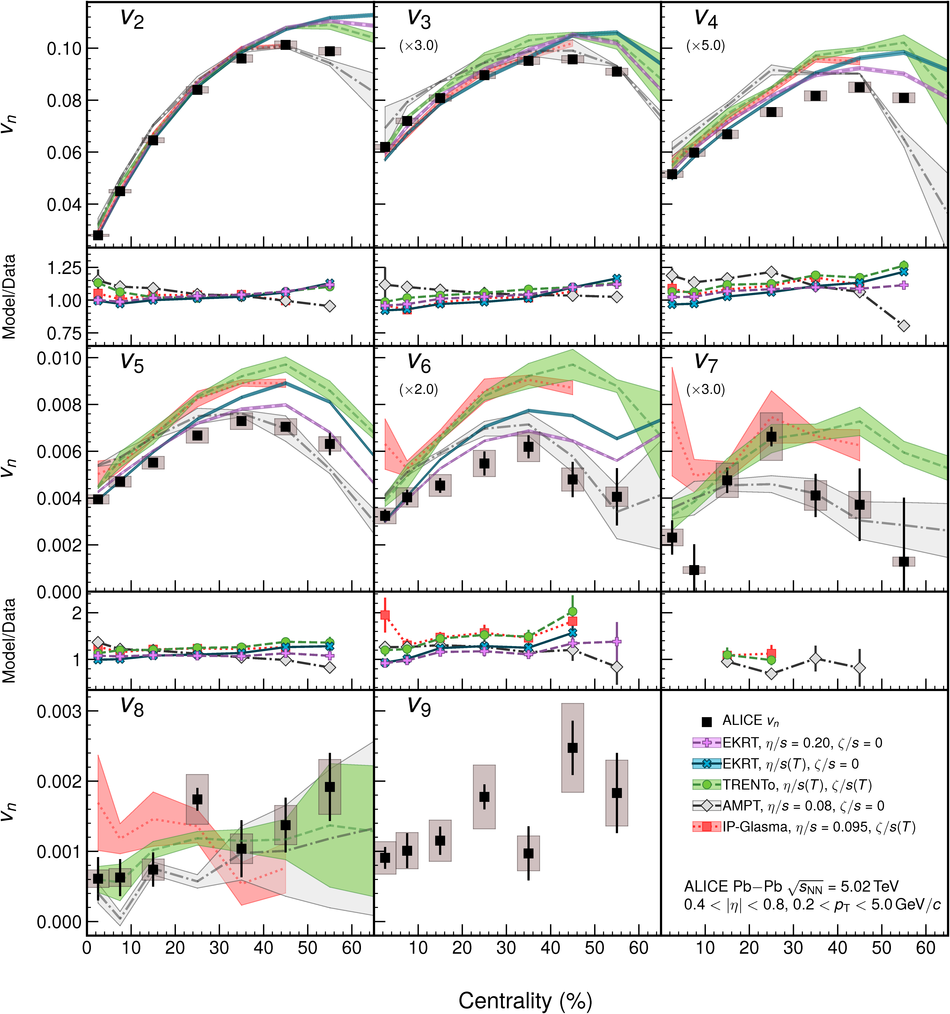 |