The first measurements of the scattering parameters of $\Lambda$K pairs in all three charge combinations ($\Lambda$K$^{+}$, $\Lambda$K$^{-}$, and $\Lambda\mathrm{K^{0}_{S}}$) are presented. The results are achieved through a femtoscopic analysis of $\Lambda$K correlations in Pb-Pb collisions at $\sqrt{s_{\mathrm{NN}}}$ = 2.76 TeV recorded by ALICE at the LHC. The femtoscopic correlations result from strong final-state interactions, and are fit with a parametrization allowing for both the characterization of the pair emission source and the measurement of the scattering parameters for the particle pairs. Extensive studies with the THERMINATOR 2 event generator provide a good description of the non-femtoscopic background, which results mainly from collective effects, with unprecedented precision. Furthermore, together with HIJING simulations, this model is used to account for contributions from residual correlations induced by feed-down from particle decays. The extracted scattering parameters indicate that the strong force is repulsive in the $\Lambda\rm{K}^{+}$ interaction and attractive in the $\Lambda\rm{K}^{-}$ interaction. The data hint that the and $\Lambda\rm{K}^{0}_{S}$ interaction is attractive, however the uncertainty of the result does not permit such a decisive conclusion. The results suggest an effect arising either from different quark-antiquark interactions between the pairs ($\rm s\overline{s}$ in $\Lambda$K$^{+}$ and $\rm u\overline{u}$ in $\Lambda$K$^{-}$) or from different net strangeness for each system (S = 0 for $\Lambda$K$^{+}$, and S = $-2$ for $\Lambda$K$^{-}$). Finally, the $\Lambda$K systems exhibit source radii larger than expected from extrapolation from identical particle femtoscopic studies. This effect is interpreted as resulting from the separation in space-time of the single-particle $\Lambda$ and K source distributions.
Phys. Rev. C 103 (2021) 055201
HEP Data
e-Print: arXiv:2005.11124 | PDF | inSPIRE
CERN-EP-2020-080
Figure 1
Invariant mass distributions in the 0--10\% centrality interval of (a) p$\uppi^{-}$ pairs showing the \Lam peak, and of (b) $\uppi^{+}\uppi^{-}$ pairs showing the \Ks peak, for \Vz candidates. The bottom panels are zoomed to show the background with fit. The vertical dashed (green) lines represent the selection restrictions used in the analyses, the vertical dotted (red) lines delineate the region over which the background was fit, and the dash-dotted (blue) line shows the background fit | 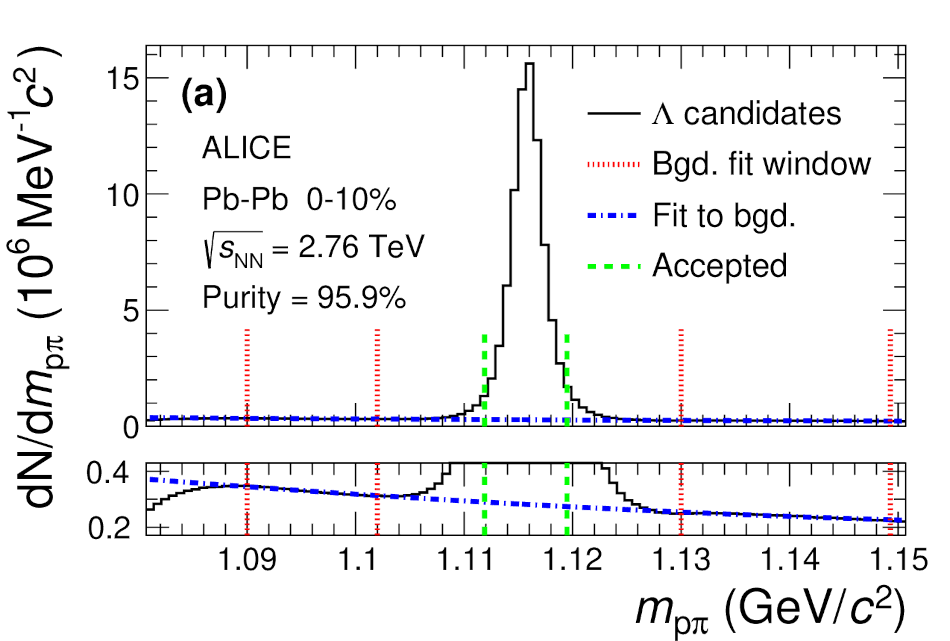  |
Figure 2
THERMINATOR 2 simulation (open squares) together with experimental data (closed circles) Statistical (lines) and systematic (boxes) uncertainties are shown for the experimental data Results are shown for \LamKchP (left), \LamKchM (middle), and \LamKs (right) Rows differentiate the different centrality intervals (0--10\% in the top, 10--30\% in the middle, and 30--50\% in the bottom) A sixth-order polynomial fit to the simulation is shown as a dashed curve. This polynomial is scaled to match the experimental data and is drawn as a solid curve | 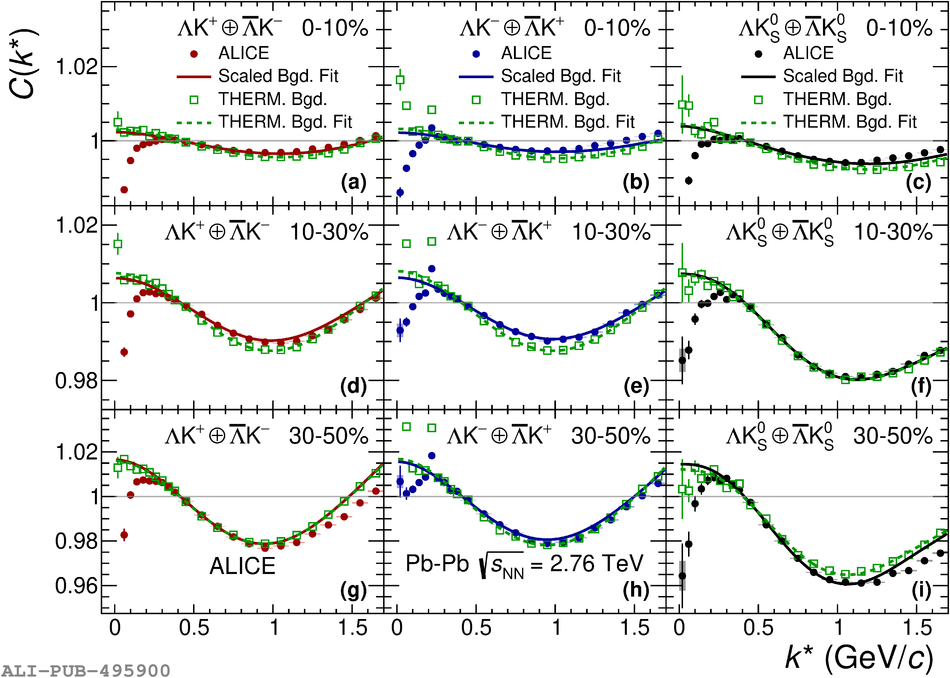 |
Figure 4
Extracted fit parameters for all of the \LamK systems In the figures, lines represent statistical uncertainties, while boxes represent systematic uncertainties. (Left) The scattering parameters, $\Im f_{0}$ and $\Re f_{0}$, together with $d_{0}$ to the right, for the \LamKchP (circles), \LamKchM (squares) and \LamKs (stars) systems. (Right) The $\lambda_{\mathrm{Fit}}$ and radius parameters for the 0--10\% (circles), 10--30\% (squares), and 30--50\% (stars) centrality intervals. In the fit, all \LamK systems share common radii The cross and X points show theoretical predictions made using chiral perturbation theory |  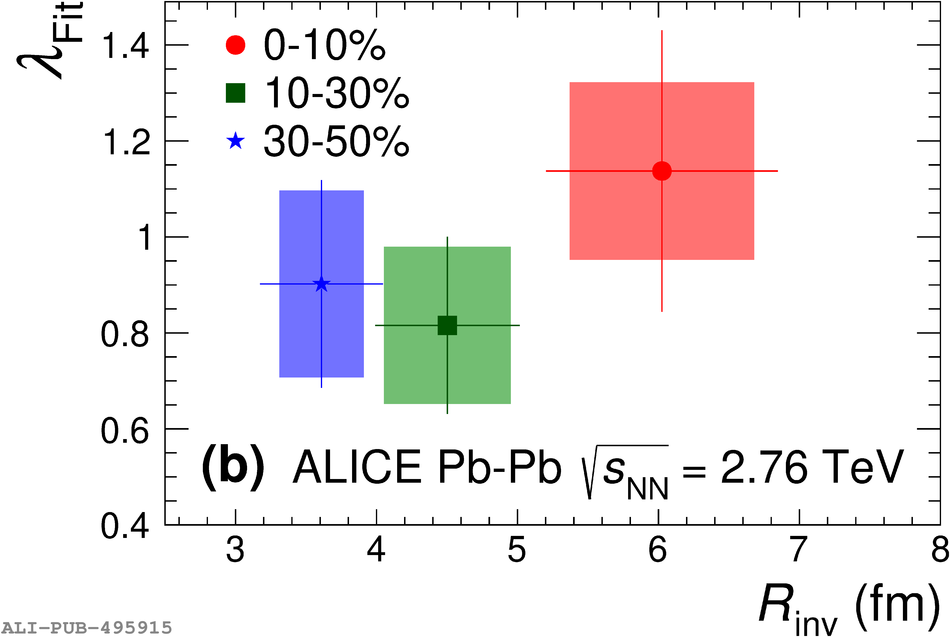 |
Figure 5
Extracted fit $R_{\mathrm{inv}}$ parameters as a function of pair transverse mass (\mt) for several centralities Results from the \LamK analysis are presented together with ALICE published data for various other pair systems. Statistical (lines) and systematic (boxes) uncertainties are shown. |
![[png]](https://alice-publications.web.cern.ch/sites/default/files/papers/6221/5_mTscaling_MinvCalcv3_OthersTransparent_3Res_NoResStamp.png)
Figure 6
Spherical harmonics components $C_{00}$ (left) and $\Re C_{11}$ (right) of the \LamKchP correlation function for the 0--10\% centrality interval. Statistical (lines) and systematic (boxes) uncertainties are shown The $C_{00}$ component is similar to the one-dimensional correlation functions typically studied, and probes the overall size of the source The $\Re C_{11}$ component probes the asymmetry in the system; a non-zero value reveals the asymmetry | 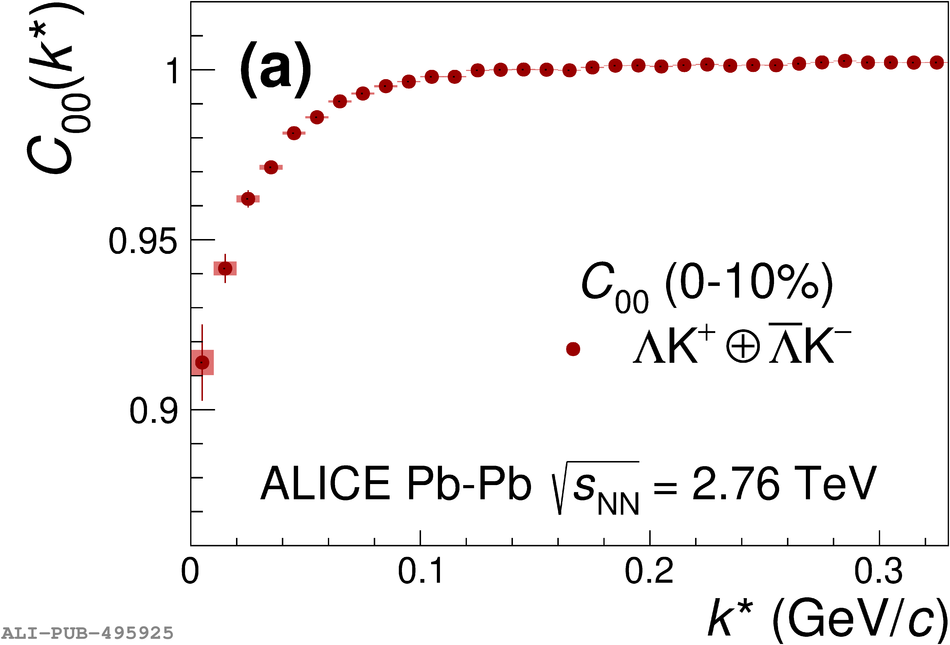 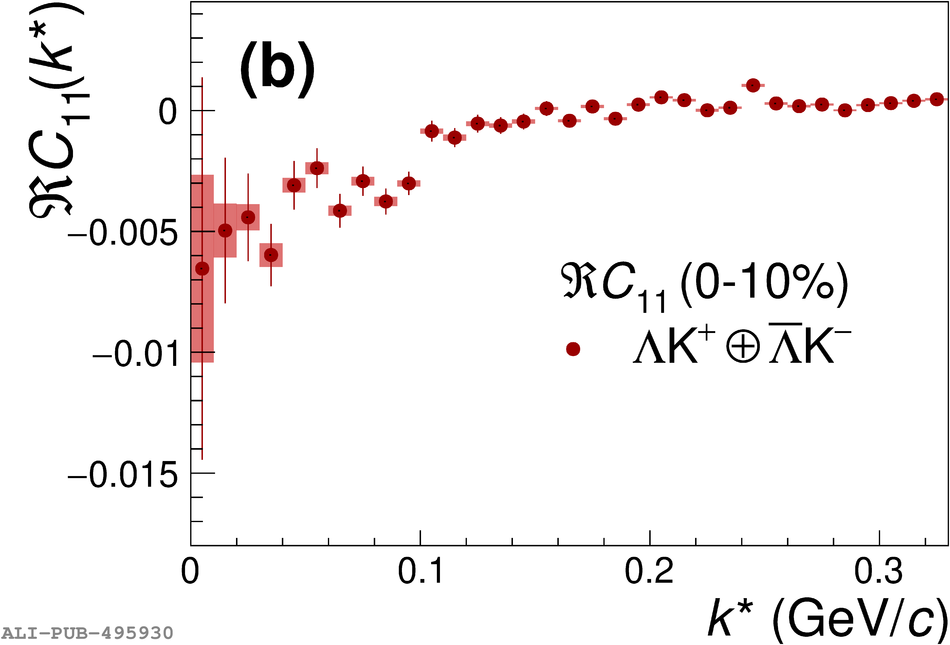 |
Figure 7
Correlation functions for the $\Lambda\mathrm{K^{+}}\oplus\overline{\Lambda}\mathrm{K^{-}}$ system built using the Stavinskiy method for 0--10\%, 10--30\%, and 30--50\% centrality intervals. Closed symbols represent correlations built using the normal mixed-event reference distribution, while open symbols represent correlations formed using the Stavinskiy same-event pseudo-pairs as a reference Statistical (lines) and systematic (boxes) uncertainties are shown | 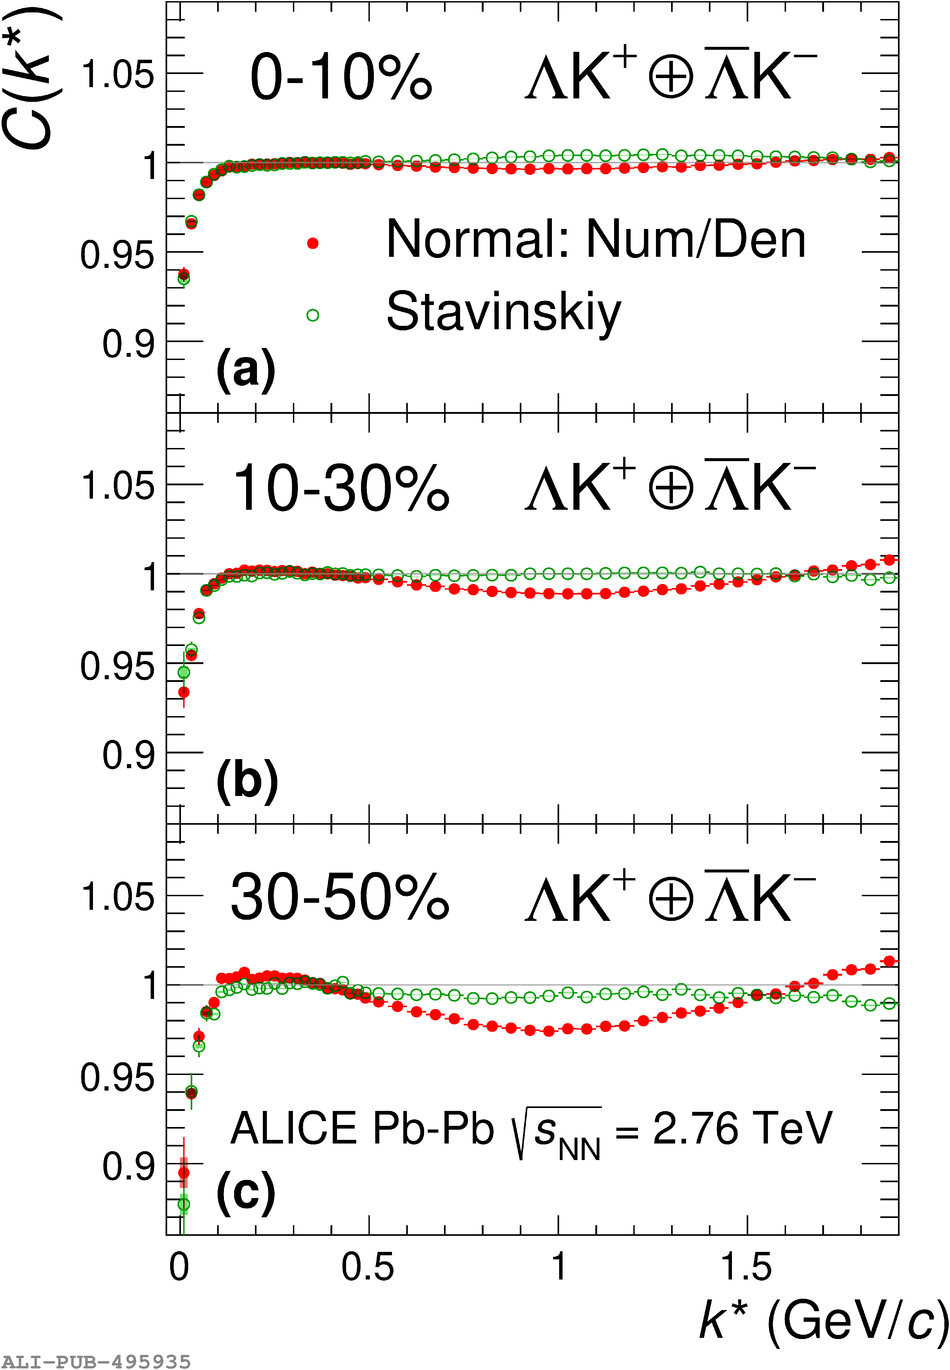 |
Figure 8
Results from the THERMINATOR 2 simulation implemented with an impact parameter $b = 2$ fm for the \LamKchP pair system Where experimental data are shown, lines represent statistical uncertainties, while boxes represent systematic uncertainties (a) the one-dimensional correlation function from THERMINATOR 2 together with the experimental data (b) the $\Re C_{11}$ component of a spherical harmonic decomposition of the THERMINATOR 2 simulation together with the experimental data The other four panels show the source distribution from the simulation in the (c) out, (d) side, and (e) long directions, as well as (f) the temporal characteristics, all in the PRF The source distributions have all been fitted with a Gaussian form over the regions contained within the dashed lines, the results of which are printed within the respective plots | 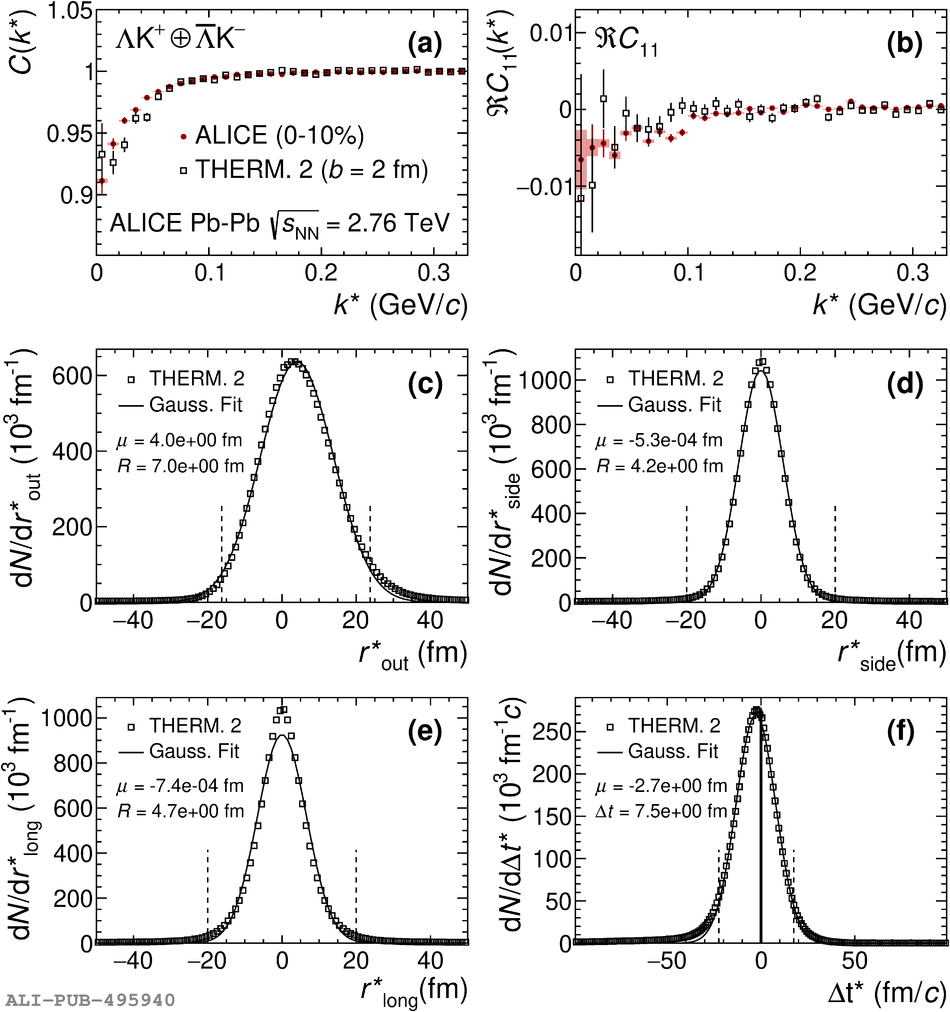 |
Figure 9
Probing the effect of varying the source shift in the outward direction, $\mu_{\mathrm{out}}$, within the THERMINATOR 2 framework. To achieve this, particle pairs are formed from the simulation, but with altered spatial characteristics achieved by drawing the out, side, and long components from predetermined Gaussian distributions. The sources in all three directions are Gaussians of width 5 fm The distributions used for the side and long direction are centered at the origin, while the shift in the outward direction, $\mu_{\mathrm{out}}$, is varied The plots show fits resulting from sources with $\mu_{\mathrm{out}}$ increasing from 0 to 6 fm. The effect of increasing $\mu_{\mathrm{out}}$ clearly increases the effective radius extracted in the fit | 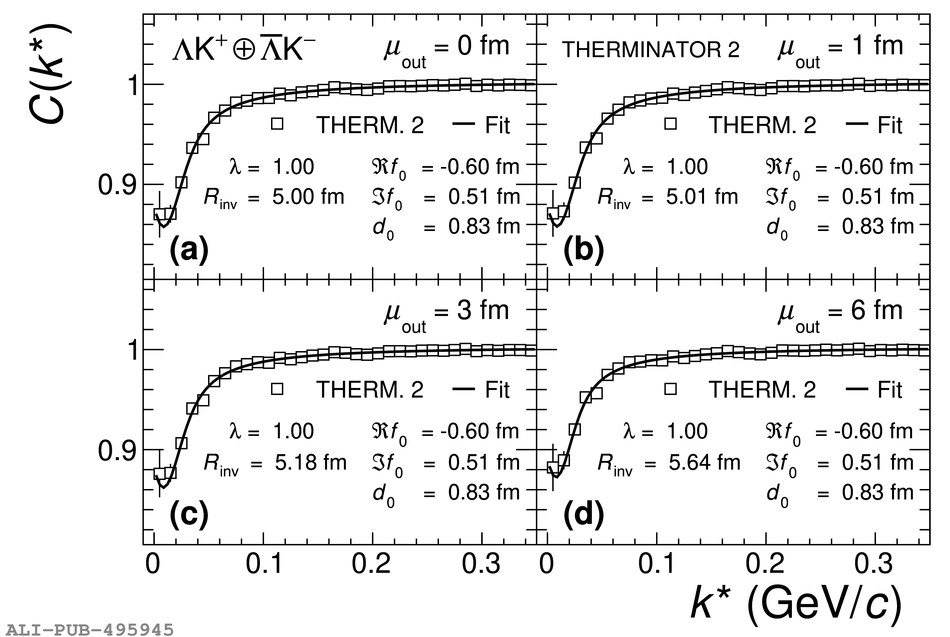 |
Figure 10
Spherical harmonics components (left) $C_{00}$ and (right) $\Re C_{11}$ of the \LamKchP correlation function for the 0--10\% centrality interval shown with results from the THERMINATOR 2 simulation implemented with different shifts in the outward direction, $\mu_{\mathrm{out}}$, as described in the text Statistical (lines) and systematic (boxes) uncertainties are shown for the experimental data | 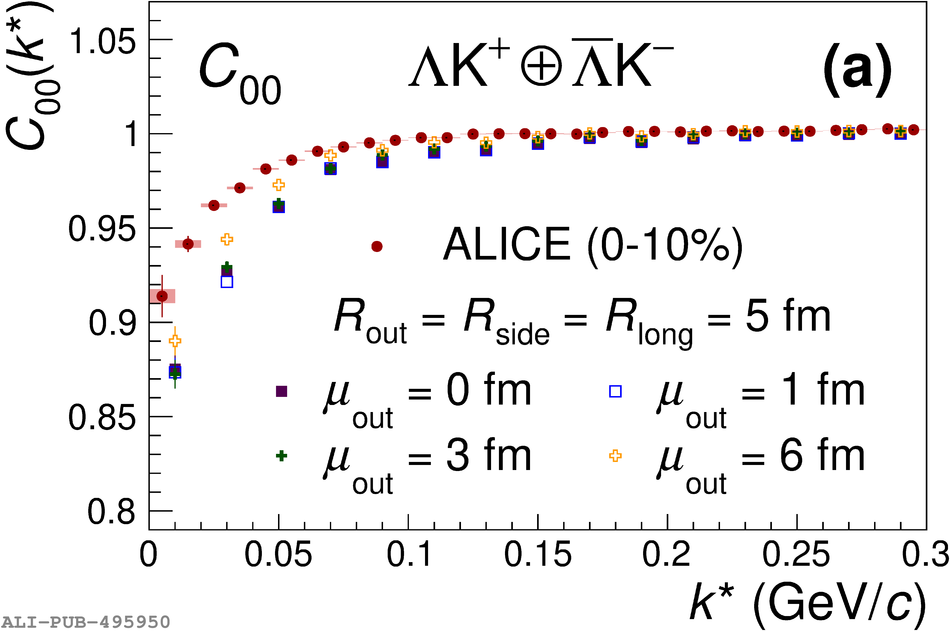 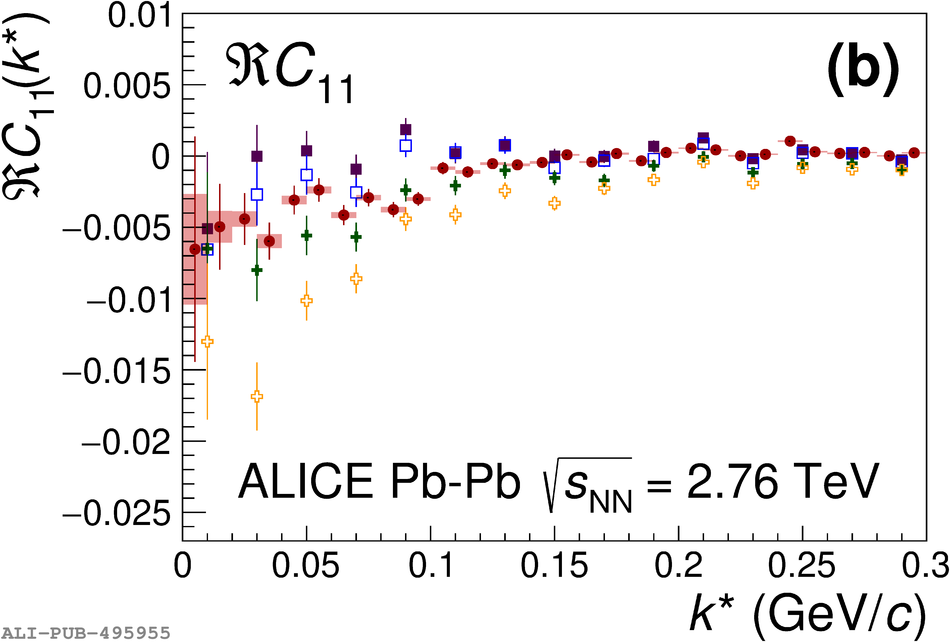 |