Transverse momentum distributions of deuterons (left) and anti-deuterons (right) for various multiplicity classes. The multiplicity class definition is based on the signal amplitude observed in the V0A detector located on the Pb-side. The vertical bars represent the statistical errors, the empty boxes show the systematic uncertainty. The lines represent individual fits using a $m_{\rm T}$-exponential function. | 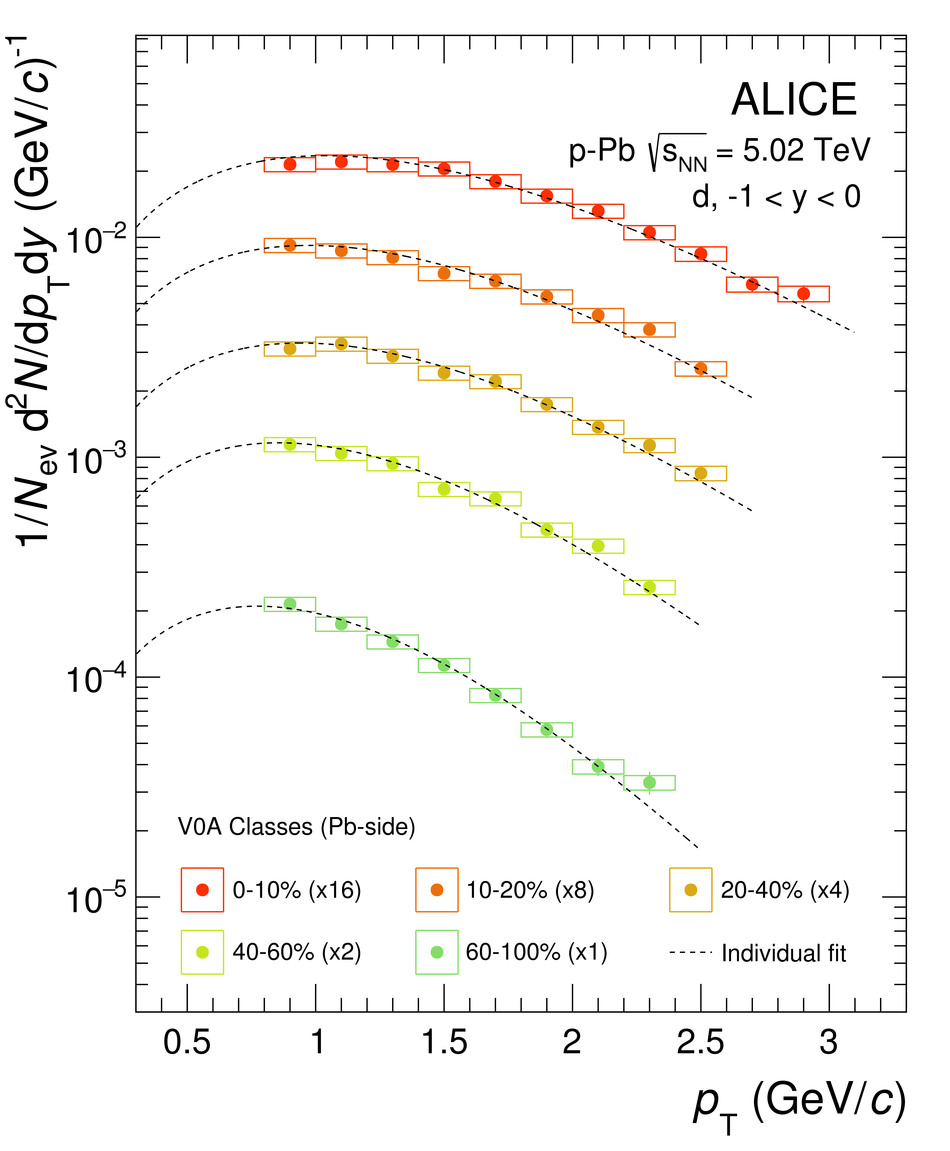 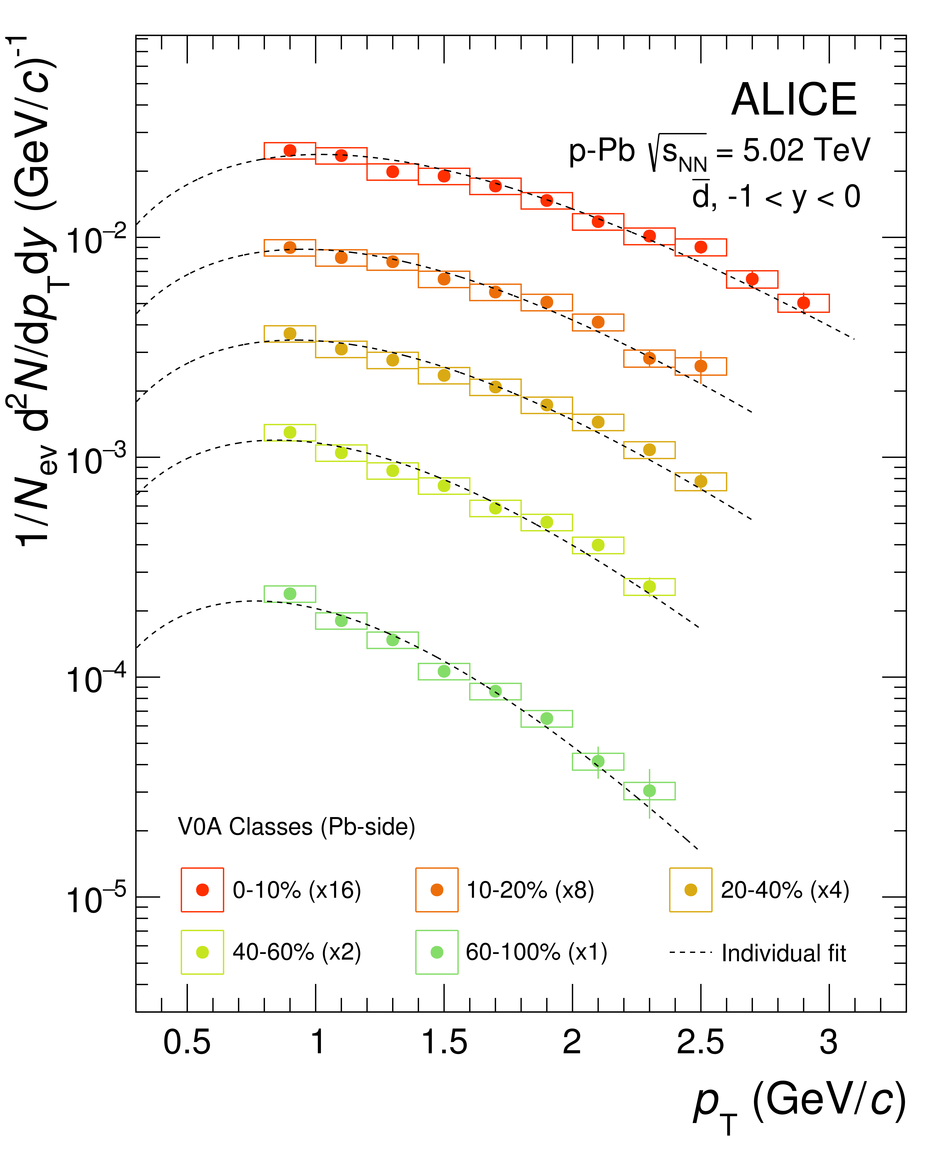 |