The $p_{\rm{T}}$-differential non-linear flow modes, $v_{4,22}$, $v_{5,32}$, $v_{6,33}$ and $v_{6,222}$ for $\pi^{\pm}$, $\rm{K}^{\pm}$ , $\rm{K}^{0}_{S}$ , p + $\overline{\rm{p}}$, $\Lambda$ + $\overline{\Lambda}$ and $\phi$-meson have been measured for the first time at $\sqrt{s_{\rm{NN}}}$ = 5.02 TeV in Pb-Pb collisions with the ALICE detector at the Large Hadron Collider. The results were obtained with a multi-particle technique, correlating the identified hadrons with reference charged particles from a different pseudorapidity region. These non-linear observables probe the contribution from the second and third order initial spatial anisotropy coefficients to higher flow harmonics. All the characteristic features observed in previous $p_{\rm{T}}$-differential anisotropic flow measurements for various particle species are also present in the non-linear flow modes, i.e. increase of magnitude with increasing centrality percentile, mass ordering at low $p_{\rm{T}}$ and particle type grouping in the intermediate $p_{\rm{T}}$ range. Hydrodynamical calculations (iEBE-VISHNU) that use different initial conditions and values of shear and bulk viscosity to entropy density ratios are confronted with the data at low transverse momenta. These calculations exhibit a better agreement with the anisotropic flow coefficients than the non-linear flow modes. These observations indicate that non-linear flow modes can provide additional discriminatory power in the study of initial conditions as well as new stringent constraints to hydrodynamical calculations.
JHEP06 (2020) 147
e-Print: arXiv:1912.00740 | PDF | inSPIRE
CERN-EP-2019-271
Figure 1
Reconstruction and $d_{4,22}$ measurement of $\phi$-mesons. Upper panel: extraction of $N^{\rm{sig}}$ and $N^{\rm{bkg}}$ by fitting the invariant mass (${\it M}_{\rm{inv}}$) distribution for $\phi$-meson candidates from pairs of kaons with opposite charges for $3< p_{\rm{T}}< 4.5 {\rm GeV}/c$ and the 10--20\% centrality interval, lower panel: extraction of $d_{4,22}^{\rm sig}$ by fitting Eq. \ref{Eq:dnmk} to the invariant mass dependence of $d_{4,22}^{\rm total}$. | 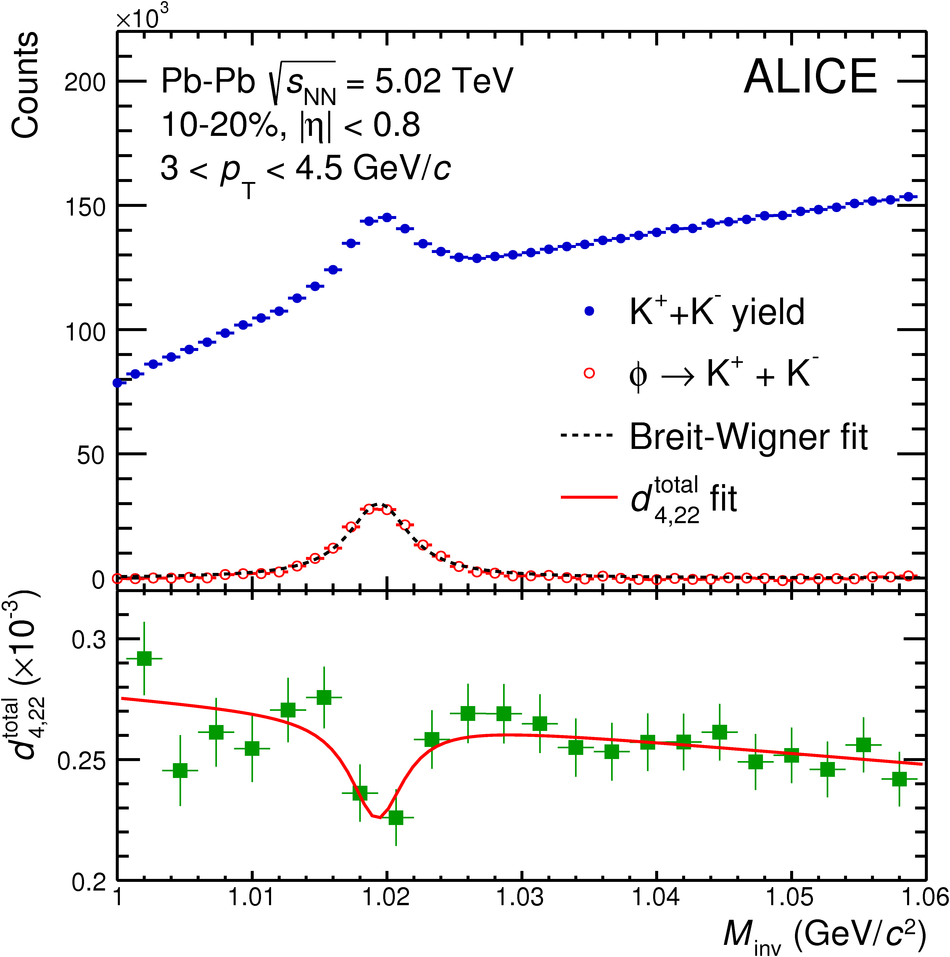 |


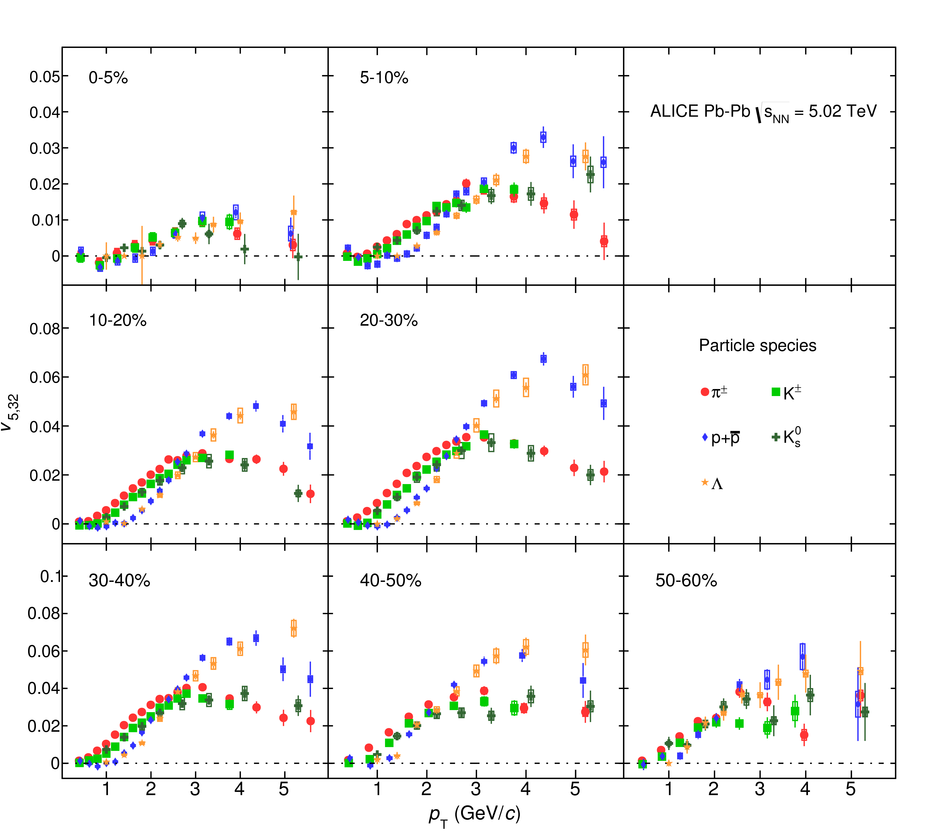
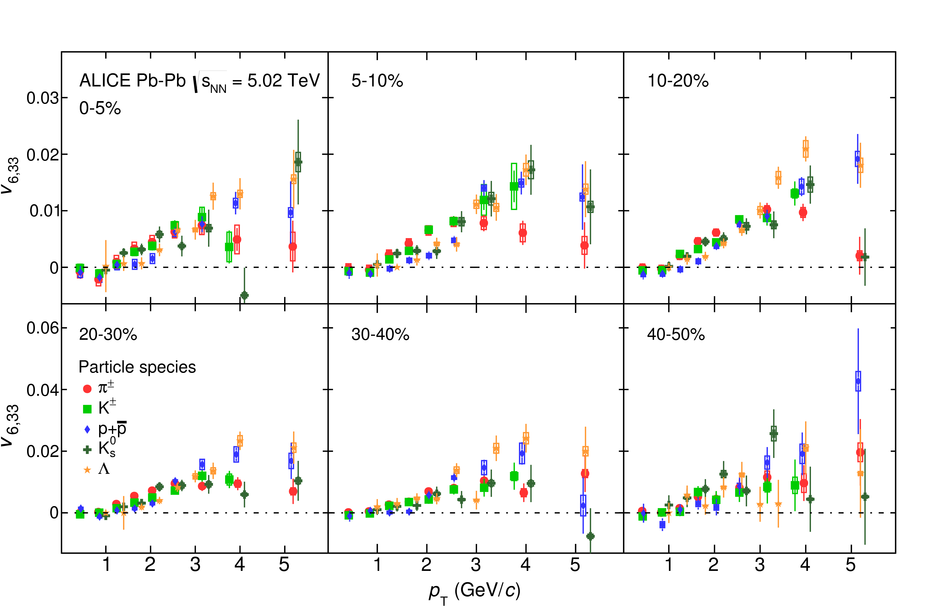
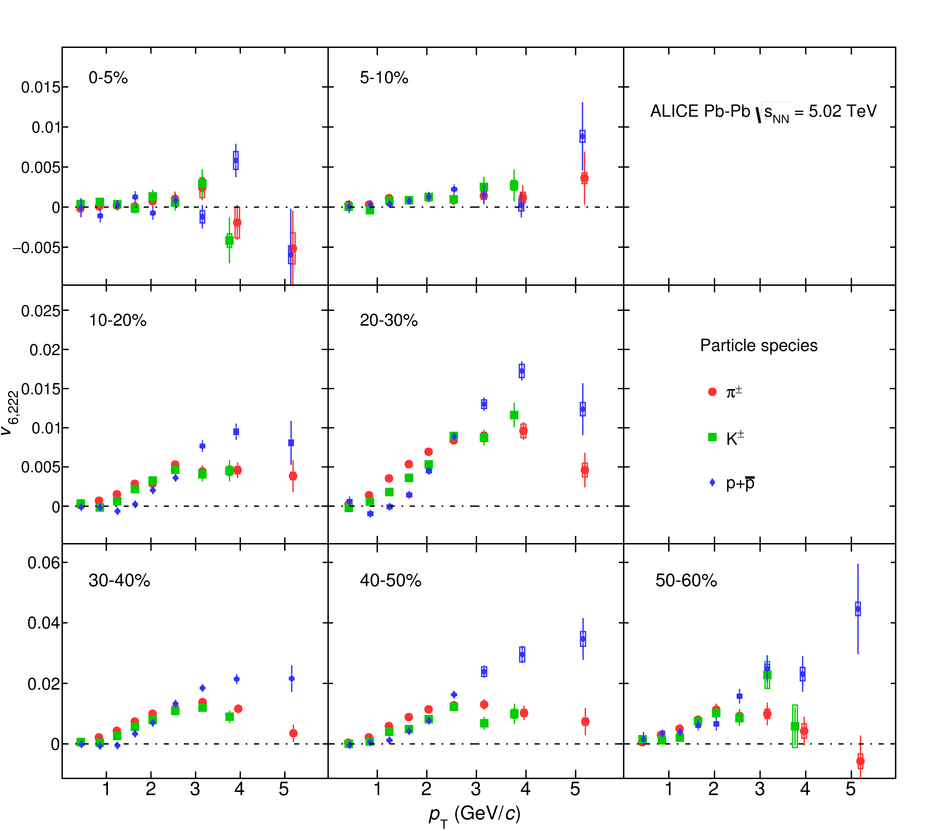

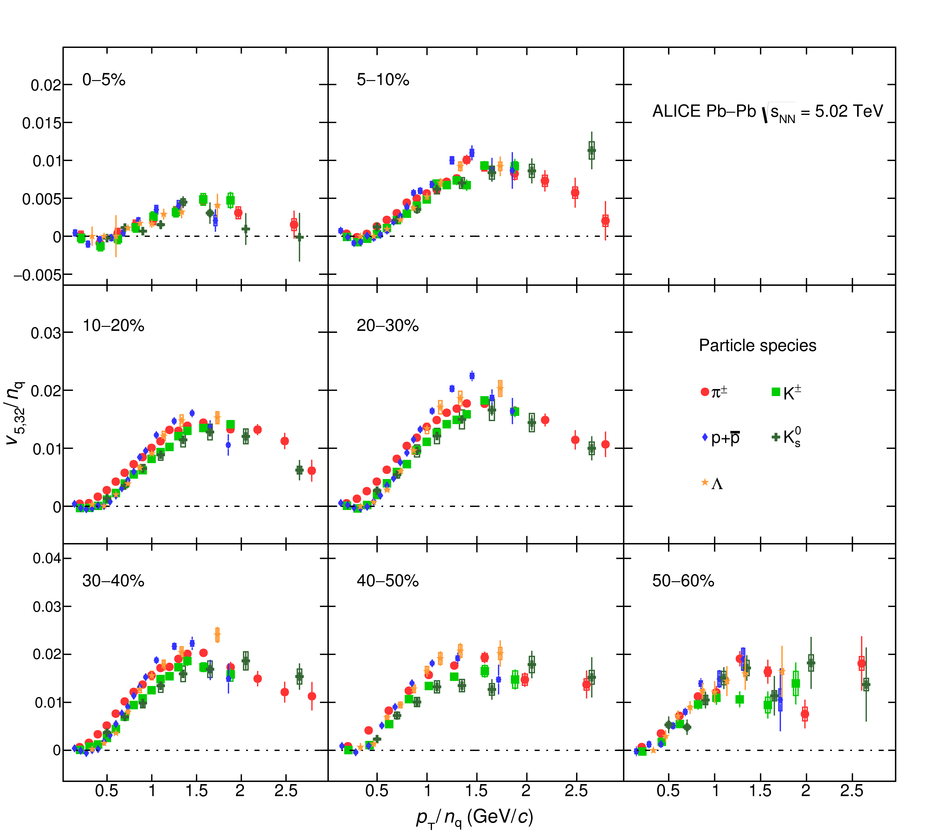
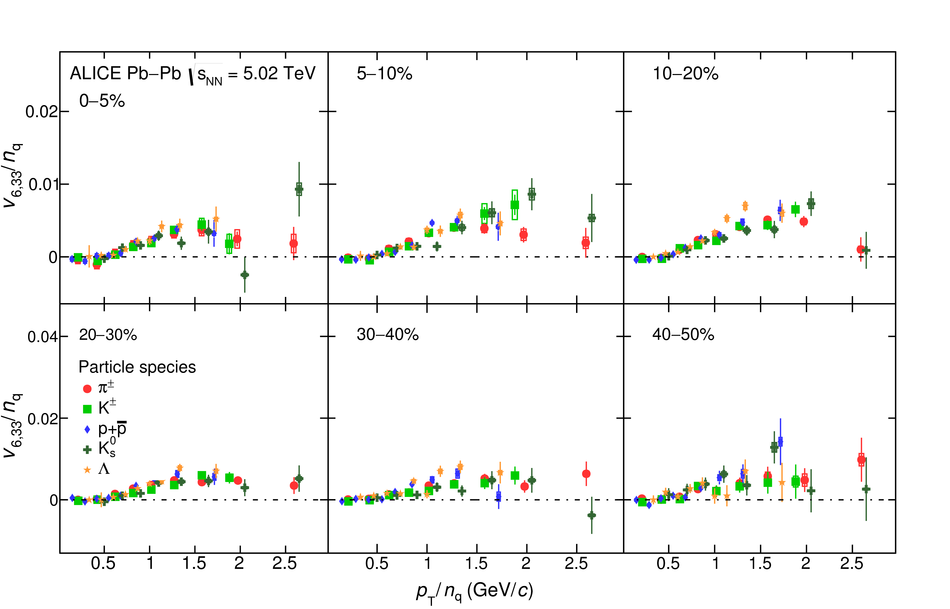
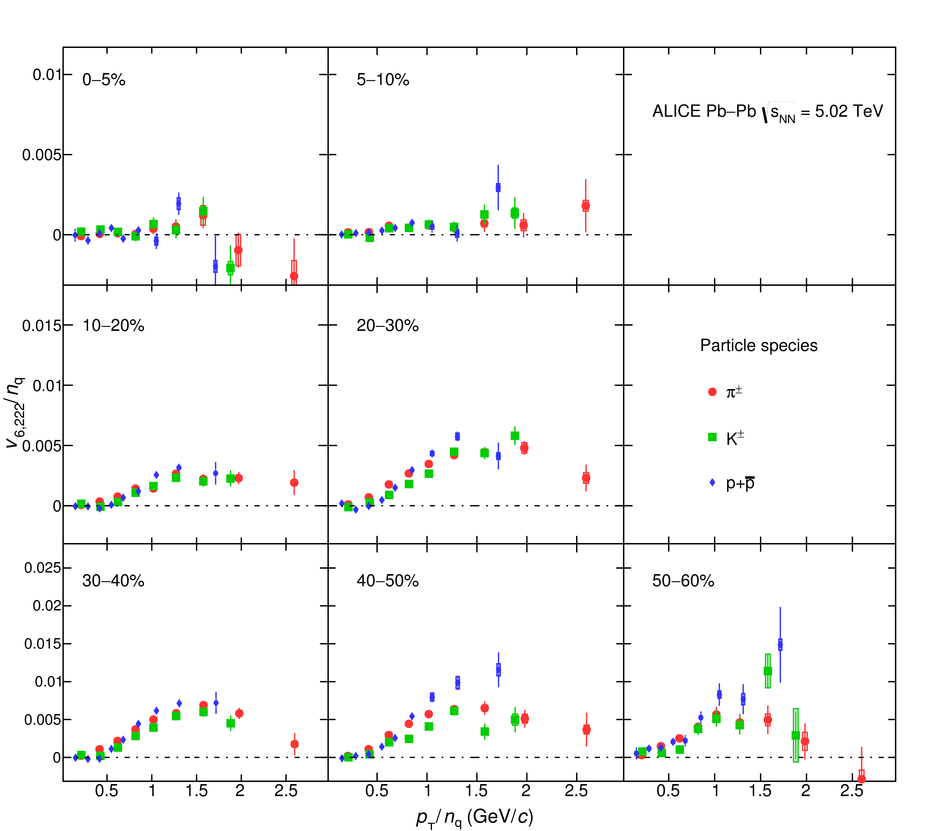
Figure 14
The comparison between $[v_{4,22}^{\pi^{\pm}} - v_{4,22}^{\rm p+\bar{p}}](p_{\rm T}) / v_{4,22}^{\rm h^{\pm}} $ and $[v_{4}^{\pi^{\pm}} - v_{4}^{\rm p+\bar{p}}](p_{\rm T}) / v_{4}^{\rm h^{\pm}} $ grouped into different centrality intervals of Pb--Pb collisions at \sNN. Statistical and systematic uncertainties are shown as bars and boxes, respectively. | 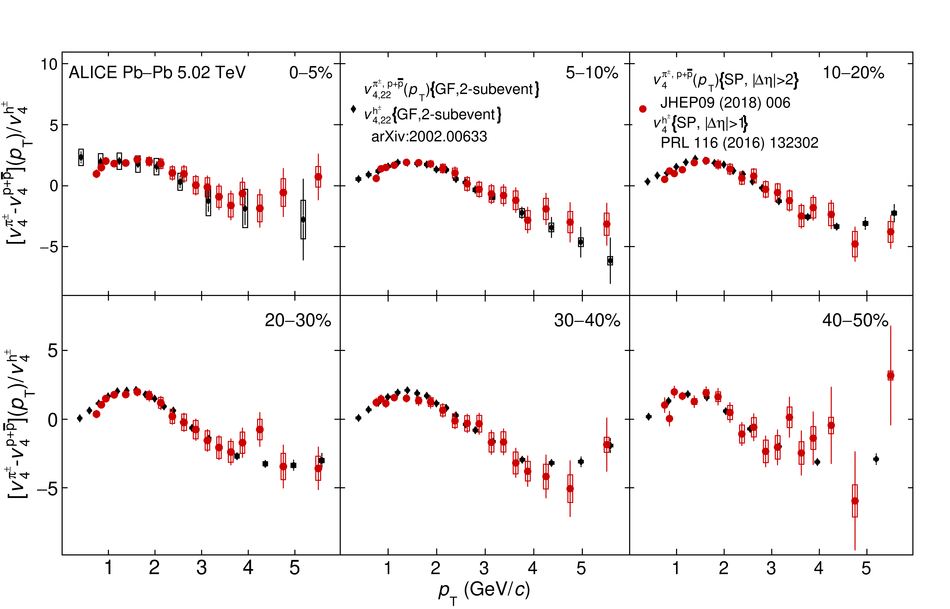 |
Figure 15
The \pT-differential $v_{4,22}$ of \pion, \kaon and \proton in the 0--10\% up to 50--60\% centrality intervals of Pb--Pb collisions at \sNN compared with iEBE-VISHNU hybrid models with two different sets of initial parameters: AMPT initial conditions ($\eta/s$= 0.08 and $\zeta/s$ = 0) shown as solid bands and \trento initial conditions ($\eta/s({\rm T})$ and $\zeta/s({\rm T})$) as hatched bands. The bottom panels show the difference between the measurements and each model. Statistical and systematic uncertainties are shown as bars and boxes, respectively. |  |
Figure 16
The \pT-differential $v_{5,32}$ of \pion, \kaon and \proton in the 0--10\% up to 50--60\% centrality intervals of Pb--Pb collisions at \sNN compared with iEBE-VISHNU hybrid models with two different sets of initial parameters: AMPT initial conditions ($\eta/s$= 0.08 and $\zeta/s$ = 0) shown as solid bands and \trento initial conditions ($\eta/s({\rm T})$ and $\zeta/s({\rm T})$) as hatched bands. The bottom panels show the difference between the measurements and each model. Statistical and systematic uncertainties are shown as bars and boxes, respectively. | 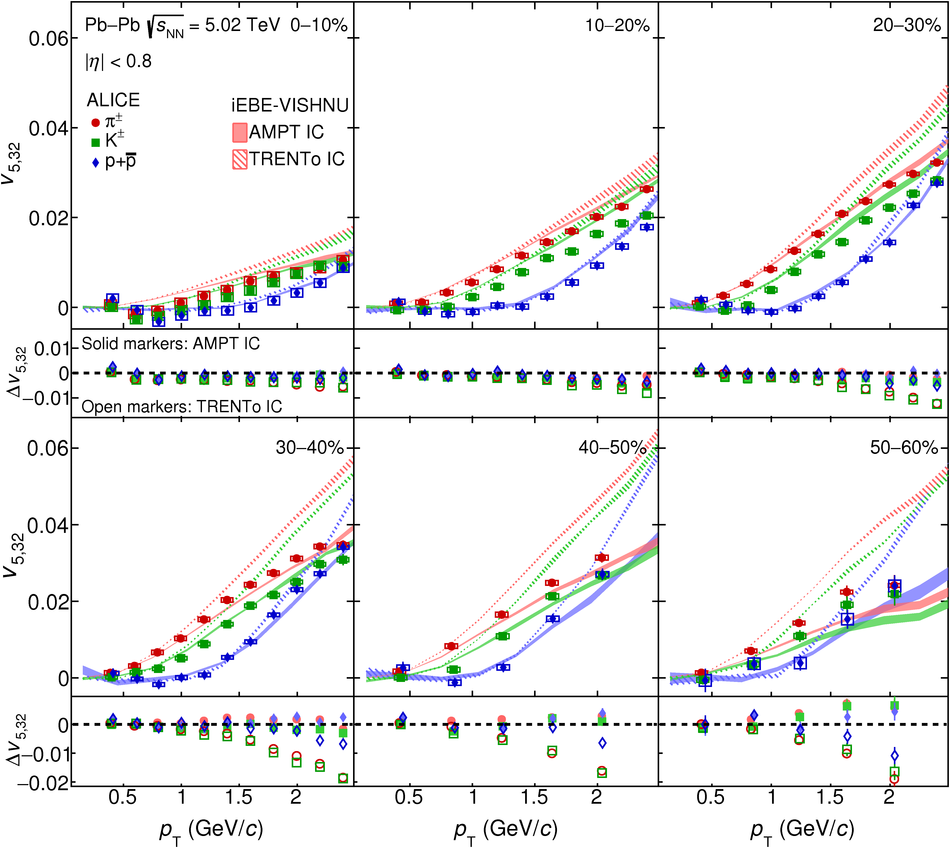 |
Figure 17
The \pT-differential $v_{6,33}$ of \pion, \kaon and \proton in the 0--10\% up to 40--50\% centrality intervals of Pb--Pb collisions at \sNN compared with iEBE-VISHNU hybrid models with two different sets of initial parameters: AMPT initial conditions ($\eta/s$= 0.08 and $\zeta/s$ = 0) shown as solid bands and \trento initial conditions ($\eta/s({\rm T})$ and $\zeta/s({\rm T})$) as hatched bands. The bottom panels show the difference between the measurements and each model. Statistical and systematic uncertainties are shown as bars and boxes, respectively. | 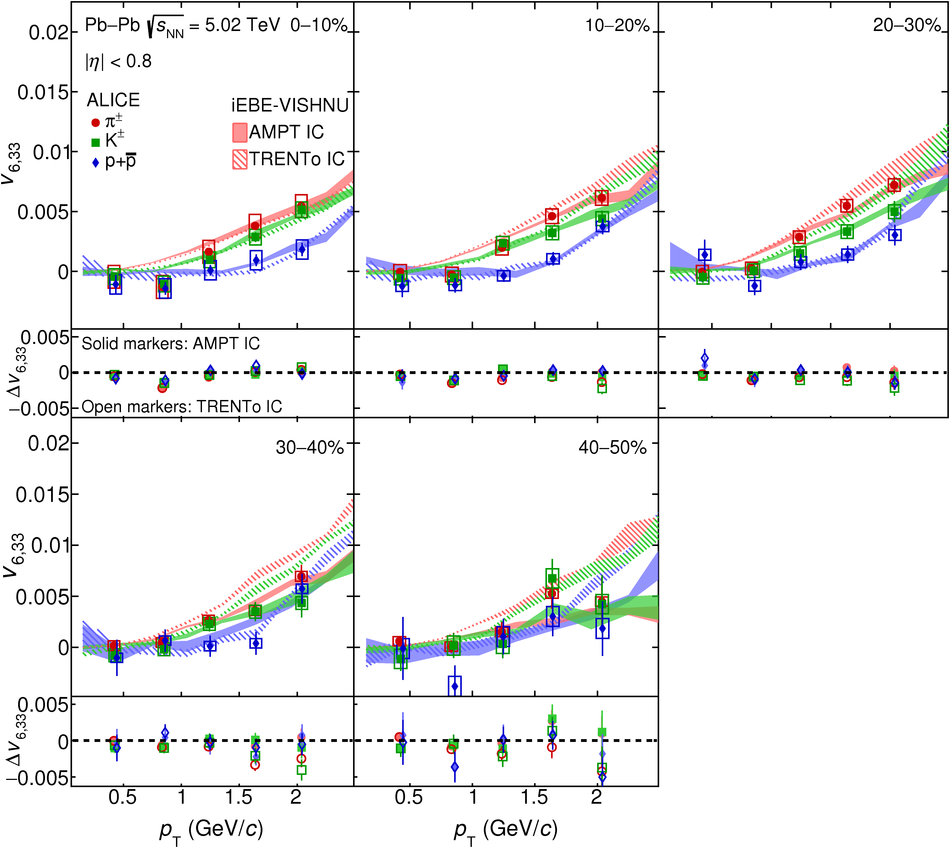 |
Figure 18
The \pT-differential $v_{6,222}$ of \pion, \kaon and \proton in the 0--10\% up to 50--60\% centrality intervals of Pb--Pb collisions at \sNN compared with iEBE-VISHNU hybrid models with two different sets of initial parameters: AMPT initial conditions ($\eta/s$= 0.08 and $\zeta/s$ = 0) shown as solid bands and \trento initial conditions ($\eta/s({\rm T})$ and $\zeta/s({\rm T})$) as hatched bands. The bottom panels show the difference between the measurements and each model. Statistical and systematic uncertainties are shown as bars and boxes, respectively. | 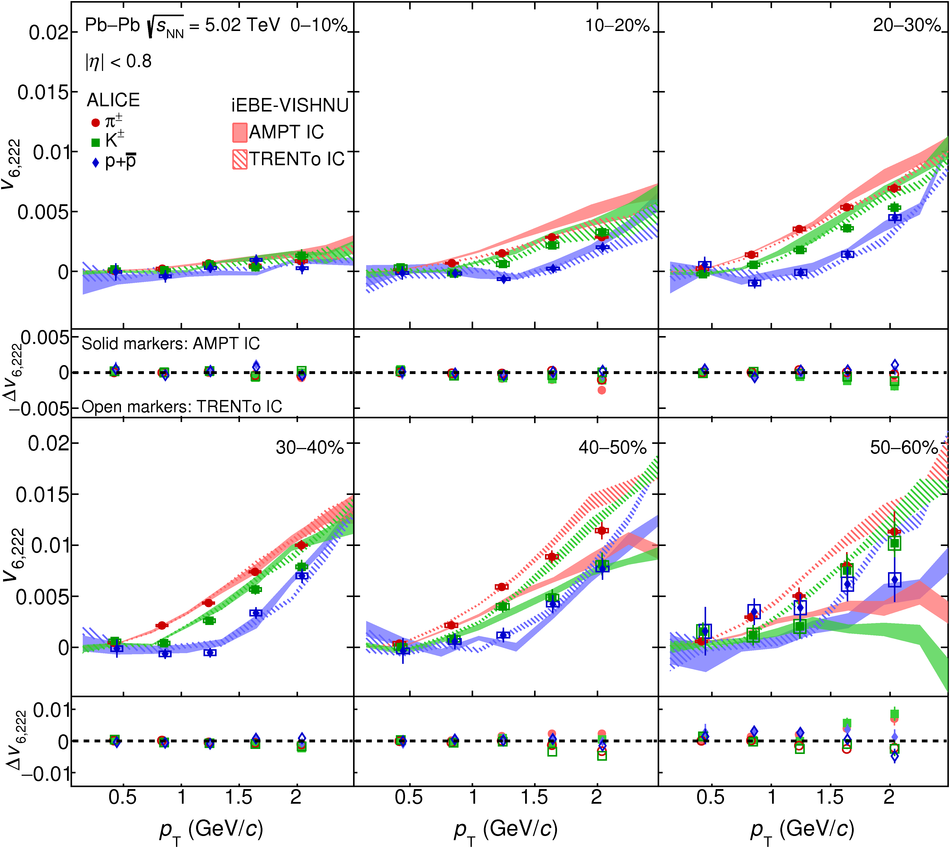 |
Figure 19
The \pT-differential $v_{4,22}$ of \Ks and \lambdas in the 0--10\% up to 50--60\% centrality intervals of Pb--Pb collisions at \sNN compared with iEBE-VISHNU hybrid models with two different sets of initial parameters: AMPT initial conditions ($\eta/s$= 0.08 and $\zeta/s$ = 0) shown as solid bands and \trento initial conditions ($\eta/s({\rm T})$ and $\zeta/s({\rm T})$) as hatched bands. The bottom panels show the difference between the measurements and each model. Statistical and systematic uncertainties are shown as bars and boxes, respectively. | 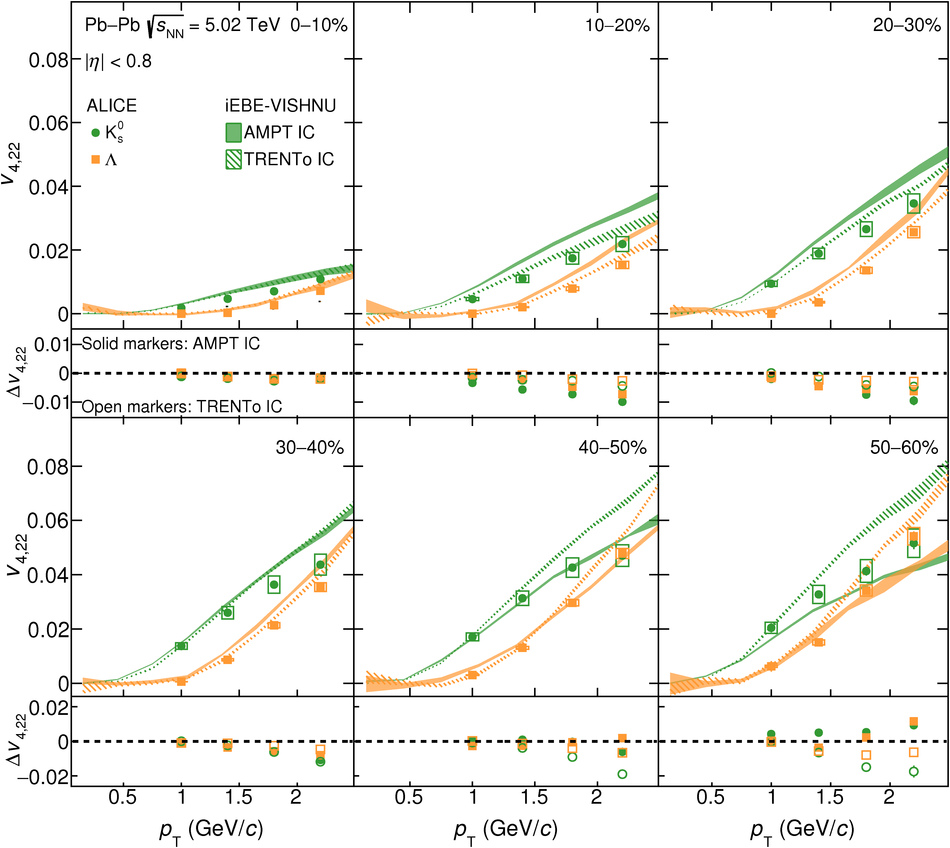 |
Figure 20
The \pT-differential $v_{5,32}$ of \Ks and \lambdas in the 0--10\% up to 50--60\% centrality intervals of Pb--Pb collisions at \sNN compared with iEBE-VISHNU hybrid models with two different sets of initial parameters: AMPT initial conditions ($\eta/s$= 0.08 and $\zeta/s$ = 0) shown as solid bands and \trento initial conditions ($\eta/s({\rm T})$ and $\zeta/s({\rm T})$) as hatched bands. The bottom panels show the difference between the measurements and each model. Statistical and systematic uncertainties are shown as bars and boxes, respectively. |  |
Figure 21
The \pT-differential $v_{6,33}$ of \Ks and \lambdas in the 0--10\% up to 40--50\% centrality intervals of Pb--Pb collisions at \sNN compared with iEBE-VISHNU hybrid models with two different sets of initial parameters: AMPT initial conditions ($\eta/s$= 0.08 and $\zeta/s$ = 0) shown as solid bands and \trento initial conditions ($\eta/s({\rm T})$ and $\zeta/s({\rm T})$) as hatched bands. The bottom panels show the difference between the measurements and each model. Statistical and systematic uncertainties are shown as bars and boxes, respectively. |  |
Figure 22
The $(m_{\rm{T}} - m_{0})/n_{q}$-dependence of $v_{4,22}/n_{q}$ for different particle species grouped into different centrality intervals of Pb--Pb collisions \sNN. Statistical and systematic uncertainties are shown as bars and boxes, respectively. It is seen that the $\rm KE_{T}$ scaling holds for $v_{4,22}$ at an approximate level. |  |
Figure 23
The $(m_{\rm{T}} - m_{0})/n_{q}$-dependence of $v_{5,32}/n_{q}$ for different particle species grouped into different centrality intervals of Pb--Pb collisions \sNN. Statistical and systematic uncertainties are shown as bars and boxes, respectively. It is seen that the $\rm KE_{T}$ scaling holds for $v_{5,32}$ at an approximate level. | 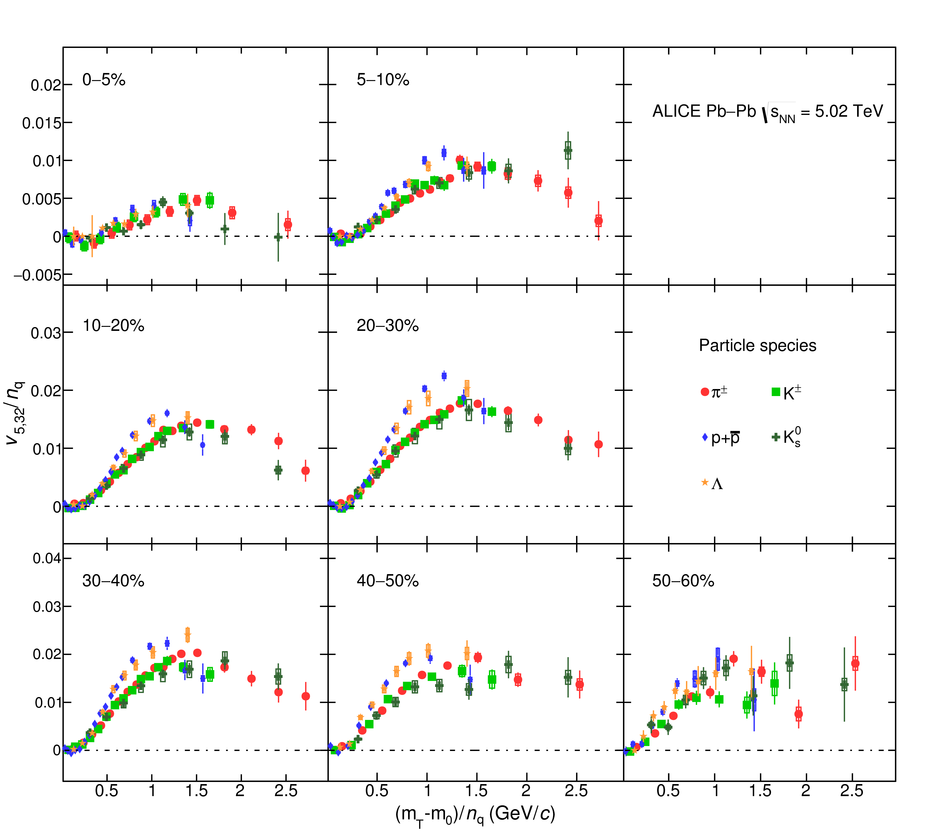 |
Figure 24
The $(m_{\rm{T}} - m_{0})/n_{q}$-dependence of $v_{6,33}/n_{q}$ for different particle species grouped into different centrality intervals of Pb--Pb collisions \sNN. Statistical and systematic uncertainties are shown as bars and boxes, respectively. It is seen that the $\rm KE_{T}$ scaling holds for $v_{6,33}$ at an approximate level. |  |
Figure 25
The $(m_{\rm{T}} - m_{0})/n_{q}$-dependence of $v_{6,222}/n_{q}$ for different particle species grouped into different centrality intervals of Pb--Pb collisions \sNN. Statistical and systematic uncertainties are shown as bars and boxes, respectively. It is seen that the $\rm KE_{T}$ scaling holds for $v_{6,222}$ at an approximate level. | 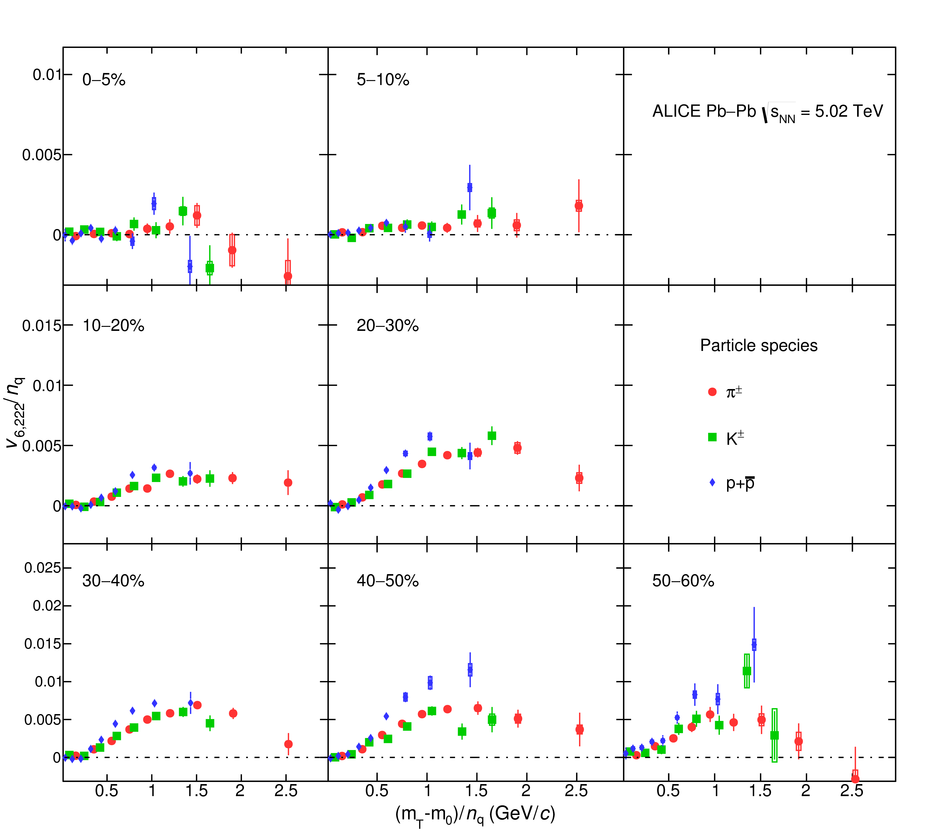 |
Figure 26
The $(m_{\rm{T}} - m_{0})/n_{q}$-dependence of $v_{4,22}/n_{q}$ for different particle species grouped into different centrality intervals of Pb--Pb collisions \sNN. Statistical and systematic uncertainties are shown as bars and boxes, respectively. It is seen that the $\rm KE_{T}$ scaling holds for $v_{4,22}$ at an approximate level. | 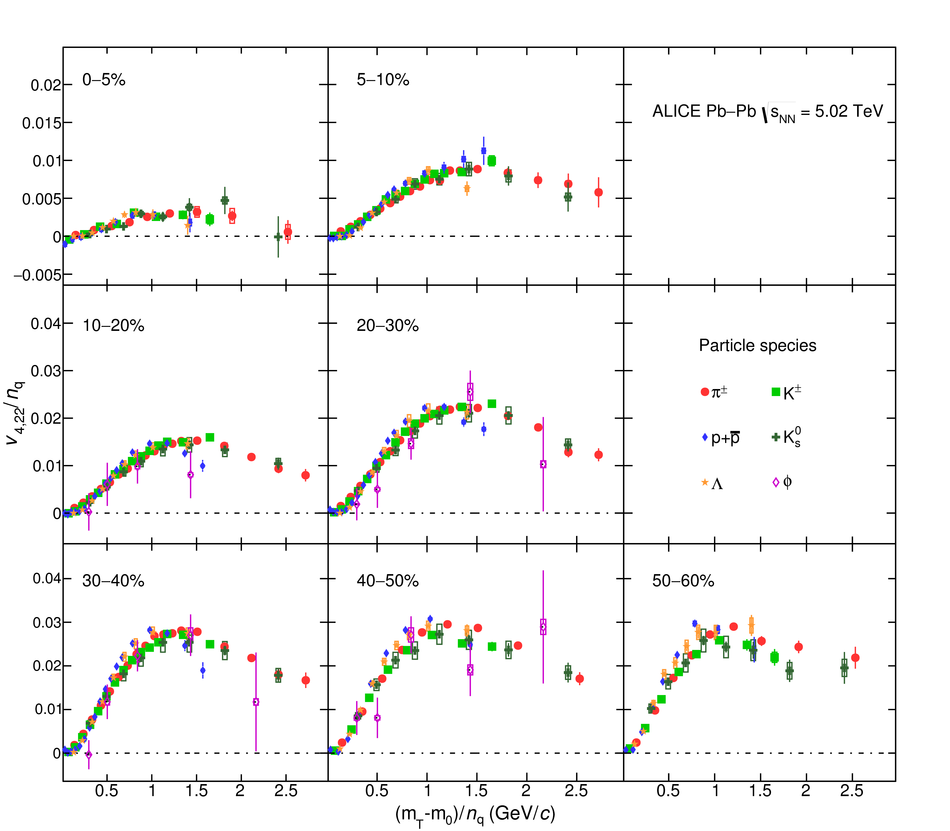 |
Figure 27
The $(m_{\rm{T}} - m_{0})/n_{q}$-dependence of $v_{5,32}/n_{q}$ for different particle species grouped into different centrality intervals of Pb--Pb collisions \sNN. Statistical and systematic uncertainties are shown as bars and boxes, respectively. It is seen that the $\rm KE_{T}$ scaling holds for $v_{5,32}$ at an approximate level. |  |
Figure 28
The $(m_{\rm{T}} - m_{0})/n_{q}$-dependence of $v_{6,33}/n_{q}$ for different particle species grouped into different centrality intervals of Pb--Pb collisions \sNN. Statistical and systematic uncertainties are shown as bars and boxes, respectively. It is seen that the $\rm KE_{T}$ scaling holds for $v_{6,33}$ at an approximate level. | 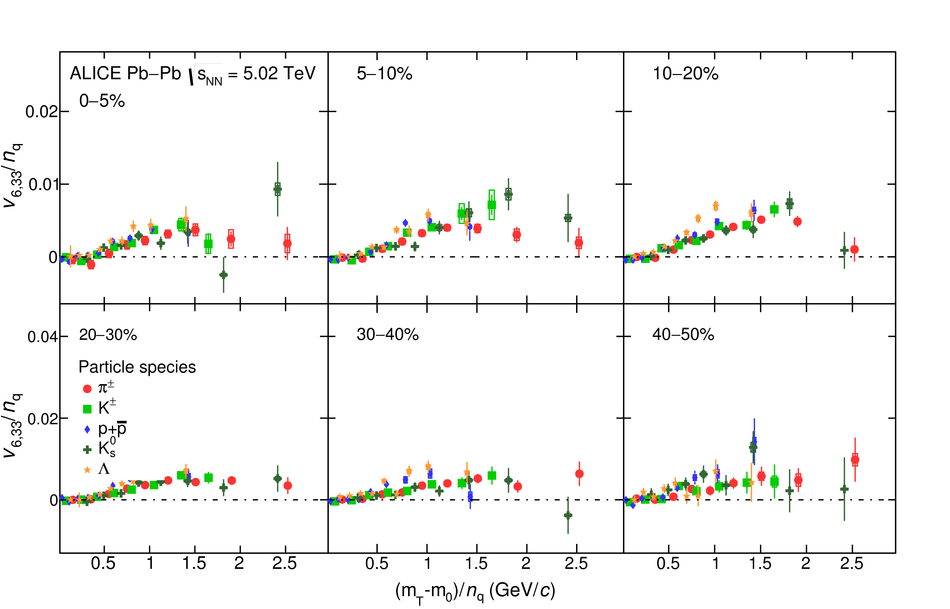 |
Figure 29
The $(m_{\rm{T}} - m_{0})/n_{q}$-dependence of $v_{6,222}/n_{q}$ for different particle species grouped into different centrality intervals of Pb--Pb collisions \sNN. Statistical and systematic uncertainties are shown as bars and boxes, respectively. It is seen that the $\rm KE_{T}$ scaling holds for $v_{6,222}$ at an approximate level. |  |