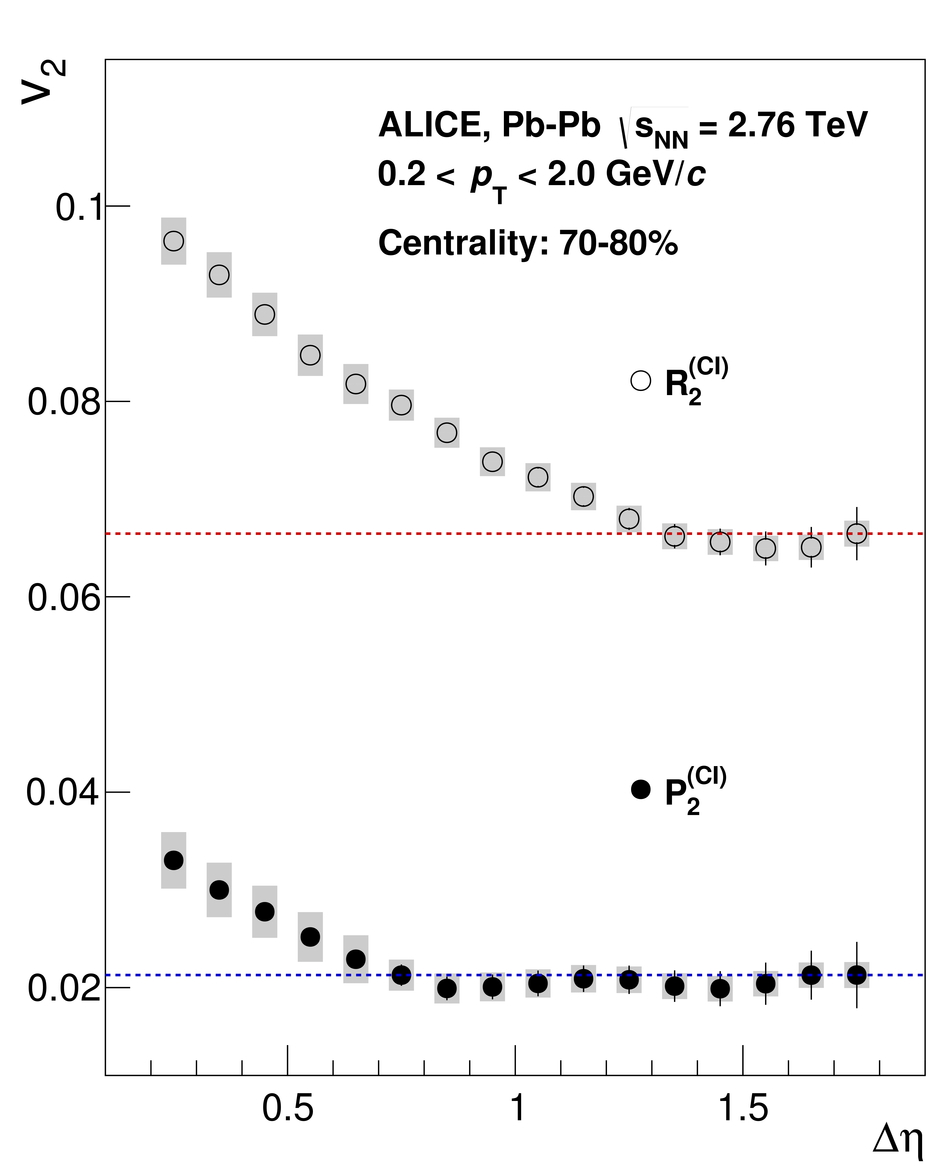
Coefficients $v_2$ (left) and $v_3$ (right) as a function of $|\Delta\eta|$ obtained from $P_2^{\rm CI}$ and $R_2^{\rm CI}$ correlation functions in the 70--80\% centrality interval in Pb--Pb collisions. Dotted lines show baselines drawn at $v_n$($|\Delta\eta|=1.75$). Vertical bars and shaded areas indicate statistical and systematic uncertainties, respectively. |   |