Fourier coefficients with $n=2,3,4$obtained in $P_{2}$ for US and LS charge-correlations in the ranges$0.2 \leq |\Delta\eta| \leq 0.9$ and $0.9 \leq |\Delta\eta| \leq 1.9$ in panels(a) and (b), respectively. The ratios between US and LS $v_{n}$coefficients are shown in panels (c) and (d). Vertical bars and shaded areas indicate statistical and systematic uncertainties, respectively. | 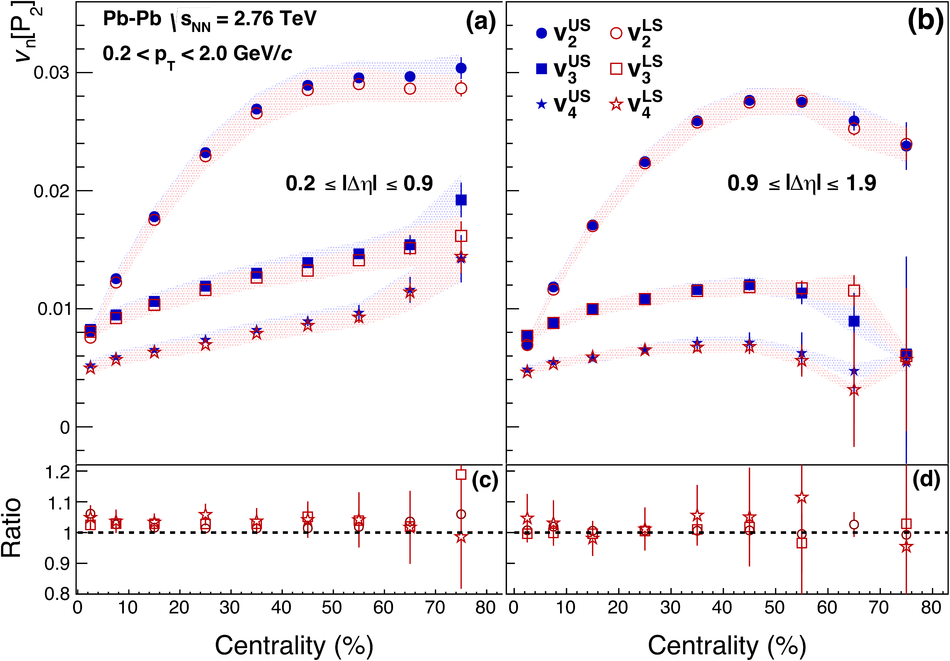 |