Width of the near-side peak of $R_2^{\rm (CD)}$ correlation functions along $ \Delta \eta $ (left) and $\Delta \varphi$ (right) measured in \PbPb\ collisions as a function of collision centrality class. Vertical bars and solid lines represent statistical and systematic uncertainties, respectively. Mean and RMS $\Delta \varphi$ widths (right: blue circles) were computed in the range $-\pi \le \Delta\varphi \le \pi$ with an offset according to Eq. (\ref{Eq:widthR2Phi}). Red symbols show RMS $\Delta\eta$ and $\Delta\varphi$ widths (systematic uncertainties shown as red dashed lines) reported by a prior ALICE analysis based on measurements of balance functions . The $\Delta\varphi$ widths reported in this earlier work were computed in the range $-\pi/2 \le \Delta\varphi \le \pi/2$. | 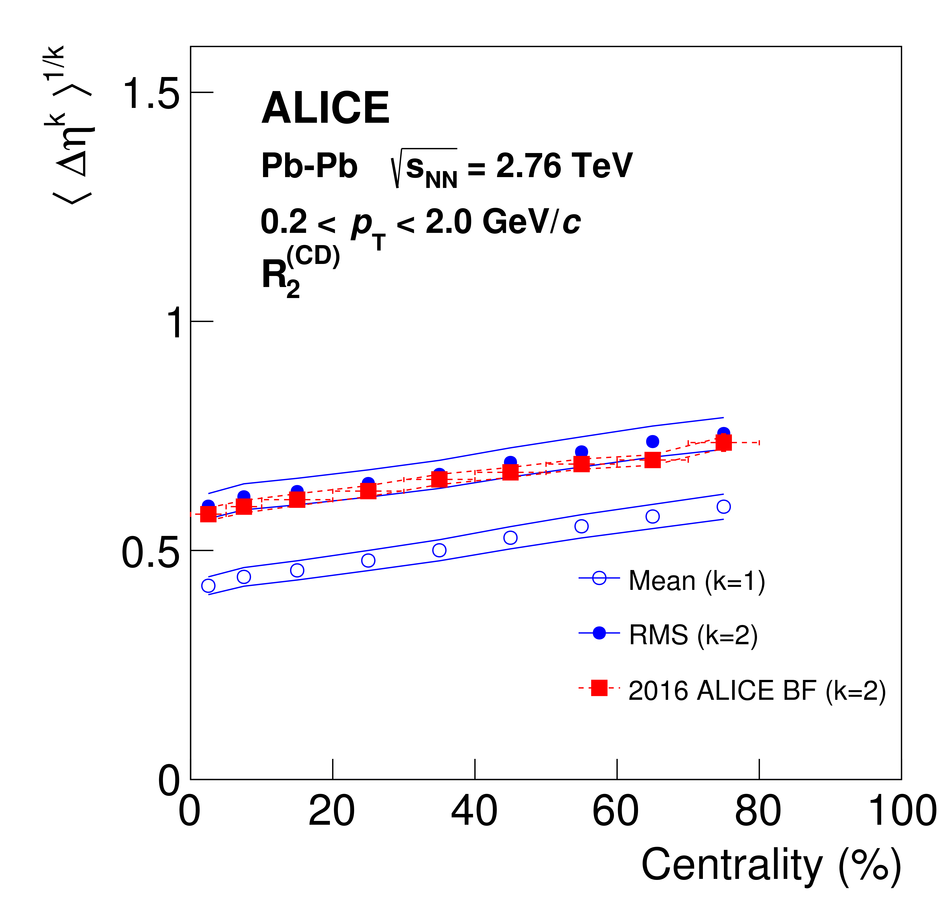 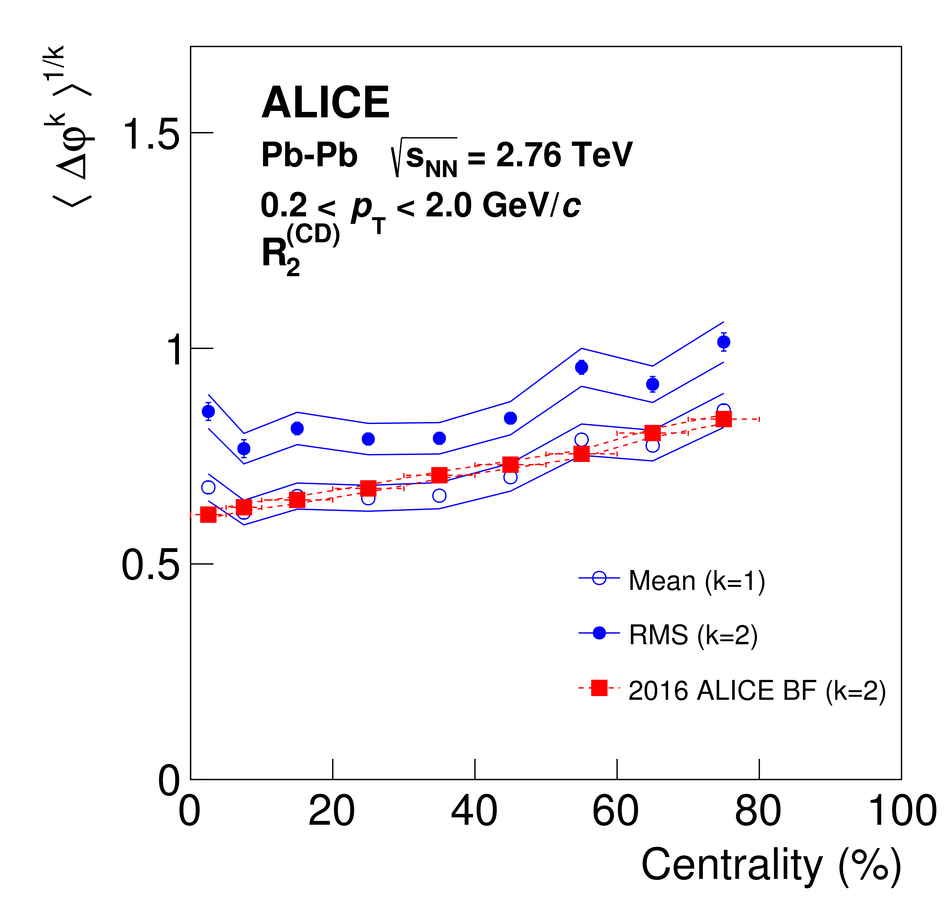 |