This Letter presents the first direct investigation of the p-$\Sigma^{0}$ interaction, using the femtoscopy technique in high-multiplicity pp collisions at $\sqrt{s}$ = 13 TeV measured by the ALICE detector. The $\Sigma^{0}$ is reconstructed via the decay channel to $\Lambda \gamma$, and the subsequent decay of $\Lambda$ to p$\pi^-$. The photon is detected via the conversion in material to e$^{+}$e$^{-}$ pairs exploiting the unique capability of the ALICE detector to measure electrons at low transverse momenta. The measured p-$\Sigma^{0}$ correlation indicates a shallow strong interaction. The comparison of the data to several theoretical predictions obtained employing the $Correlation~Analysis~Tool~using~the~Schr\"odinger~Equation$ (CATS) and the Lednick\'y-Lyuboshits approach shows that the current experimental precision does not yet allow to discriminate between different models, as it is the case for the available scattering and hypernuclei data. Nevertheless, the p-$\Sigma^{0}$ correlation function is found to be sensitive to the strong interaction, and driven by the interplay of the different spin and isospin channels. This pioneering study demonstrates the feasibility of a femtoscopic measurement in the p-$\Sigma^{0}$ channel and with the expected larger data samples in LHC Run 3 and Run 4, the p-$\Sigma^{0}$ interaction will be constrained with high precision.
PLB805 (2020) 135419
HEP Data
e-Print: arXiv:1910.14407 | PDF | inSPIRE
CERN-EP-2019-232
Figure 1
Invariant mass distribution of the $\Lambda\phot$ and $\overline{\Lambda}\phot$ candidates, in two \pt intervals of $1.5 - 2.0$\,\GeVc and $6.5 - 7.0$\,\GeVc. The signal is described by a single Gaussian, and the background by a polynomial of third order. The number of \siZ candidates is evaluated within $M_{\siZ}(\pt) \pm 3$\,\MeVmass. Only statistical uncertainties are shown. |  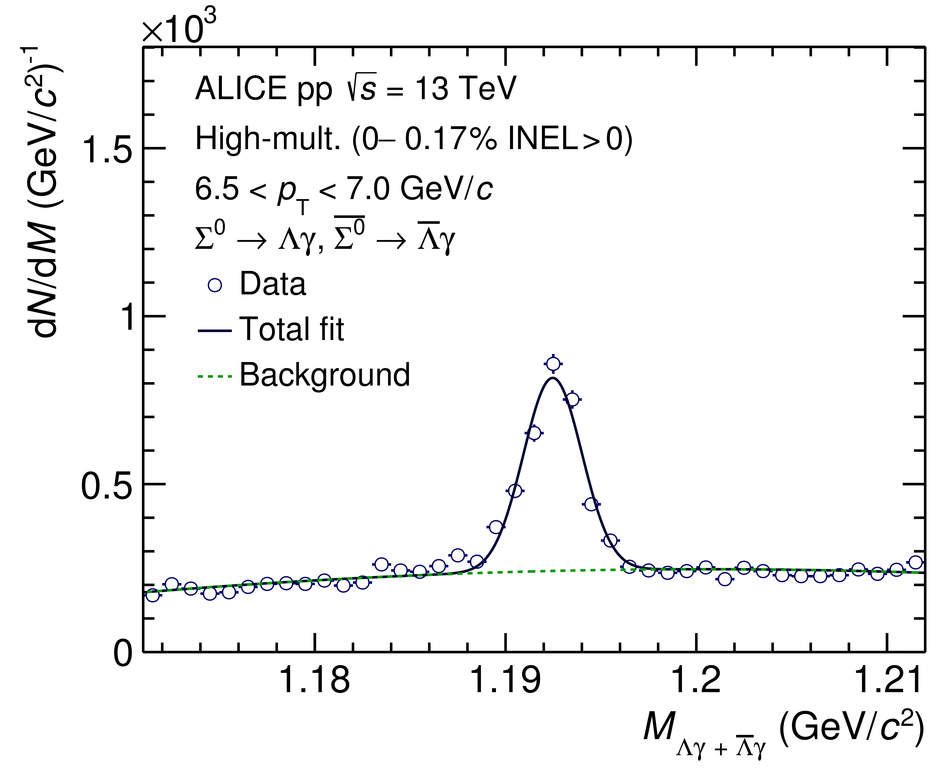 |
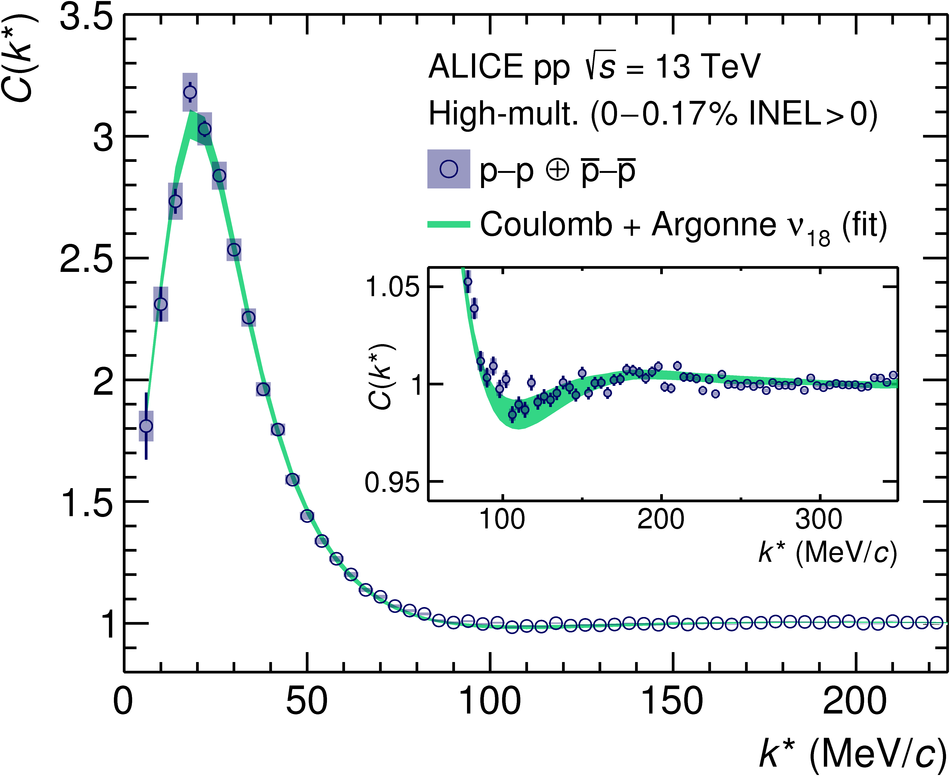
Figure 3
Measured correlation function of \psiZCombCF. Statistical (bars) and systematic uncertainties (boxes) are shown separately. The gray band denotes the \pSBCF baseline. The data are compared with different theoretical models. The corresponding correlation functions are computed using CATS for \chiEFT , \NSC and \ESC , and using the \Ledn for \fss . The width of the bands corresponds to one standard deviation of the systematic uncertainty of the fit. The absolute correlated uncertainty due to the modeling of the \pSBCF baseline is shown separately as the hatched area at the bottom of the figure. |  |