This paper presents the first measurements of the charge independent (CI) and charge dependent (CD) two-particle transverse momentum correlators $G_{2}^{\rm CI}$ and $G_{2}^{\rm CD}$ in Pb--Pb collisions at $\sqrt{s_{\text{NN}}} = 2.76\;\text{\TeVe}$ by the ALICE collaboration. The two-particle transverse momentum correlator $G_{2}$ was introduced as a measure of the momentum current transfer between neighbouring system cells. The correlators are measured as a function of pair separation in pseudorapidity ($\Delta \eta$) and azimuth ($\Delta \varphi$) and as a function of collision centrality. From peripheral to central collisions, the correlator $G_{2}^{\rm CI}$ exhibits a longitudinal broadening while undergoing a monotonic azimuthal narrowing. By contrast, $G_{2}^{\rm CD}$ exhibits a narrowing along both dimensions. These features are not reproduced by models such as HIJING and AMPT. However, the observed narrowing of the correlators from peripheral to central collisions is expected to result from the stronger transverse flow profiles produced in more central collisions and the longitudinal broadening is predicted to be sensitive to momentum currents and the shear viscosity per unit of entropy density $\eta/s$ of the matter produced in the collisions. The observed broadening is found to be consistent with the hypothesized lower bound of $\eta/s$ and is in qualitative agreement with values obtained from anisotropic flow measurements.
PLB 804 (2020) 135375
HEP Data
e-Print: arXiv:1910.14393 | PDF | inSPIRE
CERN-EP-2019-252
Figure 1
Two-particle transverse momentum correlations $G_{2}^{\rm CI}$ (top) and their longitudinal (middle) and azimuthal (bottom) projections for the most central (left), semi-central (center) and peripheral (right) \PbPb\ collisions at $\sqrt{s_{\rm NN}}=2.76\;\text{\TeVe}$. Vertical bars (mostly smaller than the marker size) and shaded blue bands represent statistical and systematic uncertainties, respectively. The systematic uncertainty on the long-range mean correlator strength is quoted as $\delta B$ in both projections. Under-corrected correlator values at $\Delta\eta,\Delta\varphi=0$ are not shown. See text for details. | 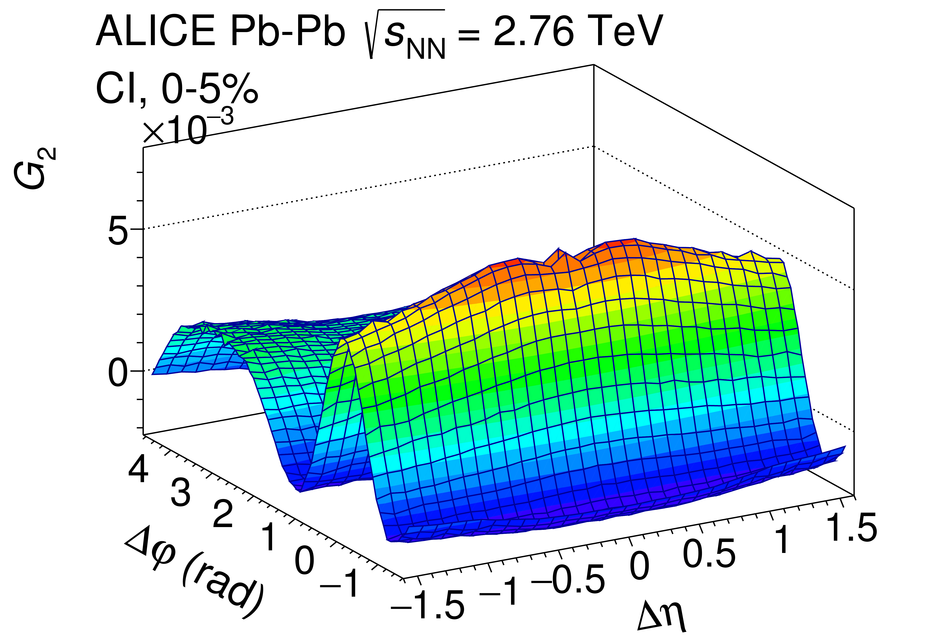  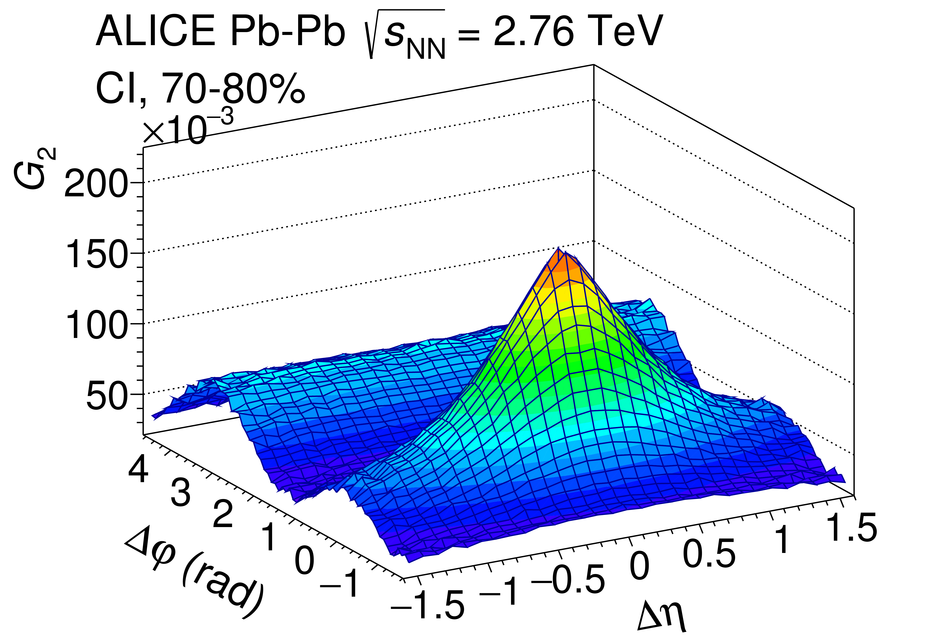 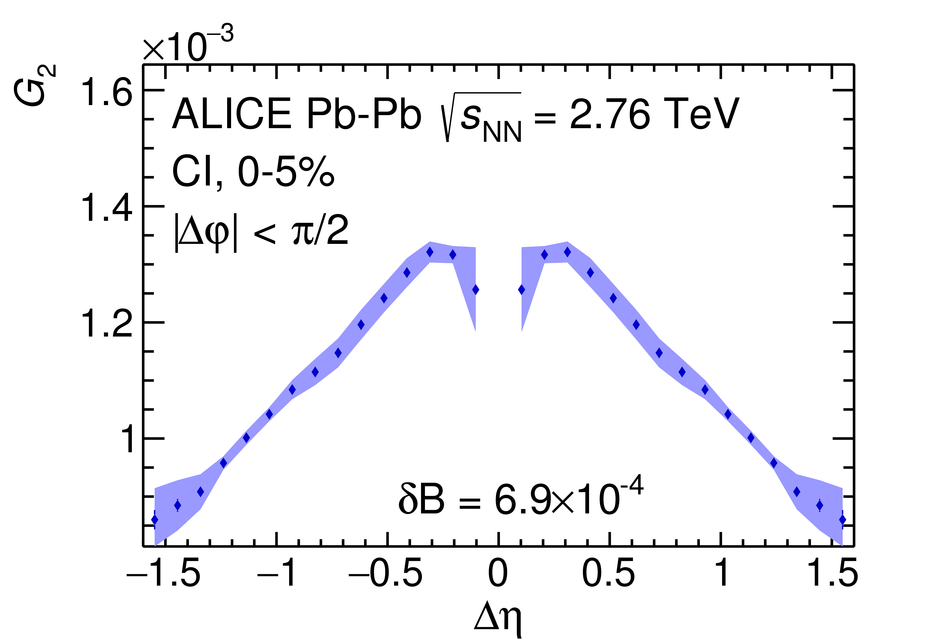 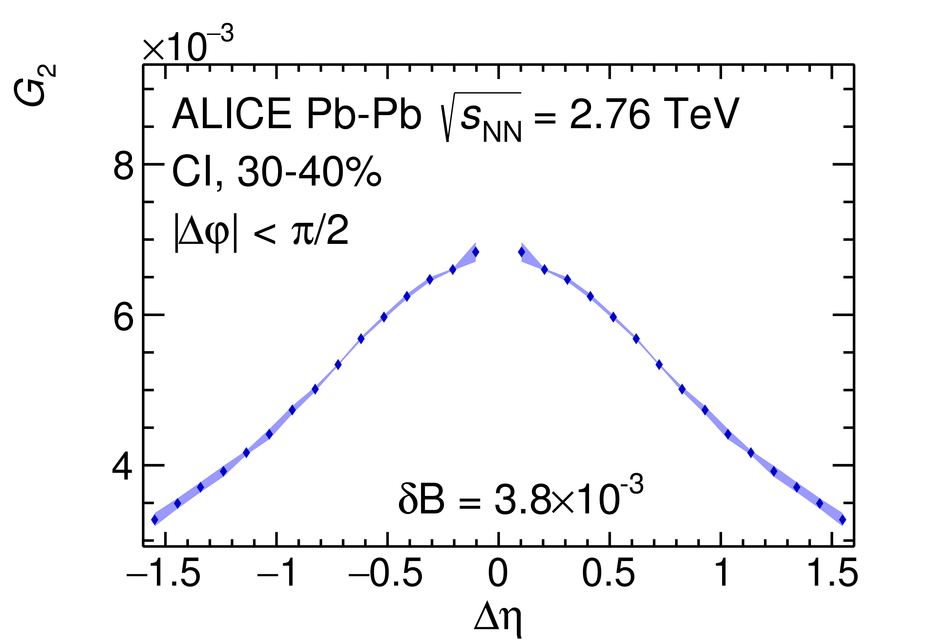 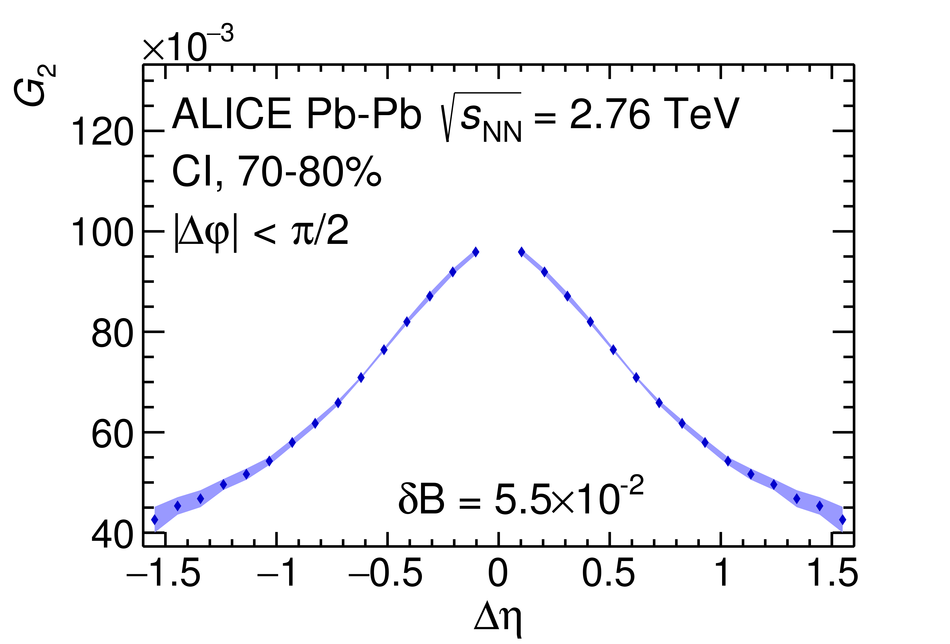 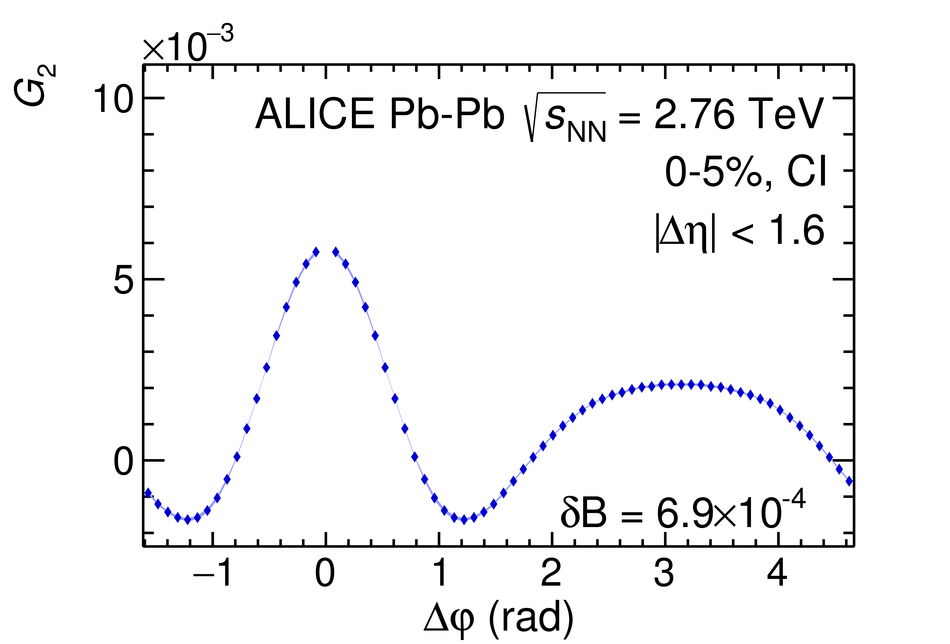  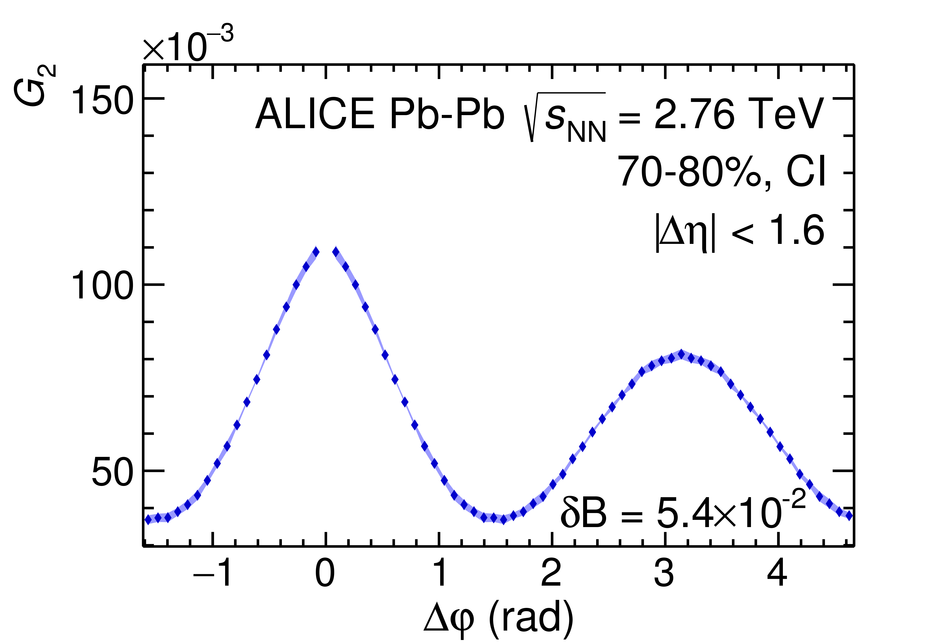 |
Figure 2
Top panels: collision centrality evolution of the longitudinal (left) and azimuthal (right) widths of the $G_{2}$ CD and CI correlators measured in Pb--Pb collisions at $\sqrt{s_{\rm{NN}}} = 2.76\;\text{\TeVe}$. Central and bottom panels: width evolution relative to the value in the most peripheral collisions of the two-particle transverse momentum correlations $G_{2}^{\rm CI}$ (central) and $G_{2}^{\rm CD}$ (bottom) along the longitudinal (left) and azimuthal (right) dimensions. Data are compared with HIJING and AMPT model expectations. In data, vertical bars and shaded bands represent statistical and systematic uncertainties, respectively. For models, shaded bands represent statistical uncertainties. | 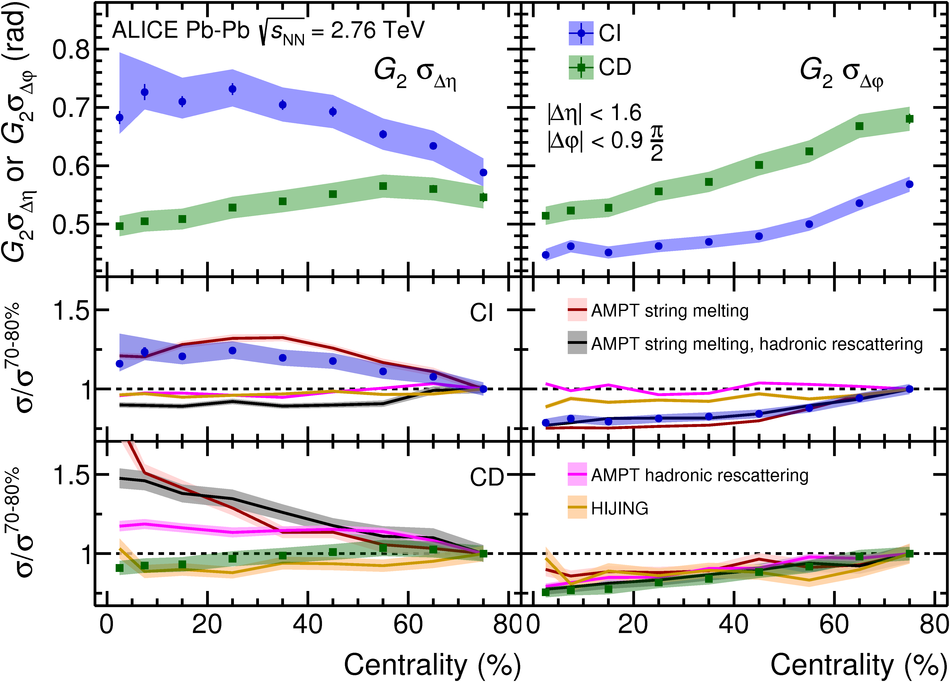 |
Figure 3
Left panel: collision centrality evolution of the longitudinal width of number correlator $R_2^{\rm CD}$ and transverse momentum correlators $P_2^{\rm CD}$ and $G_2^{\rm CD}$. Central panel: idem for the azimuthal width of $R_2^{\rm CD}$, $P_2^{\rm CD}$ and $G_2^{\rm CD}$. Right panel: collision centrality evolution of the longitudinal width of $R_2^{\rm CI}$, $P_2^{\rm CI}$, and $G_2^{\rm CI}$. Data for $R_2$ and $P_2$ are from . Vertical bars and shaded bands represent statistical and systematic uncertainties, respectively. | 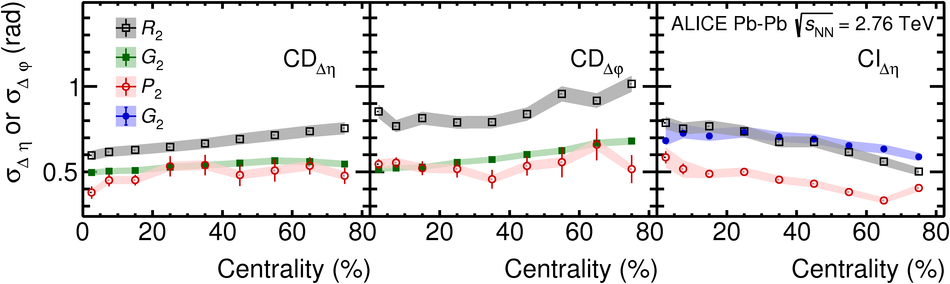 |
Figure 4
Two-particle transverse momentum correlation $G_{2}^{\rm{CI}}$ longitudinal width evolution with the number of participants in Au--Au collisions at $\sqrt{s_{\rm{NN}}}=200\;\text{\GeVe}$ and in Pb--Pb collisions at $\sqrt{s_{\rm{NN}}}=2.76\;\text{\TeVe}$, measured in this work, using the bi-dimensional fit described in the text (2D) and the method used by the STAR experiment (1D). For completeness, STAR RMS low limit is also shown. |  |
Figure 5
Expected longitudinal widths for the most central collisions of the two-particle transverse momentum correlation $G_{2}^{\rm{CI}}$ for different values of $\eta/s$ by using the expression suggested in . Data point error bars represent total uncertainties obtained by adding in quadrature statistical and systematic uncertainties. In the formula $\sigma_{\rm c}$ is the longitudinal width for the most central collisions inferred by using this expression and represented for each of the $\etas$ values by the color discontinuous bands (continuous for $\eta/s=1/4\pi$) at the highest number of participants, $\sigma_{0}$ is the longitudinal width for the most peripheral collisions (only two participants) which is obtained by extrapolating the fit, $T_{\rm c}$ is the critical temperature, $\tau_{0}$ is the formation time and $\tau_{\rm c,f}$ the freeze-out time. Error caps in the same color as the discontinuous bands, represent uncertainties of the inferred longitudinal widths for the most central collisions (see text for details). | 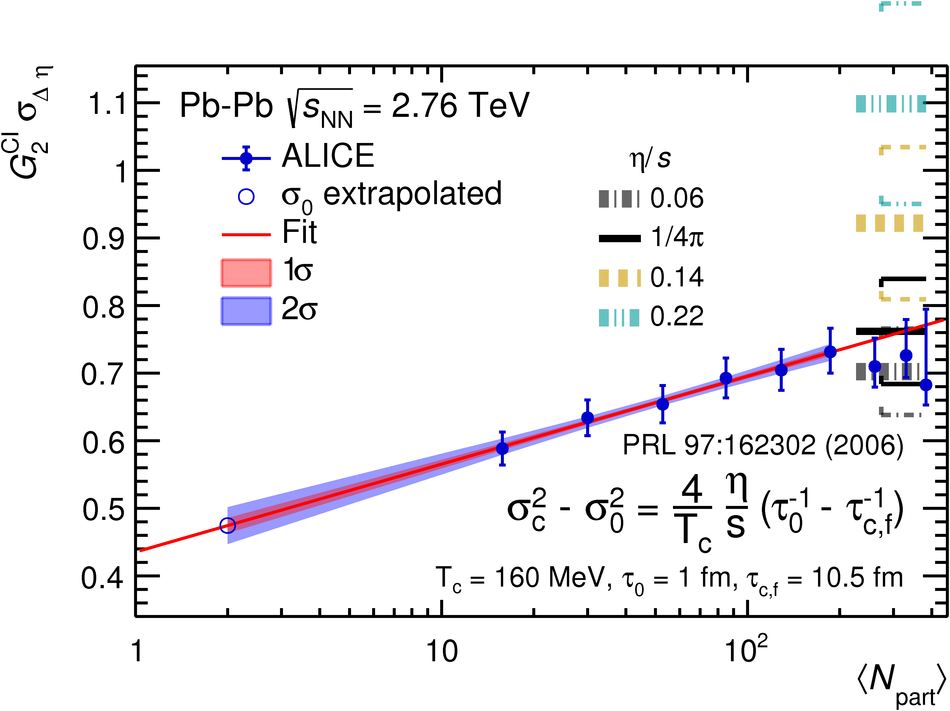 |