The \pP (a), \pL (b) and \LL (c) correlation function with a simultaneous fit with the NLO expansion (red line) for the scattering parameter of \pL \cite{Haidenbauer:2013oca}. The dashed line denotes the linear baseline. After the fit is performed the LO \cite{POLINDER2006244} parameter set (green curve) is plugged in for the \pL system and the scattering length obtained from \cite{Adamczyk:2014vca} for the \LL system (cyan curve). | 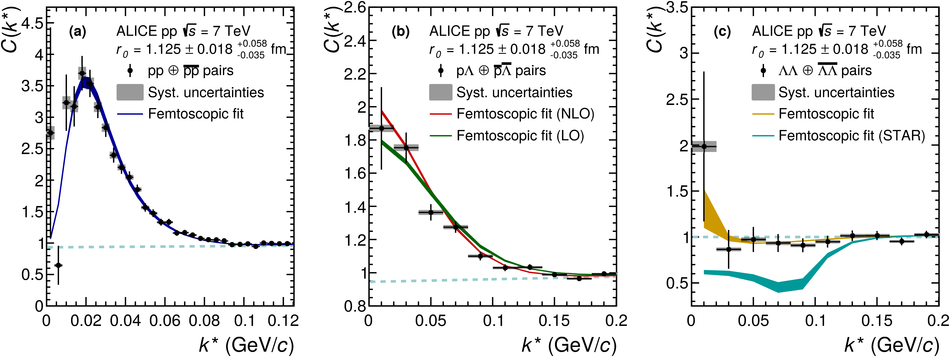 |