Left: Central value (solid red line) and uncertainty of the direct-photon $v_2$ for a selected $\pT$ interval. The upper and lower edges of the red shaded area correspond to the total uncertainty of $\vdirg$ as obtained from linear Gaussian propagation of the uncertainties $\sigma(\vincg)$ and $\sigma(\vdecg)$. The Gaussian (with arbitrary normalization) reflects the measured value of $\Rg$ in this $\pT$ interval (blue dashed line) and its $\pm 1\sigma$ uncertainty (dark-blue shaded interval). Right: Posterior distribution of the true value of $\vdirg$ for the same interval in the Bayesian approach Note that the distribution has a non-Gaussian shape, implying that the $\pm$2$\sigma$ interval typically corresponds to a probability of less than 95.45\ | 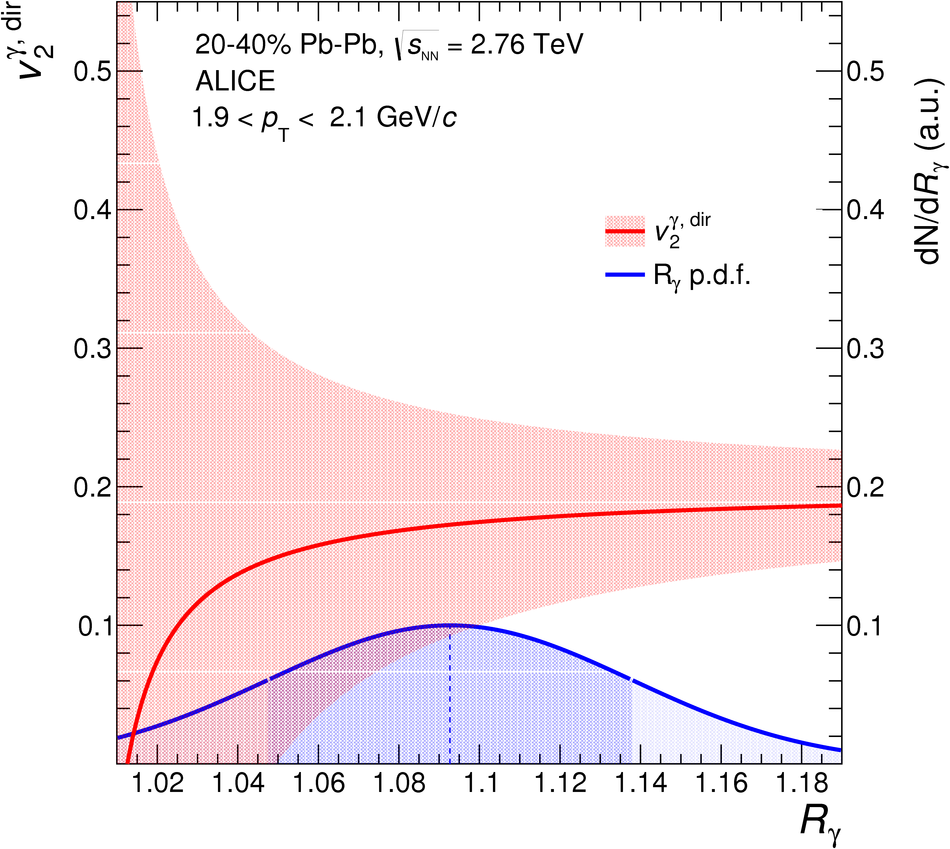 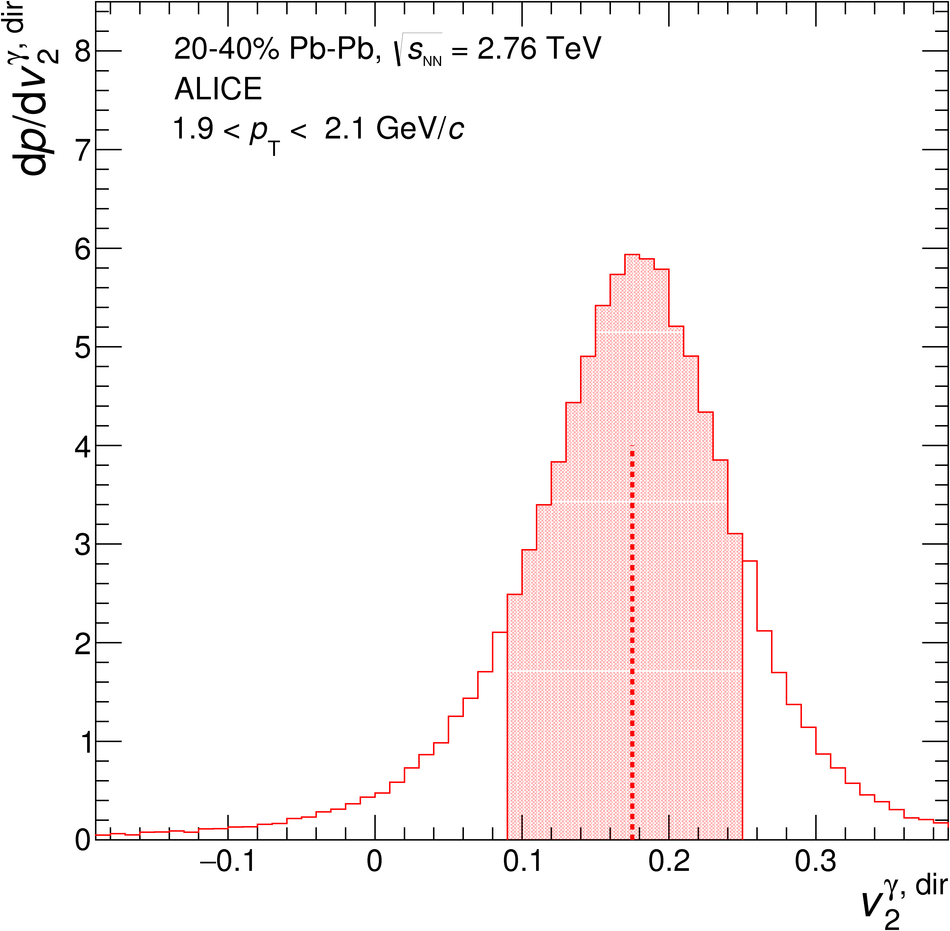 |