The production cross section of inclusive isolated photons has been measured by the ALICE experiment at the CERN LHC in pp collisions at a centre-of-momentum energy of $\sqrt{s}=$ 7 TeV. The measurement is performed with the electromagnetic calorimeter EMCal and the central tracking detectors, covering a range of $|\eta|<~0.27$ in pseudorapidity and a transverse momentum range of $ 10 <~ p_{\rm T}^{\gamma} <~ $ 60 GeV/$c$. The result extends the $p_{\rm T}$ coverage of previously published results of the ATLAS and CMS experiments at the same collision energy to smaller $p_{\rm T}$. The measurement is compared to next-to-leading order perturbative QCD calculations and to the results from the ATLAS and CMS experiments. All measurements and theory predictions are in agreement with each other.
Eur. Phys. J. C (2019) 79: 896
HEP Data
e-Print: arXiv:1906.01371 | PDF | inSPIRE
Figure 1
The scale $Q$ (left), and the fraction $x$ (right) of longitudinal momentum of the initial state partons of the hard process for photon production at midrapidity versus photon \pt\ for pp collisions at $\sqrt s = 7$ TeV, from a PYTHIA 8 simulation. The $x$ values of both partons are used here. The solid red line shows the median of the distribution in the parameters, while the red bands indicate the 68\ | 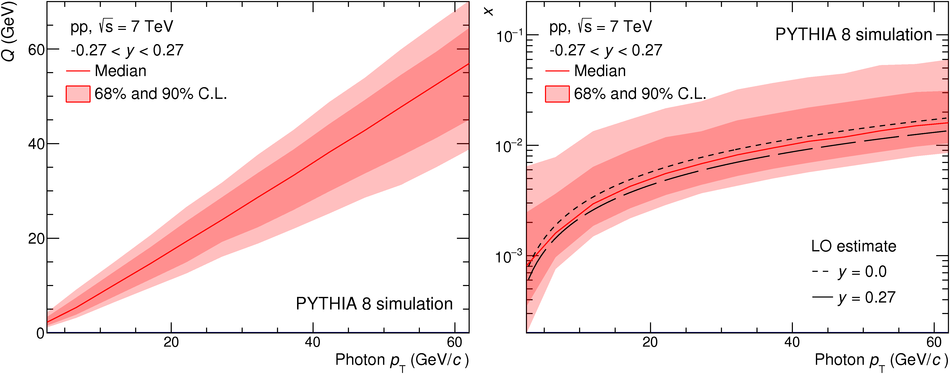 |
Figure 2
Left: Shower shape parameter \shshlo\ versus neutral cluster \pt. The band limited by the black dashed lines indicates the area populated by single photons and defines the photon selection cuts (narrow clusters) used in the analysis. Right: Distributions of the shower shape parameterfor different types of clusters produced by single photons (red bullets) or overlapped photons from \piz\ decays (black bullets) for different cluster energies from PYTHIA 6 $\gamma$-jet and jet-jet simulations with GEANT3 tuned for cross-talk emulation. A line at $\shshlo=0.3$ represents the cut used to select narrow clusters at $\ptg > 18$\,\GeVc. All distributions are normalised to an integral of 1. In the left plot each \pt\ bin is separately normalised to 1. |  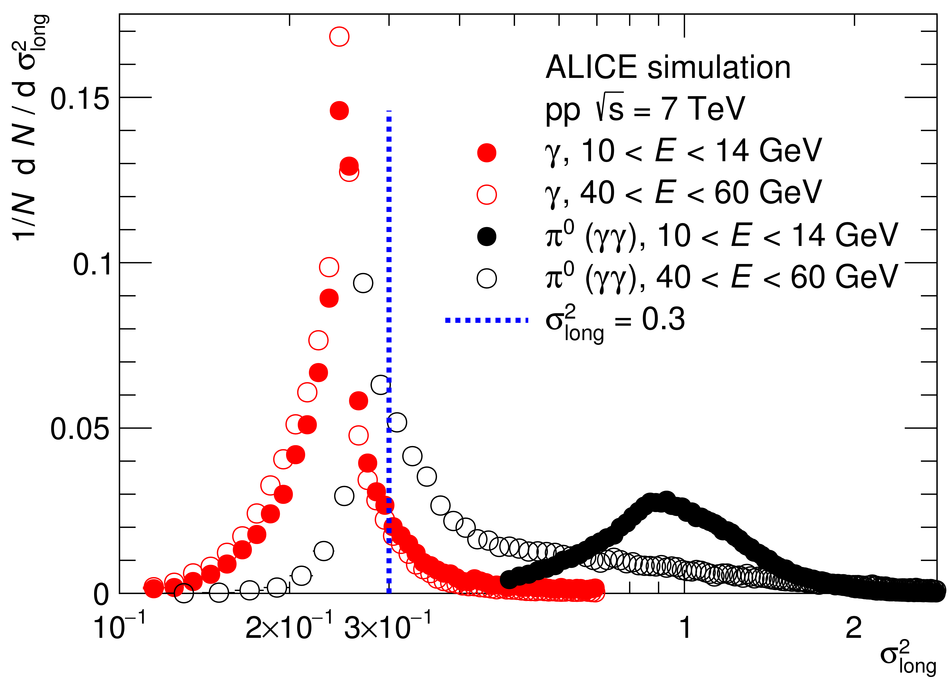 |
Figure 3
Distributions of the shower shape parameter $\shshlo$ of neutral clusters in data and simulations as used in this analysis. The different panels show different neutral cluster \pt\ intervals. All distributions are normalised to the integral. Data are shown as black histograms and simulations, PYTHIA 6 jet-jet $+$ $\gamma$-jet events, with GEANT3 default settings in blue. The red histograms are also simulations based on GEANT3, but tuned to reproduce the cross-talk observed in the EMCal electronics. |  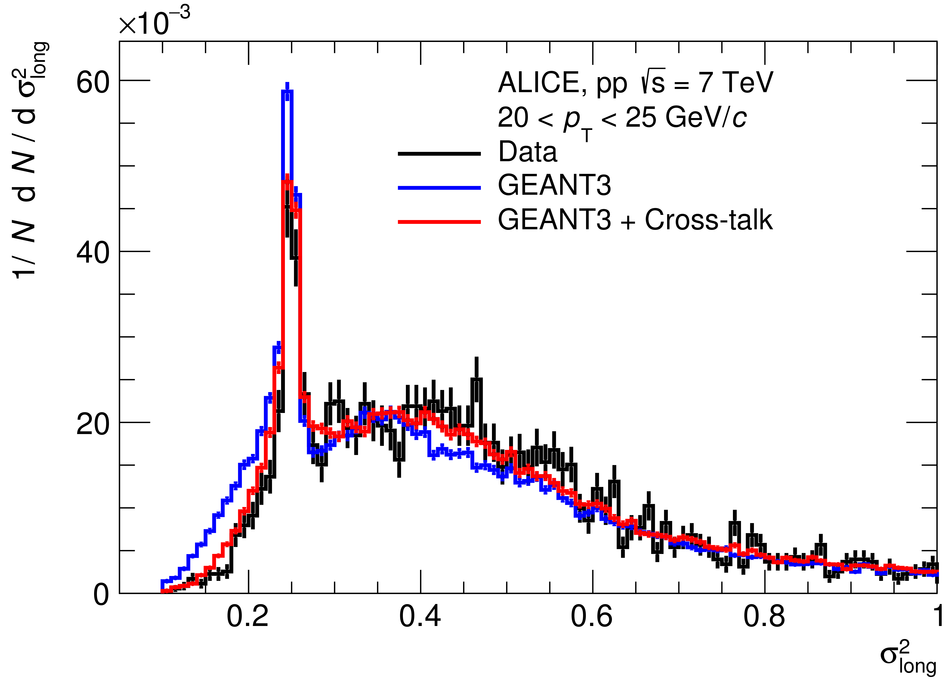 |
Figure 4
Illustration of the parametric-space of the photon isolation momentum and the shower width parameter (\shshlo), used to estimate the background yield in the signal region ($\mathbb{A}$) from the observed yields in the three control regions ($\mathbb{B}$, $\mathbb{C}$, $\mathbb{D}$). The red regions indicate areas dominated by background and the blue regions those that contain the photon signal. The colour gradient between these regions illustrates the presence of a signal contribution in the three background zones. |  |


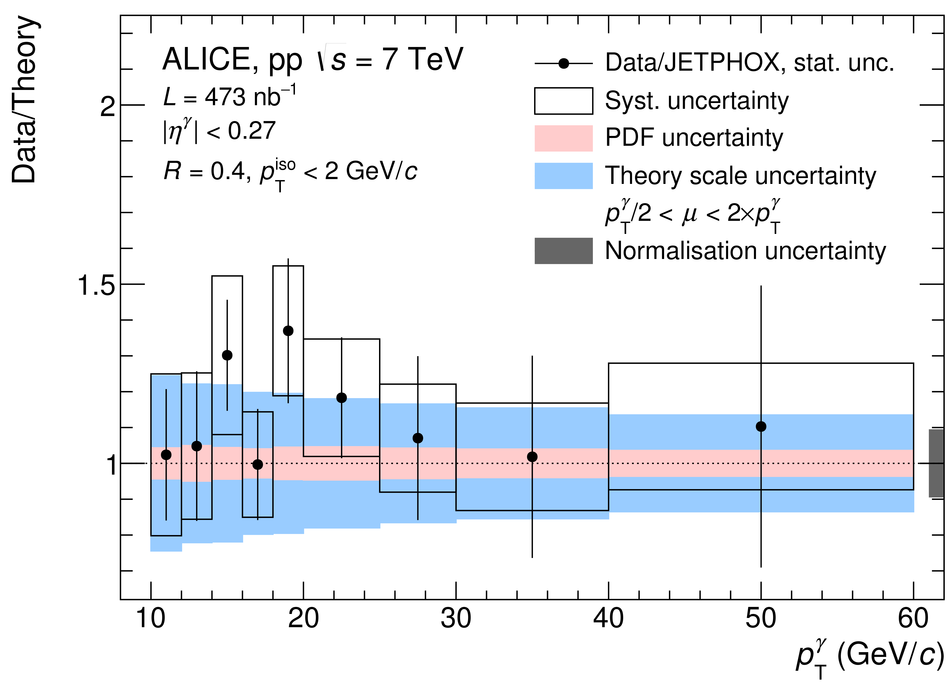
Figure 9
Ratio between differential cross section measurements and theory predictions for ATLAS , CMS and ALICE. Theory predictions are obtained with JETPHOX and CTEQ 6.6 PDFs for ATLAS, and JETPHOX and CT14 PDFs for CMS and ALICE. Only experimental uncertainties are shown here. Error bars are statistical and boxes are the quadratic sum of statistical and systematic uncertainties. The normalisation uncertainty of each experiment is presented as an overall box around unity. | 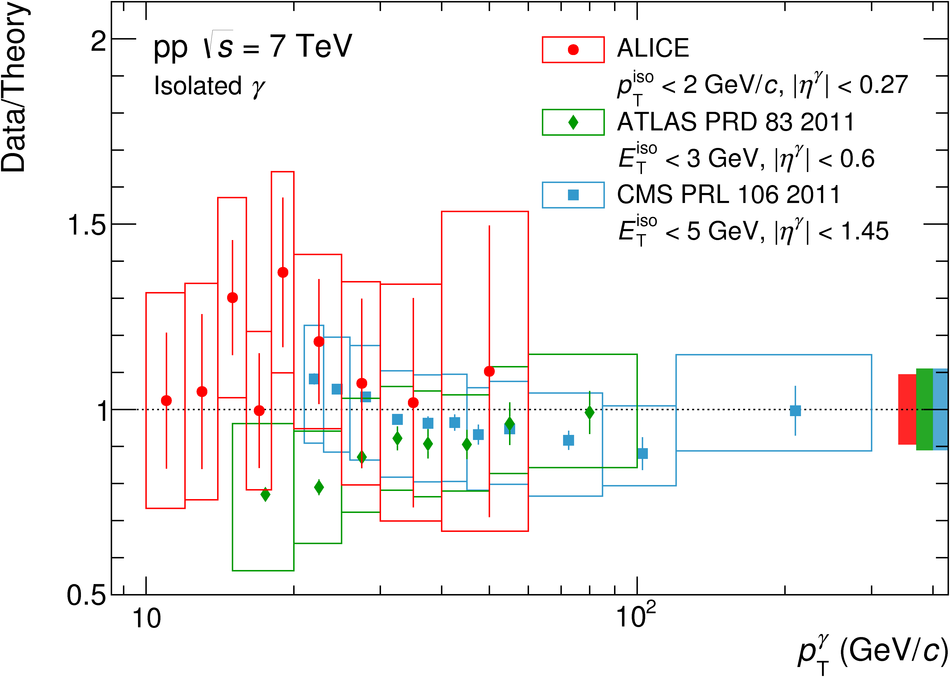 |
Figure 10
ALICE data compared to the world's data of isolated photon spectra measured in pp and p$\overline{\rm p}$ collisions as a function of $x_{\rm T }$ where the invariant cross sections have been scaled by $(\sqrt{s})^n$ with $n=4.5$ compiled in Ref. . For this comparison only the results covering mid-rapidity are shown. | 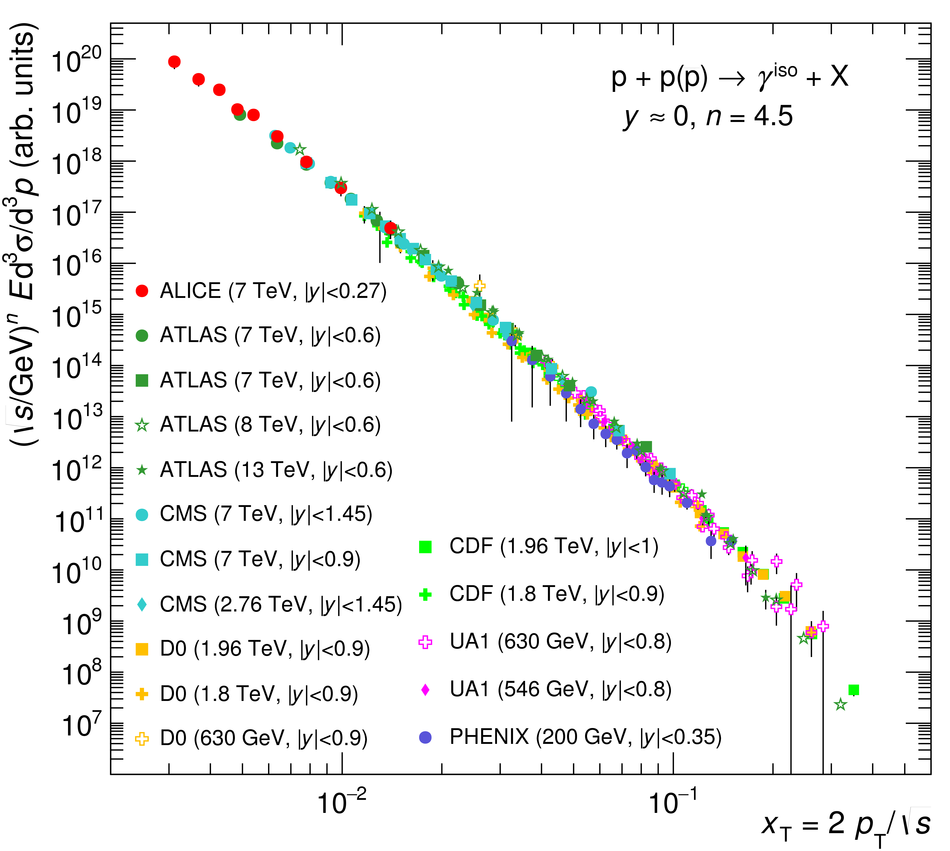 |