Ratio of dielectron spectra in HM and INEL events scaled by the charged-particle multiplicity in different \ptee intervals. The statistical and systematic uncertainties of the data are shown as vertical bars and boxes. The expectation from the hadronic decay cocktail calculation is shown as a grey band. |  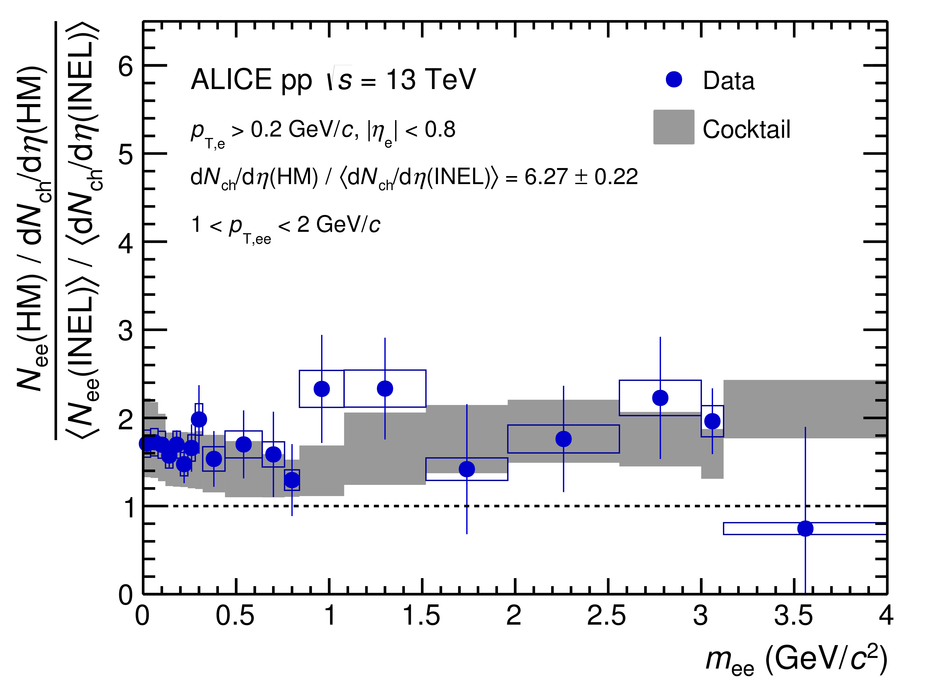 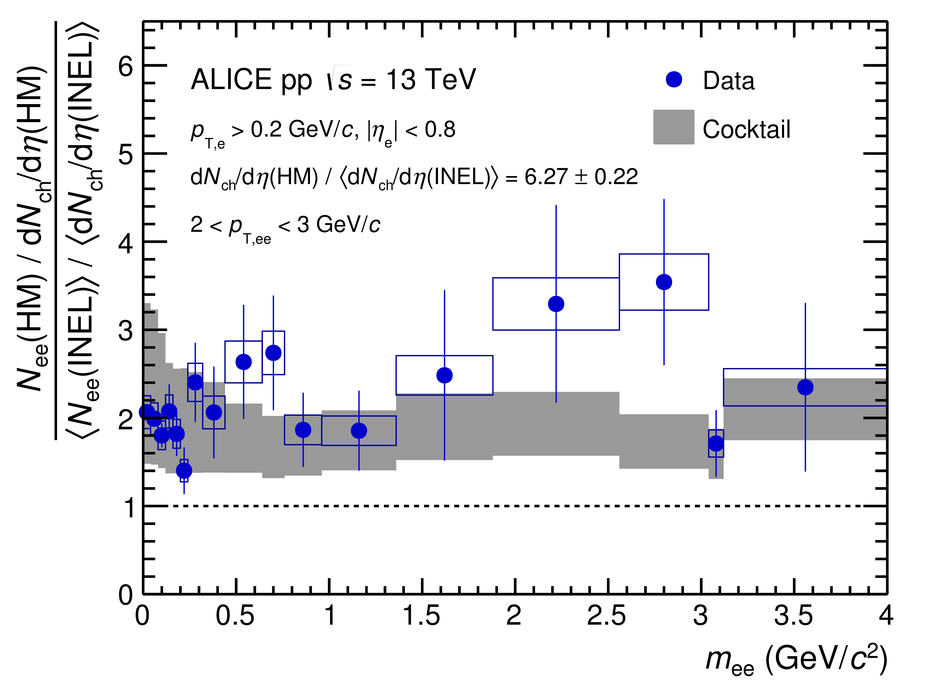 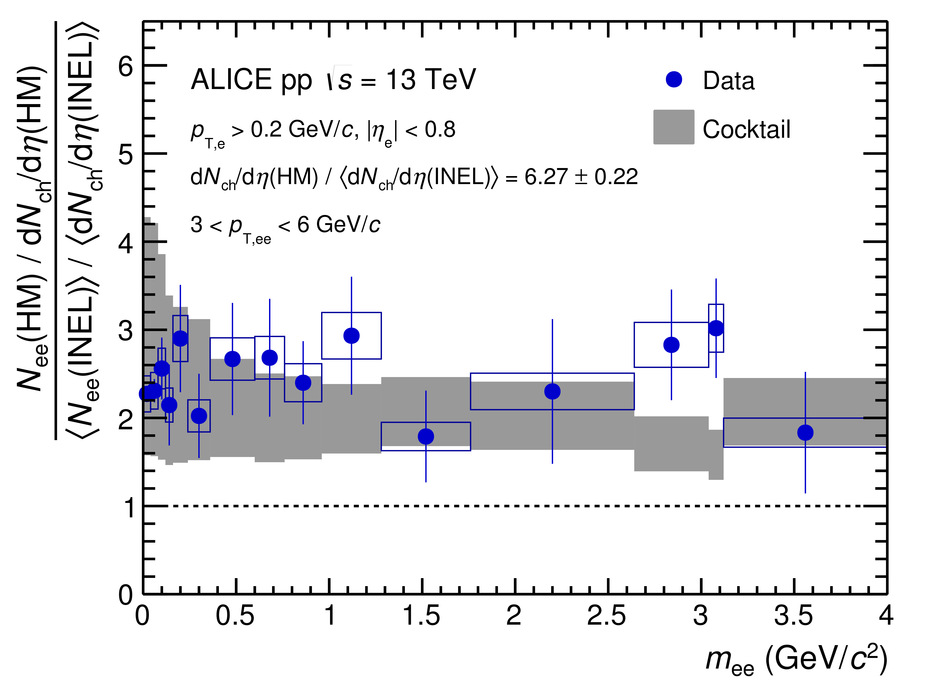 |