Centrality dependence of the CME fraction extracted from the slope parameter of fits to data and MC-Glauber , MC-KLN CGC and EKRT models, respectively (see text for details). The dashed lines indicate the physical parameter space of the CME fraction. Points are slightly shifted along the horizontal axis for better visibility. Only statistical uncertainties are shown. | 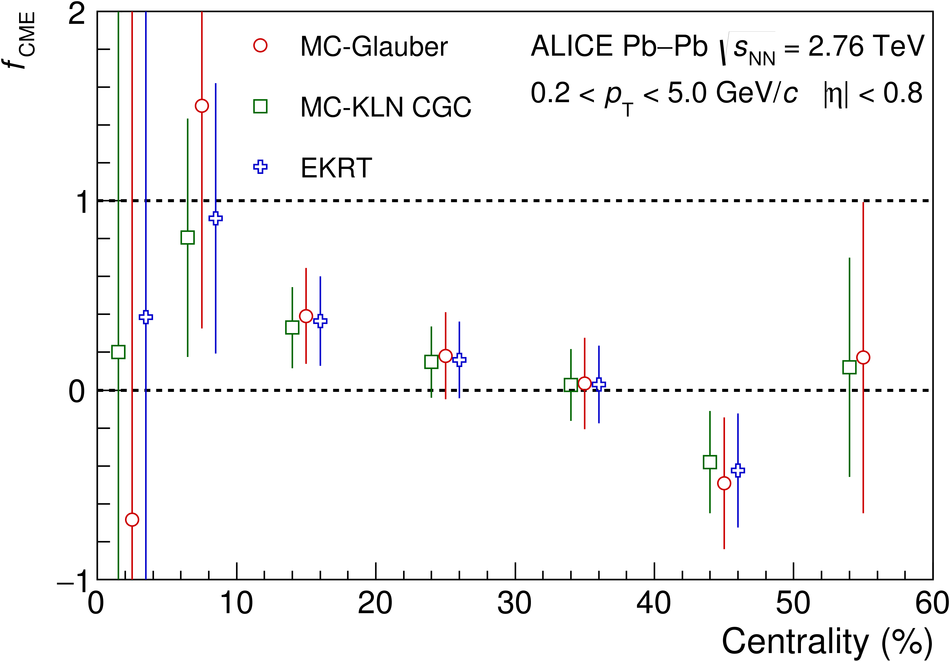 |