Top: Difference between opposite and same charge pair correlations for $\gc$ as a function of $v_2$ for shape selected events together with a linear fit (dashed lines) for various centrality classes. Bottom: Difference between opposite and same charge pair correlations for $\gc$ multiplied by the charged-particle density as a function of $v_2$ for shape selected events for various centrality classes. The event selection is based on $q_2$ determined in the V0C with the lowest (highest) value corresponding to 0--10\% (90--100\%) $q_2$. Error bars (shaded boxes) represent the statistical (systematic) uncertainties. | 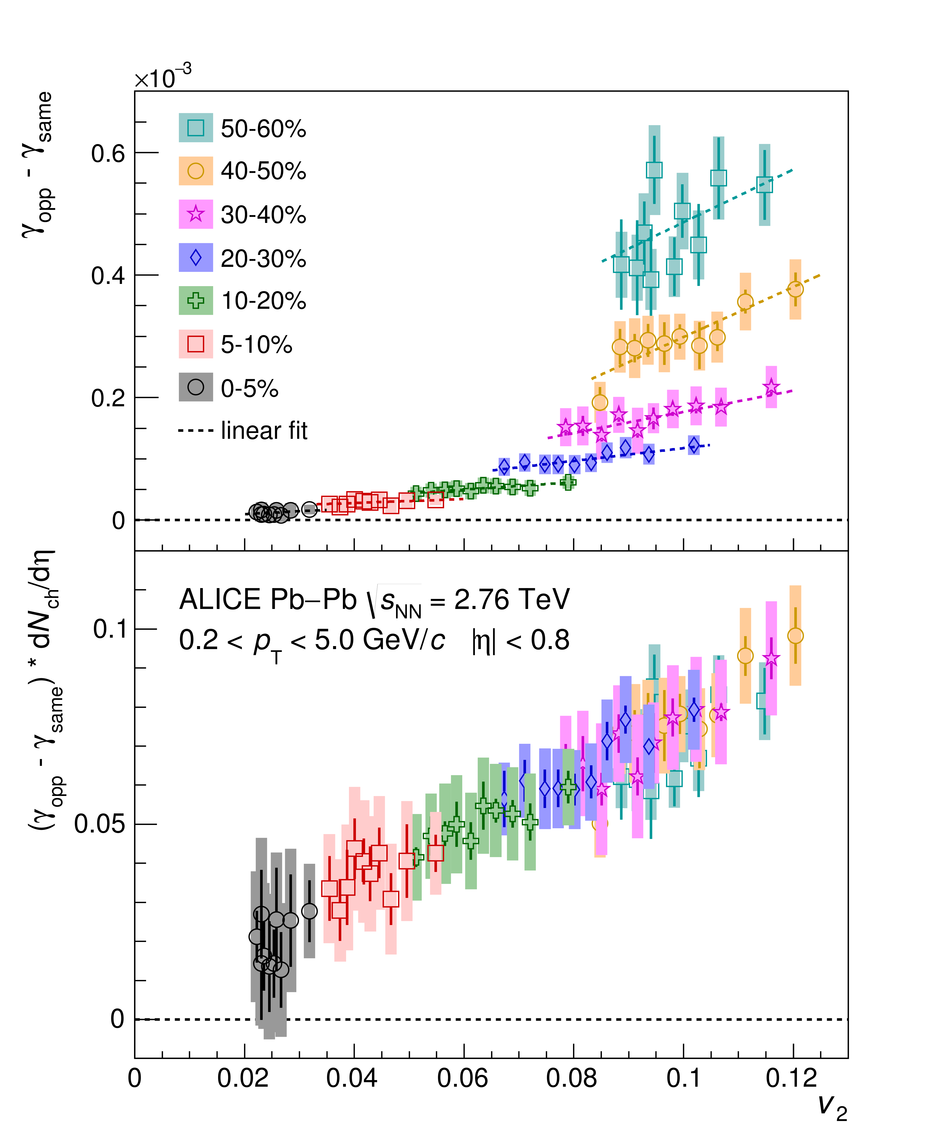 |