In this letter, the production of deuterons and anti-deuterons in pp collisions at $\sqrt{s} = 7$ TeV is studied as a function of the charged-particle multiplicity density at mid-rapidity with the ALICE detector at the LHC. Production yields are measured at mid-rapidity in five multiplicity classes and as a function of the deuteron transverse momentum ($p_{\rm{T}}$). The measurements are discussed in the context of hadron-coalescence models. The coalescence parameter $B_{2}$, extracted from the measured spectra of (anti-)deuterons and primary (anti-)protons, exhibits no significant $p_{\rm{T}}$-dependence for $p_{\rm{T}} <~ 3$ GeV/$c$, in agreement with the expectations of a simple coalescence picture. At fixed transverse momentum per nucleon, the $B_{2}$ parameter is found to decrease smoothly from low multiplicity pp Pb-Pb collisions, in qualitative agreement with more elaborate coalescence models. The measured mean transverse momentum of (anti-)deuterons in pp is not reproduced by the Blast-Wave model calculations that simultaneously describe pion, kaon and proton spectra, in contrast to central Pb-Pb collisions. The ratio between the $p_{\rm{T}}$-integrated yield of deuterons to protons, d/p, is found to increase with the charged-particle multiplicity, as observed in inelastic pp collisions at different centre-of-mass energies. The d/p ratios are reported in a wide range, from the lowest to the highest multiplicity values measured in pp collisions at the LHC.
Phys. Lett. B 794 (2019) 50-63
HEP Data
e-Print: arXiv:1902.09290 | PDF | inSPIRE
CERN-EP-2019-024
Figure 1
TOF squared-mass distribution ($m_{\rm TOF}^2$) around the anti-deuteron peak for a selected \pt interval and in the highest multiplicity class The solid red line represents a fit of a Gaussian function plus an exponential right tail to the anti-deuteron signal, the grey dashed line the fit of the background performed using the sum of two exponential functions, and the solid blue line is the sum of the signal and background components. | 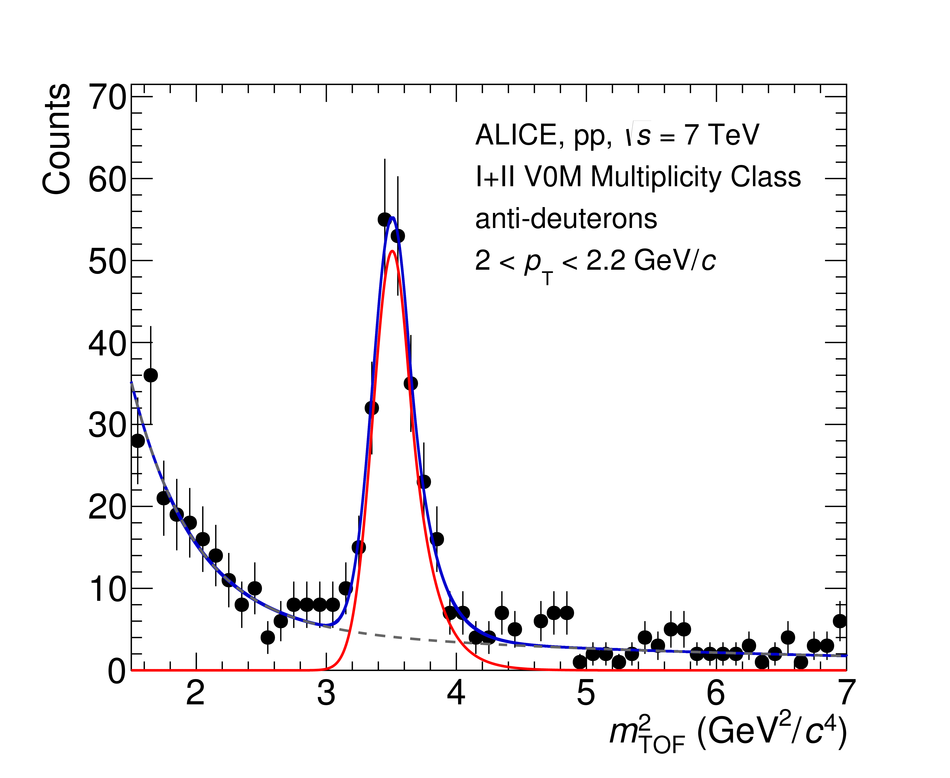 |
Figure 2
Transverse-momentum spectra of deuterons (left) and anti-deuterons (right) measured at mid-rapidity in pp collisions at \sqrtSE{7} in the considered multiplicity classes. The vertical bars are the statistical uncertainties, the open boxes represent the systematic ones. The dashed lines correspond to individual fits to the data performed with the L\'evy-Tsallis function (see Eq. \ref{eq:levy}). The spectra have been scaled with the indicated factors for better visibility. | 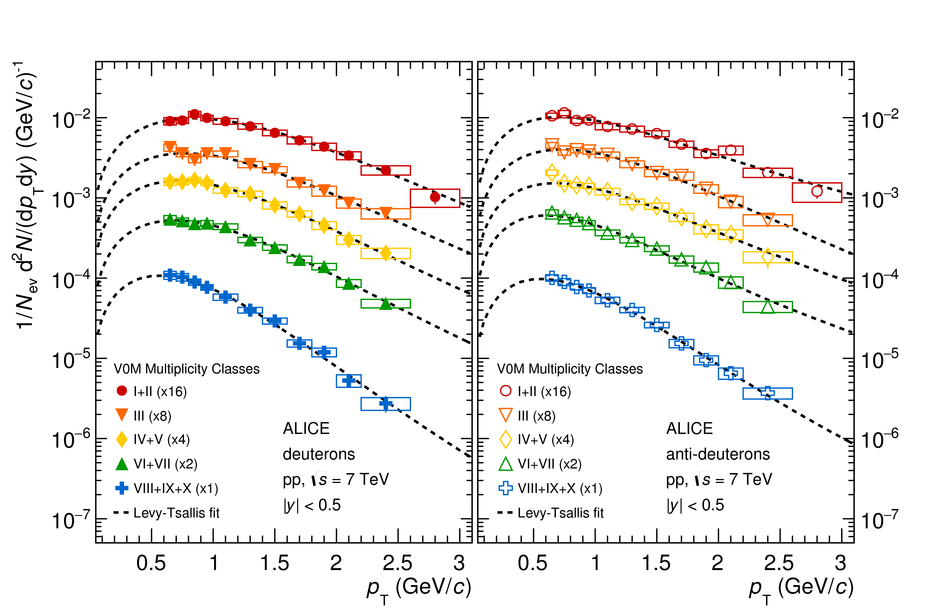 |
Figure 4
Coalescence parameter \btwo of (anti-)deuterons as a function of the transverse momentum per nucleon, \ptOa,in the considered multiplicity classes in pp collisions at \sqrtSE{7}. The vertical bars represent the statistical uncertainties, the open boxes the systematic ones. The distributions in each class are scaled by constant factors to improve visibility. | 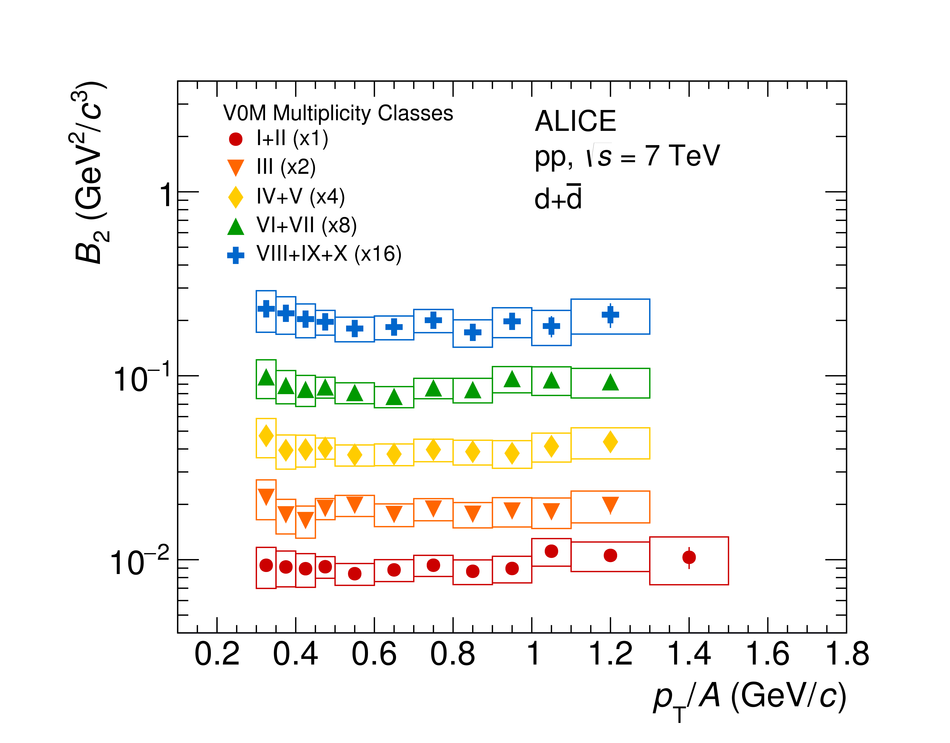 |

Figure 6
Coalescence parameter \btwo of (anti-)deuterons as a function of charged-particle multiplicity at mid-rapidityin pp and \PbPb collisions at the LHC at the transverse momentum per nucleon of 0.7 \textless \ptOa \textless 0.8 \GeVc The open boxes represent the systematic uncertainties. | 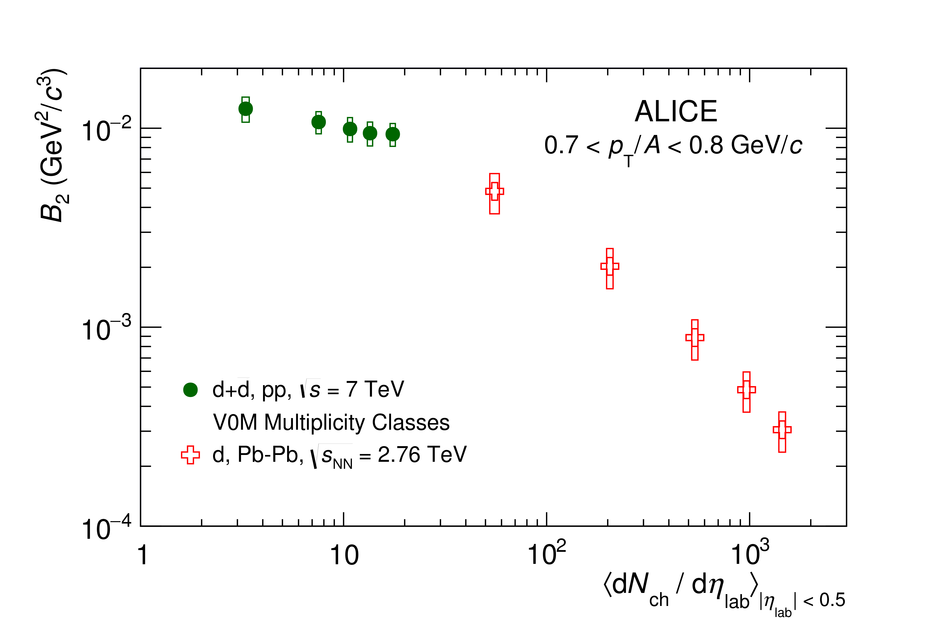 |
Figure 7
Mean transverse momentum \meanpt of deuterons and protons as a function of charged-particle multiplicity at mid-rapidityin pp collisions at the LHC The open boxes represent the total systematic uncertainty while the contribution that is uncorrelated across multiplicity (where estimated) is shown with the shaded boxes. The full shaded area corresponds to the expected mean \pt of deuterons from a simple coalescence model assuming a \pt-independent \btwo value The hollow and dashed areas correspond to the mean \pt of protons and deuterons calculated by using the Blast-Wave parametersthat simultaneously fit to the pion, kaon and proton spectra. | 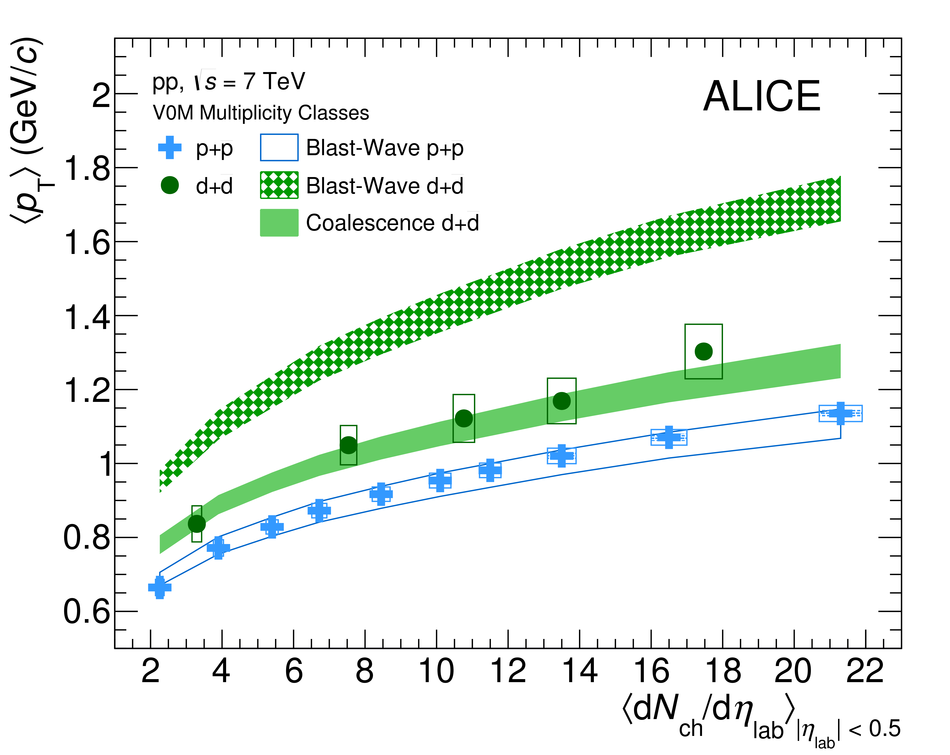 |
Figure 8
Ratio between the \pt-integrated yield of deuterons and protons as a function of charged-particle multiplicity at mid-rapidity in pp (this work) and \PbPb collisions at the LHC The deuteron-to-proton ratio measured in inelastic pp collisions at \sqrtSE{0.9, 2.76 ${\rm and}$ 7} has also been reported | 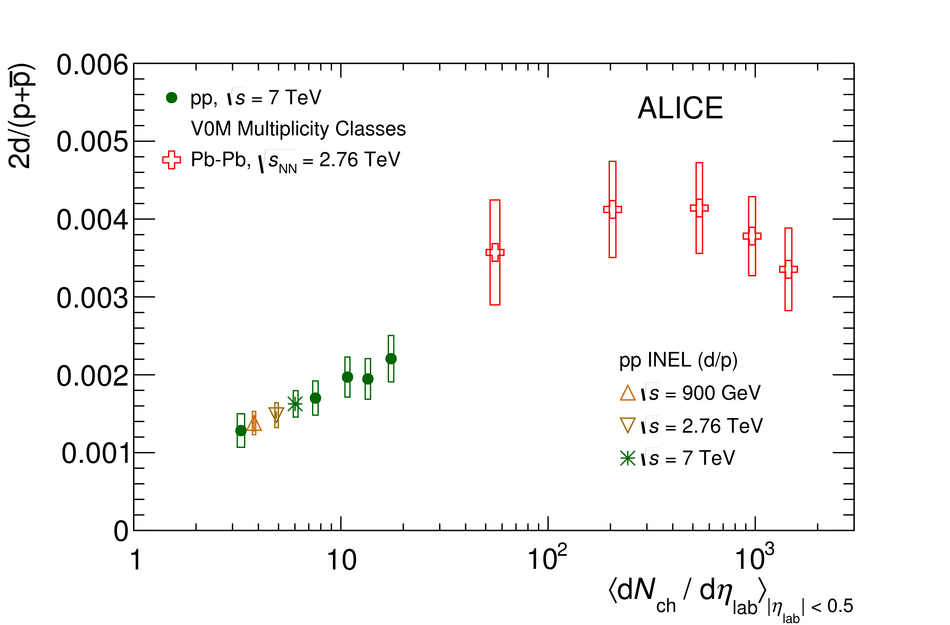 |