Top panel: Comparison of $p_{\rm{T}}$-differential $v_{\rm{2}}\{2\}/\varepsilon_{\rm{2}}\{2\}$ from Xe--Xe and Pb--Pb collisions for a selection of centrality bins. Statistical and systematic uncertainties are shown as lines and boxes, respectively. Bottom panel: Ratios of the scaled coefficients from the top panel. The Pb--Pb points are interpolated in order to determine the ratio. The circle markers show Xe--Xe 20--30\%/Pb--Pb 30--40\% while the square makers show Xe--Xe 30--40\%/Pb--Pb 30--40\%. | 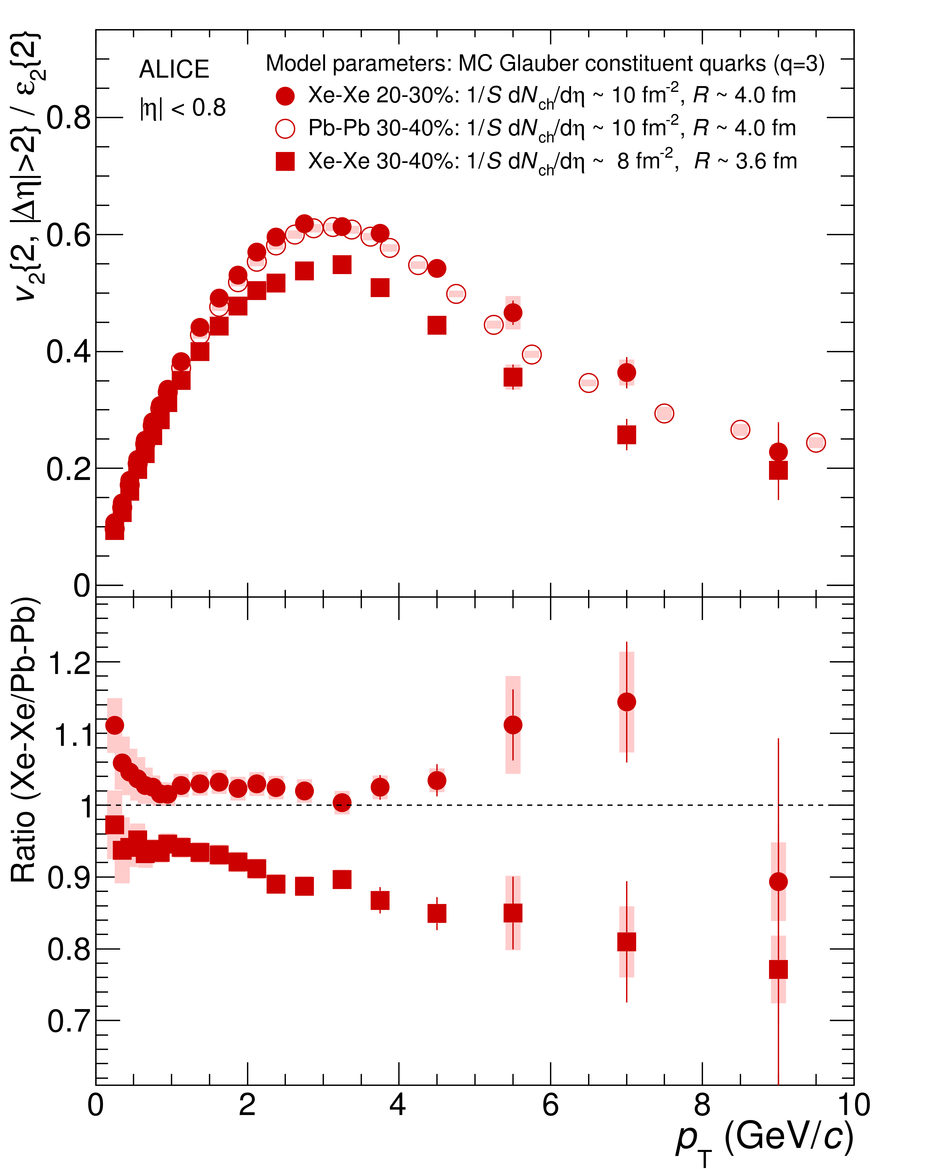 |