Measured $\varphi_{\rm{v}}$ distribution of correlated e$^{+}$e$^{-}$ pairs with \mee $< $ 0.1 GeV/$c^2$ and \ptee $< $ 8 GeV/$c$ compared with a sum of MC templates for different dielectron sources. The distributions are shown for all tracks including those that share some ITS clusters with other tracks (left) and with such tracks removed (right), as in the analysis. Only statistical uncertainties are shown for the data points. | 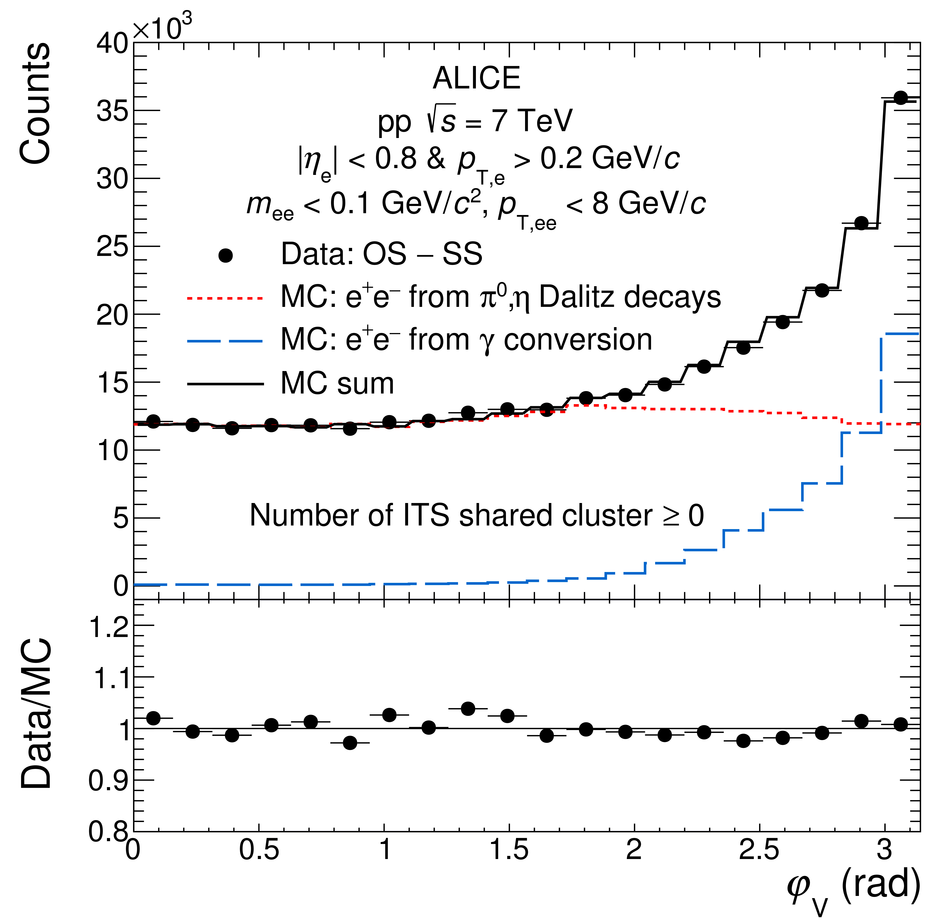 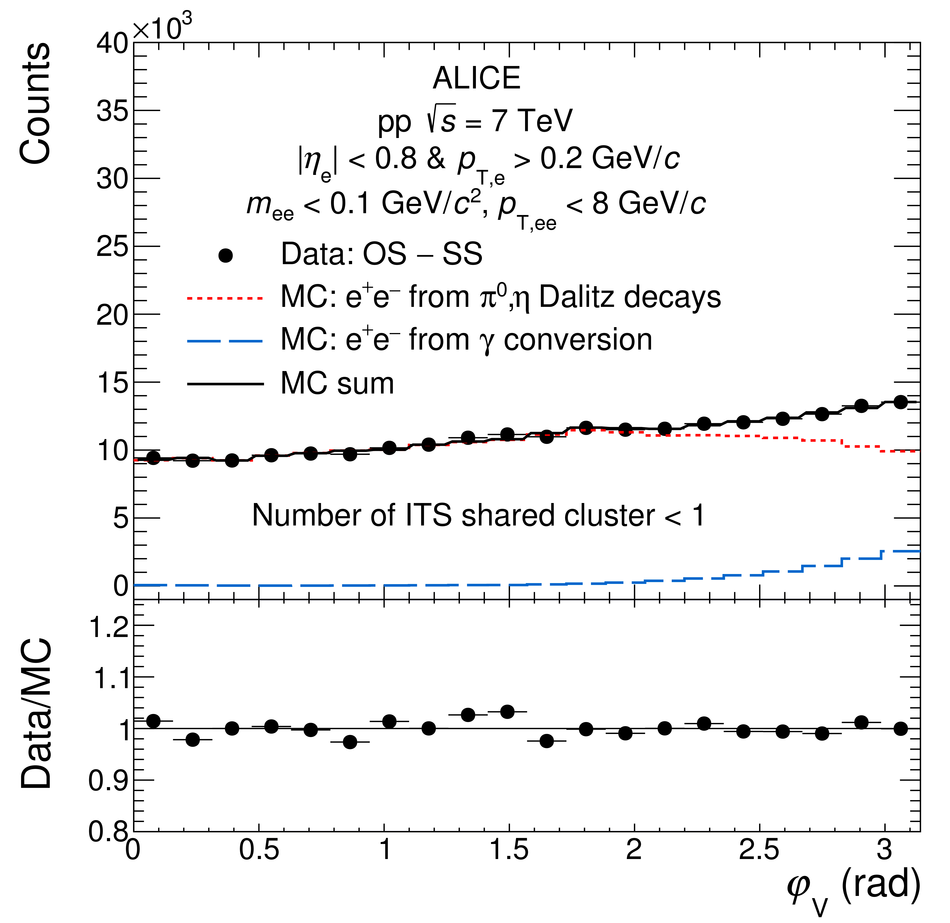 |