The ratio $R_{\rm FB}$ between the inclusive J/$\psi$ nuclear modification factors, as a function of $y_{\rm cms}$ (left) and $p_{\rm T}$ (right), relative to $2.96< |y_{\rm {cms}}|< 3.53$. The horizontal bars correspond to the bin size. The vertical error bars represent the statistical uncertainties, the boxes around the points the systematic uncertainties. The results are compared with those obtained at $\sqrt{s_{\rm NN}}=5.02$ TeV . The latter have been plotted at a slightly shifted $y_{\rm cms}$ and $p_{\rm T}$, for better visibility. | 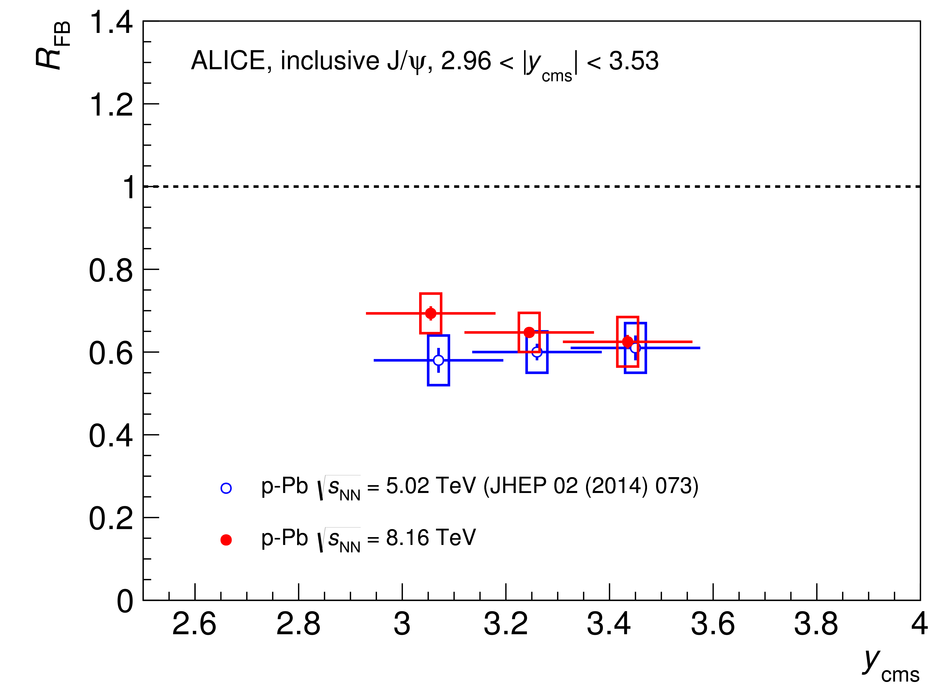  |