Invariant-mass distributions for the four D-meson species in selected $\pt$ intervals for the centrality class 0--10\%. Fitted values for the meson mass $\mu$, width $\sigma$ and raw yield $S$ are also given. Top row: $\Dzero$ mesons with $1< \pt< 2 \gev/c$, before (left) and after (right) subtraction of the background fit function. For this $\pt$ interval, the width of the Gaussian used to describe the signal is fixed to the value obtained in the simulations Middle row: $\Dplus$ mesons with $8< \pt< 10 \gev/c$ and $\Dstar$ mesons (difference of $M({\rm K}\pi\pi)$ and $M({\rm K}\pi)$) with $24< \pt< 36 \gev/c$ Bottom row: $\Ds$ mesons with $4< \pt< 6 \gev/c$ and $12< \pt< 16 \gev/c$; the $\rm \Dplus\to K^+K^-\pi^+$ signal is visible on the left of the $\Ds$ signal. | 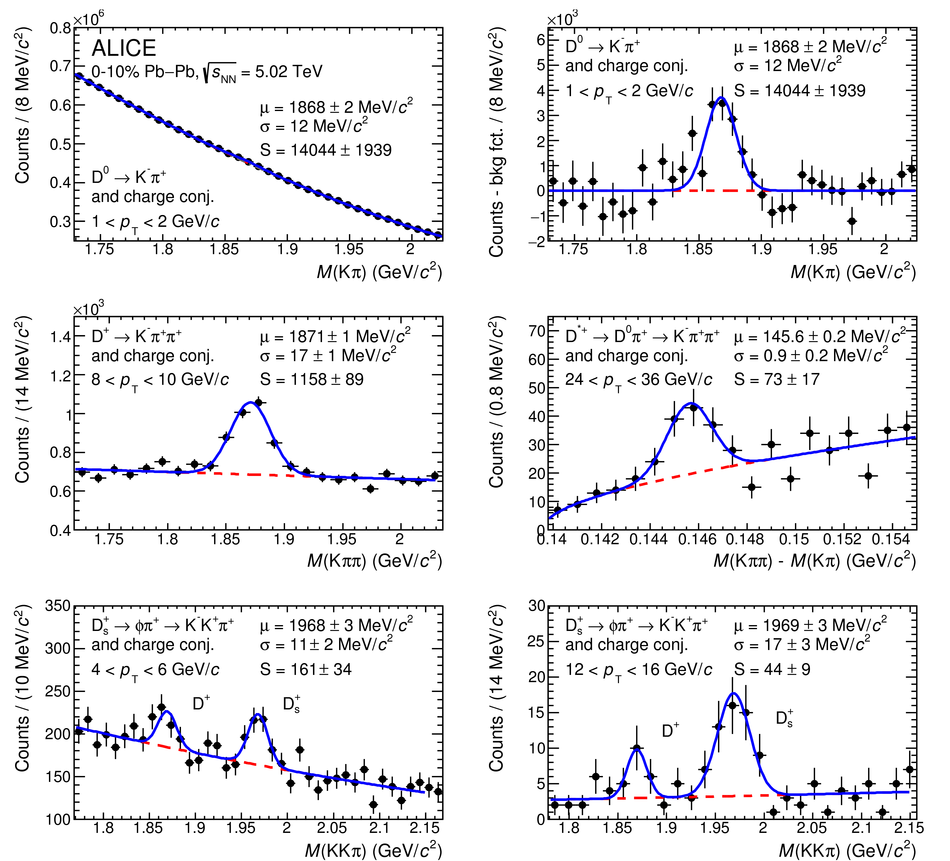 |