(a) Comparison of the \pai (open symbols) and \e (closed symbols) meson invariant \pT-differential yields to EQ and NEQ SHM and to EPOS for the two centrality classes measured. (b$-$e) Ratio of data and theory calculations to the fit of the \pai and \e invariant yields (see Fig. ??? and the left plot of this figure) in the two centrality classes measured. Black points show the data to fit ratio (vertical lines for statistical errors and boxes for systematic errors). The bold lines correspond to the ratio of the EQ and NEQ SHM predictions to the data fit, while the thin dashed lines correspond to the same ratio for the EPOS predictions . | 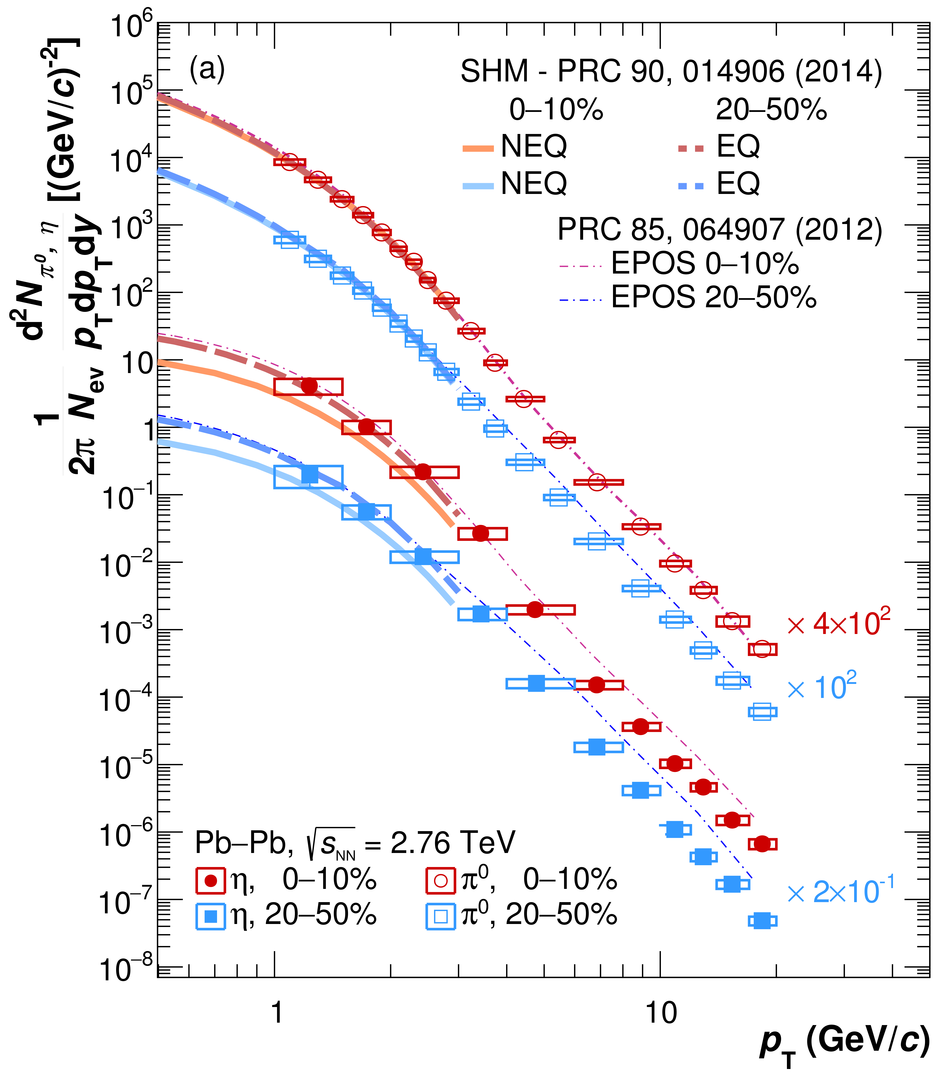 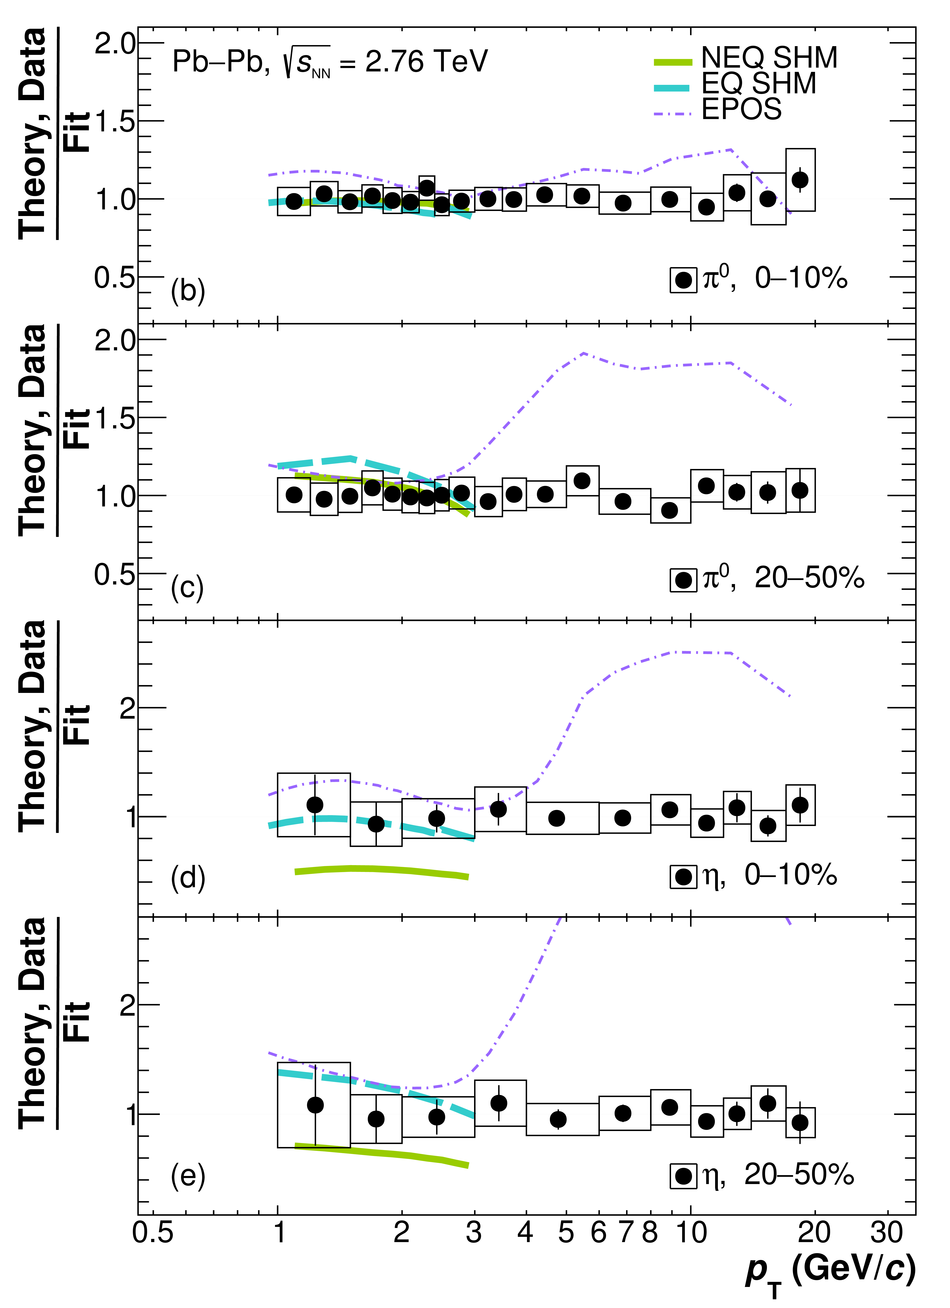 |