Invariant yields of the (a) \pai and (b) \e meson in the centrality classes 0--10\% (circles) and 20--50\% (squares). The vertical error bars represent the statistical uncertainties while the boxes represent the systematic uncertainties. The \Pb measurements are compared with the corresponding pp invariant cross sections (stars) measured at the same center-of-mass energy . The dashed black lines correspond to the fits to the data with the two-component function. See Table \ref{FitParam} and corresponding text for details. | 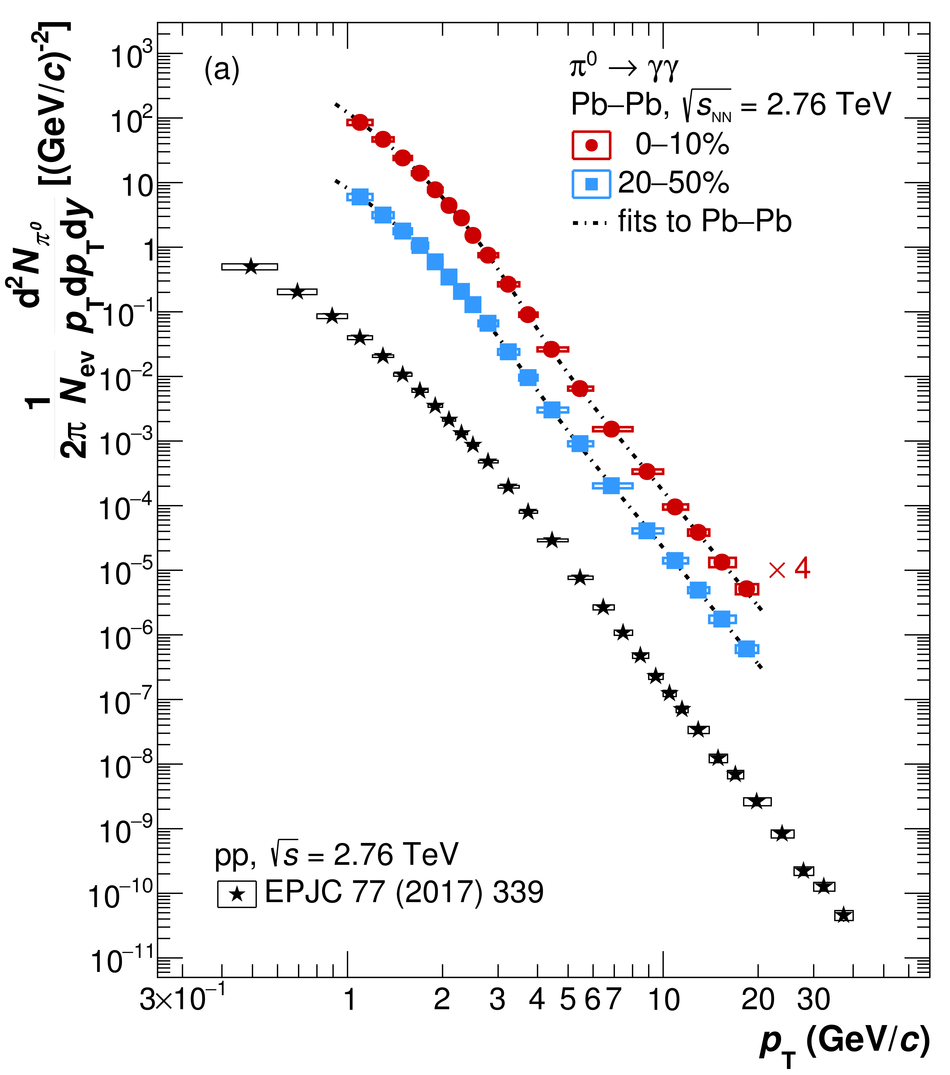 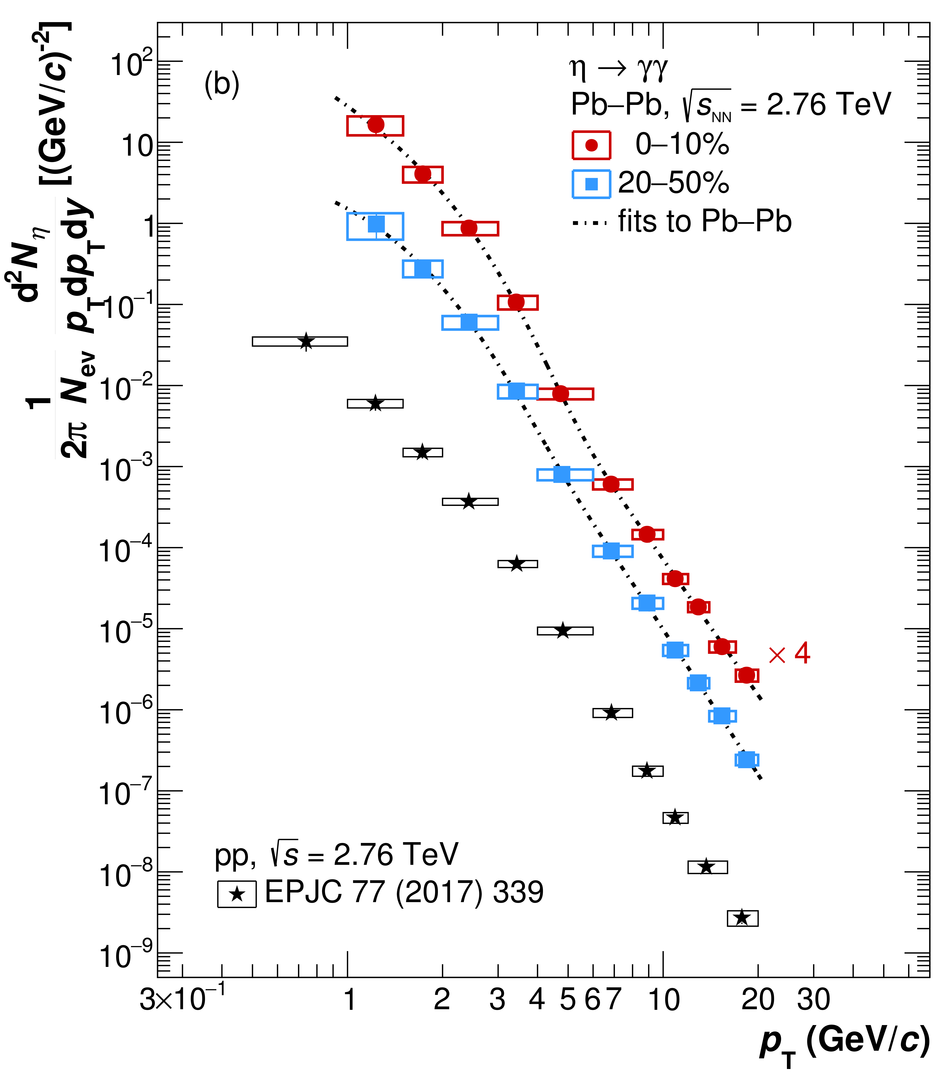 |